Azure DNS metrics and alerts
Azure DNS is a hosting service for DNS domains that provides name resolution using the Microsoft Azure infrastructure. This article describes metrics and alerts for the Azure DNS service.
Azure DNS metrics
Azure DNS provides metrics for you to monitor specific aspects of your DNS zones. With the metrics in Azure DNS, you can configure alerting based on conditions that are met. The metrics provided use the Azure Monitor service to display the data. For more information on the Metrics Explorer experience and charting, see Azure Monitor Metrics Explorer.
Azure DNS provides the following metrics to Azure Monitor for your DNS zones:
- QueryVolume
- RecordSetCount
- RecordSetCapacityUtilization
For more information, see metrics definition.
Note
At this time, these metrics are only available for Public DNS zones hosted in Azure DNS. If you have Private Zones hosted in Azure DNS, these metrics won't provide data for those zones. In addition, the metrics and alerting feature is only supported in Azure Public cloud. Support for sovereign clouds will follow at a later time.
The most granular element that you can see metrics for is a DNS zone. You currently can't see metrics for individual resource records within a zone.
Query volume
The Query Volume metric shows the number of DNS queries received by Azure DNS for your DNS zone. The unit of measurement is Count and the aggregation is the Sum of all the queries received over a period of time.
To view this metric, select Metrics explorer experience from the Monitor page in the Azure portal. Scope down to your DNS zone and then select Apply. In the drop-down for Metrics, selectQuery Volume, and then select Sum from the drop-down for Aggregation.
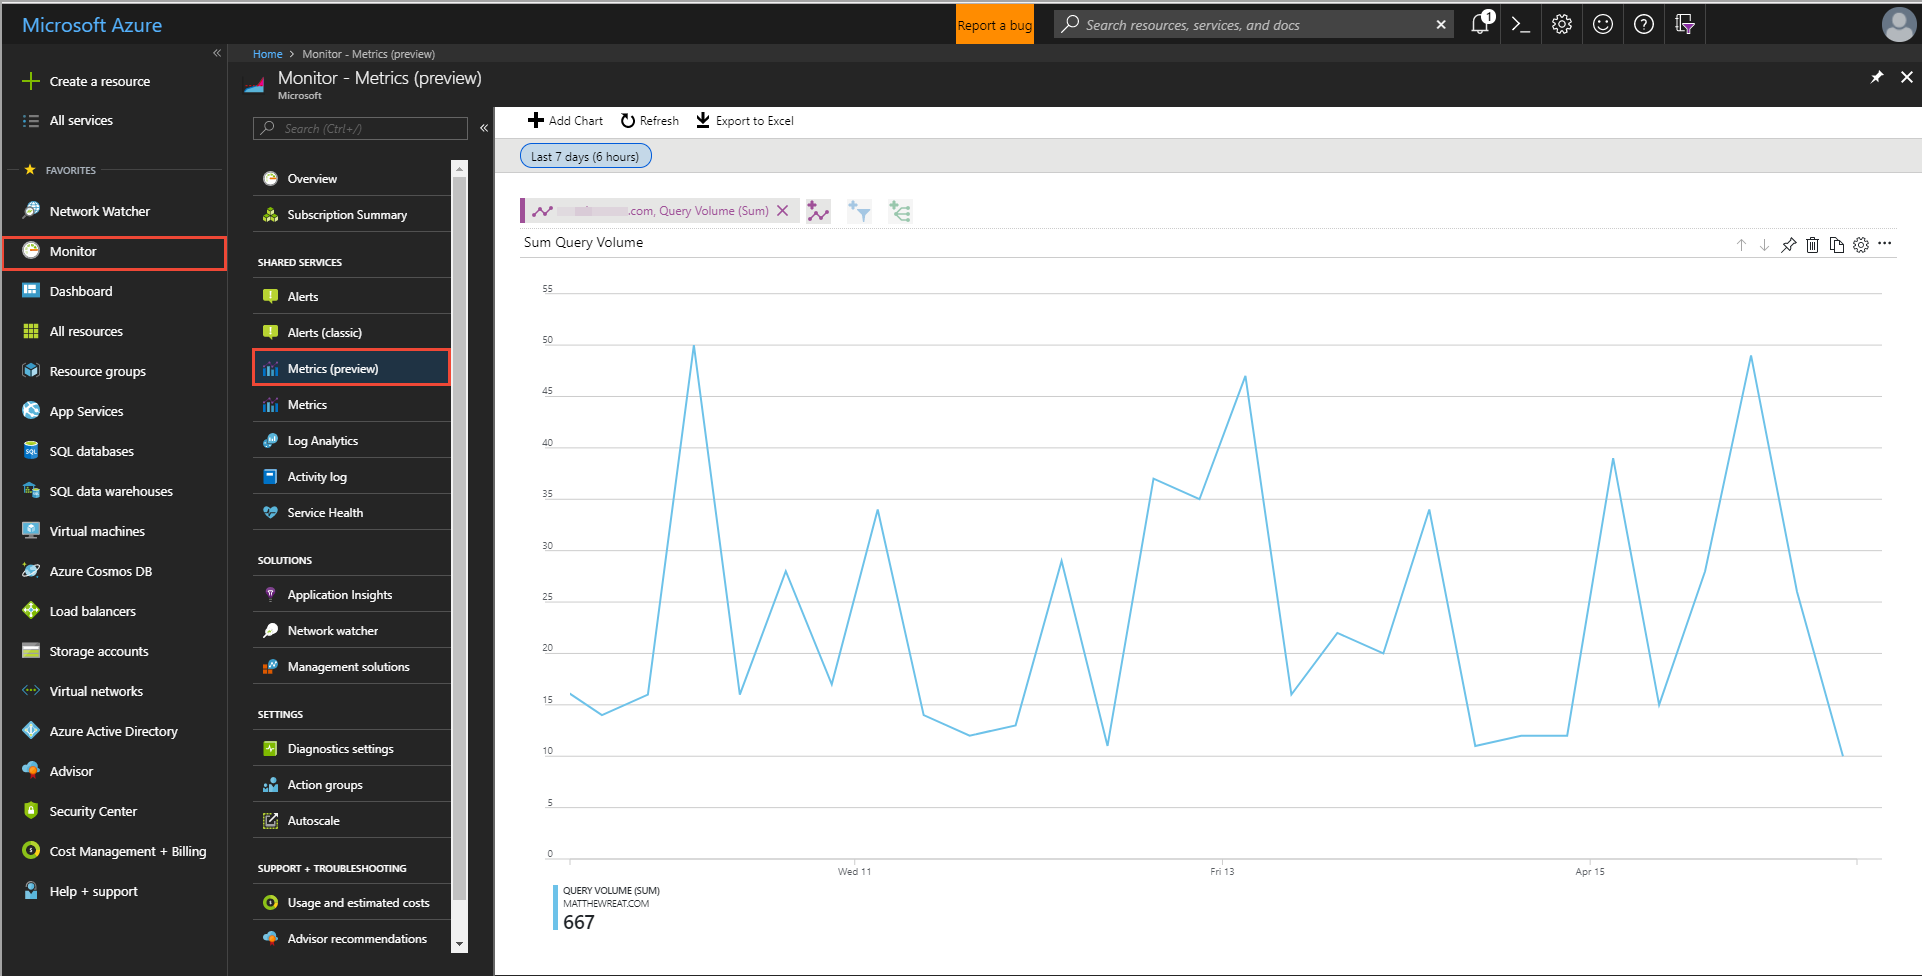
Figure: Azure DNS Query Volume metrics
Record Set Count
The Record Set Count metric shows the number of Record sets in Azure DNS for your DNS zone. All the Record sets defined in your zone are counted. The unit of measurement is Count and the aggregation is the Maximum of all the Record sets.
To view this metric, select Metrics explorer experience from the Monitor tab in the Azure portal. Scope down to your DNS zone and then select Apply. In the drop-down for Metrics, select Query Volume, and then select Sum from the drop-down for Aggregation.
Select your DNS zone from the Resource drop-down, select the Record Set Count metric, and then select Max as the Aggregation.
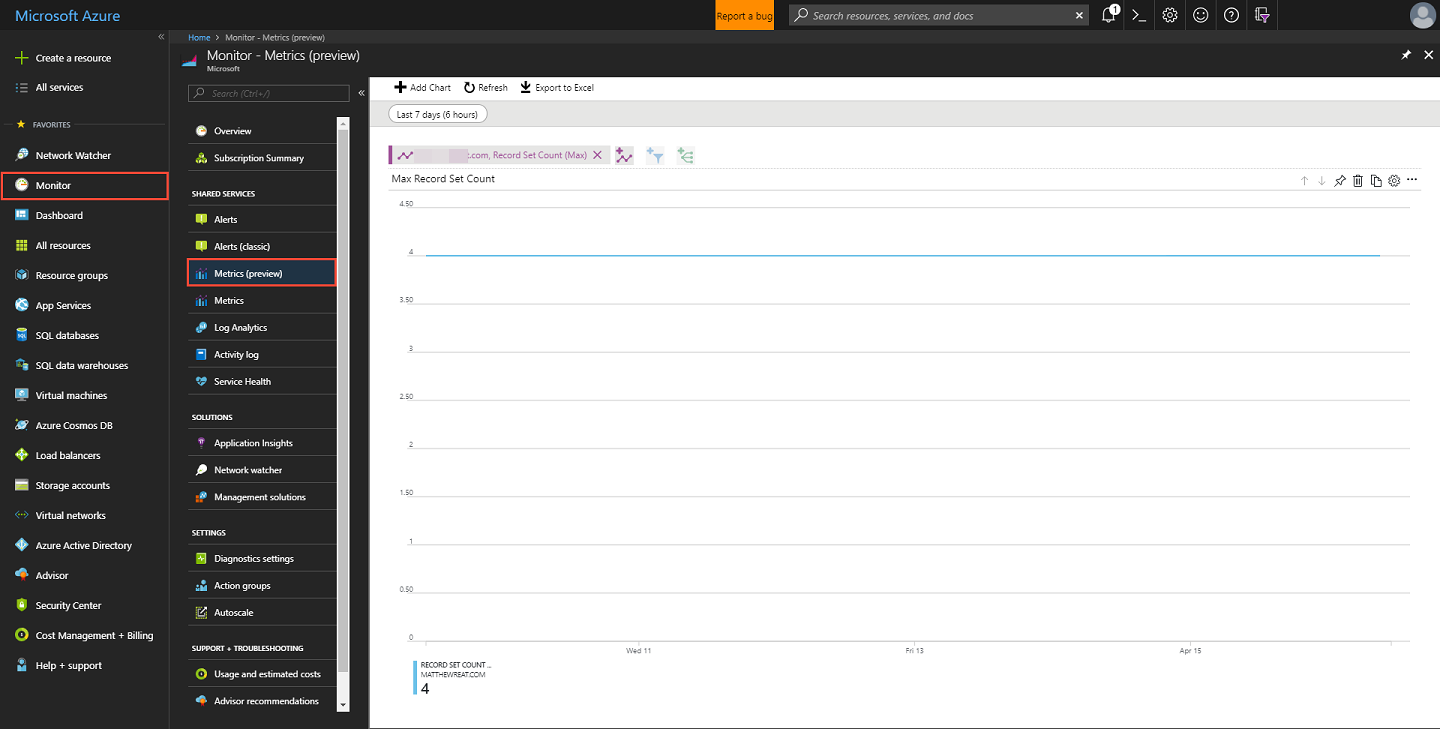
Figure: Azure DNS Record Set Count metrics
Record Set Capacity Utilization
The Record Set Capacity Utilization metric shows the percentage used of your Record set capacity for a DNS Zone. Each Azure DNS zone has a Recordset limit that defines the maximum number of Record sets allowed for the zone. For more information, see DNS limits section. The unit of measurement is a Percentage and the aggregation type is Maximum.
For example, if you have 500 Record sets configured in your DNS zone, and the zone has the default Record set limit of 5000. The RecordSetCapacityUtilization metric will show the value of 10%, which is obtained by dividing 500 by 5000.
To view this metric, select Metrics explorer experience from the Monitor tab in the Azure portal. Scope down to your DNS zone and then select Apply. In the drop-down for Metrics, select Record Set Capacity Utilization, and then select Sum from the drop-down for Aggregation.
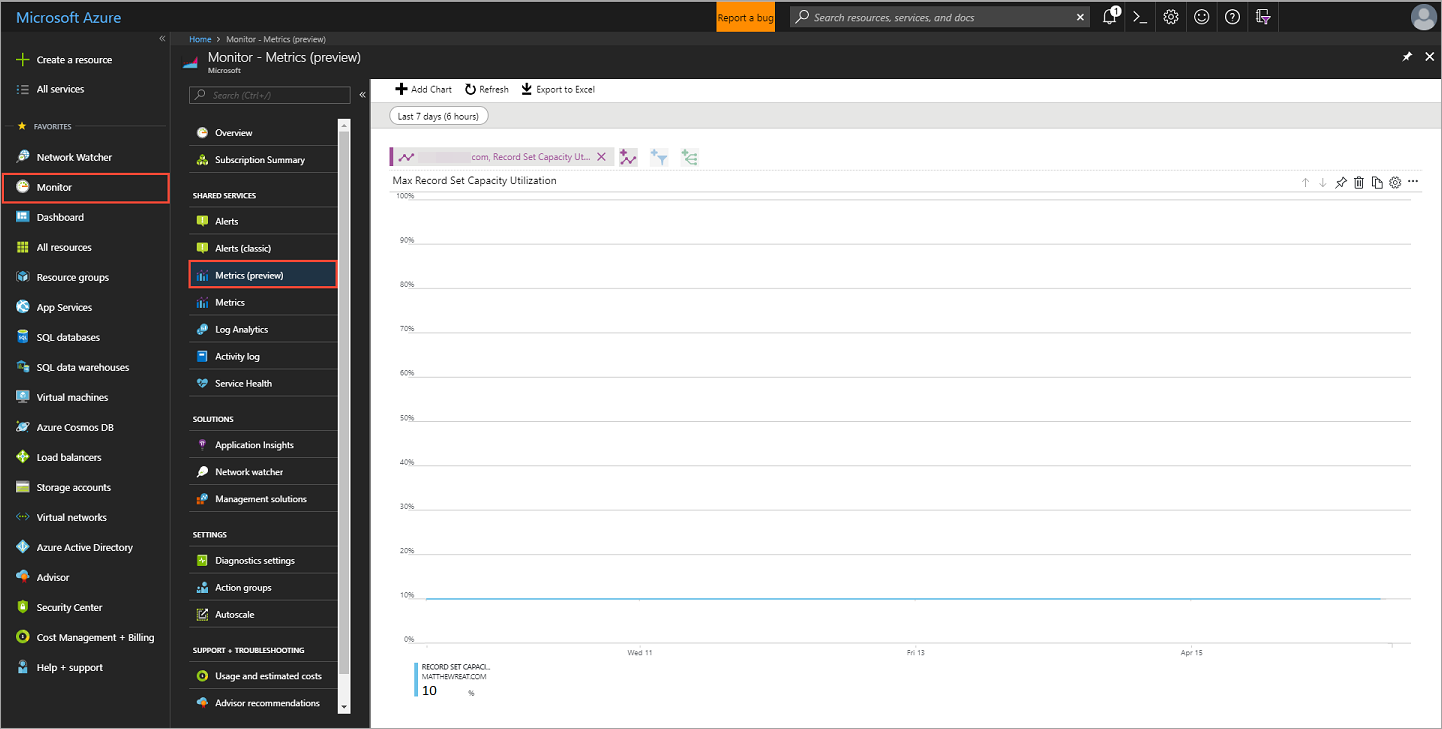
Figure: Azure DNS Record Set Capacity Utilization metrics
Alerts in Azure DNS
Azure Monitor has alerting that you can configure for each available metric value. For more information, see Azure Monitor alerts.
To configure alerting for Azure DNS zones, select Alerts from Monitor page in the Azure portal. Then select + New alert rule.
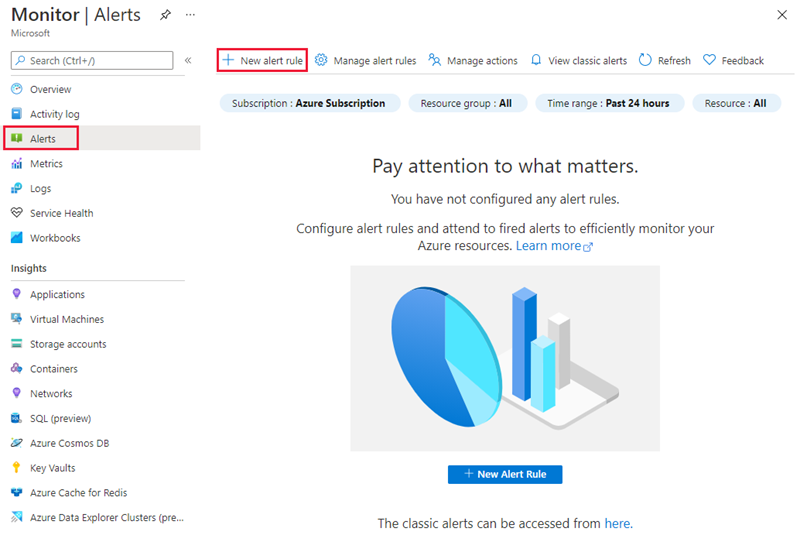
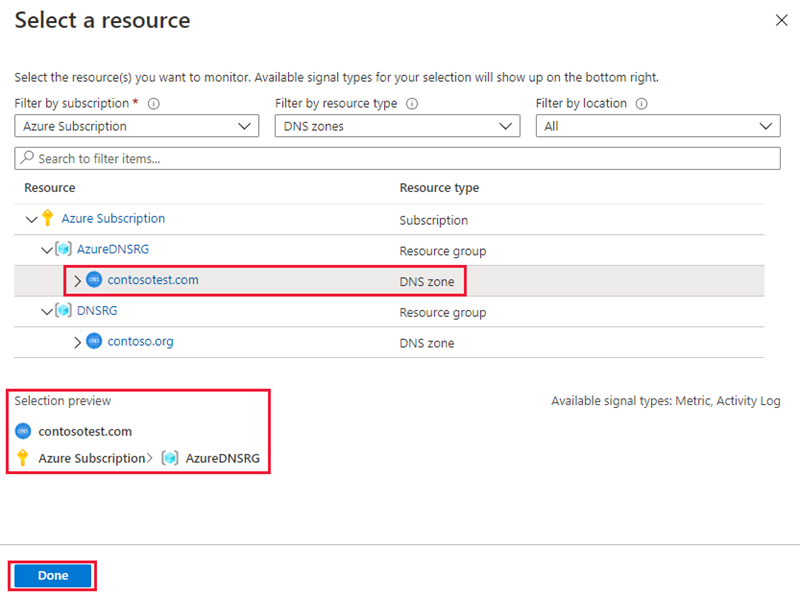
Click the Select resource link in the Scope section to open the Select a resource page. Filter by DNS zones and then select the Azure DNS zone you want as the target resource. Select Done once you've chosen the zone.
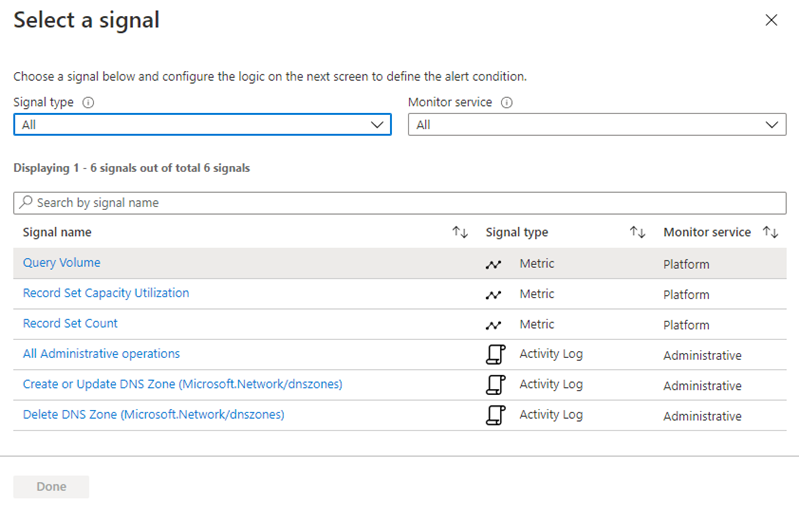
Next, click the Add condition link in the Conditions section to open the Select a signal page. Select one of the three Metric signal types you want to configure the alert for.
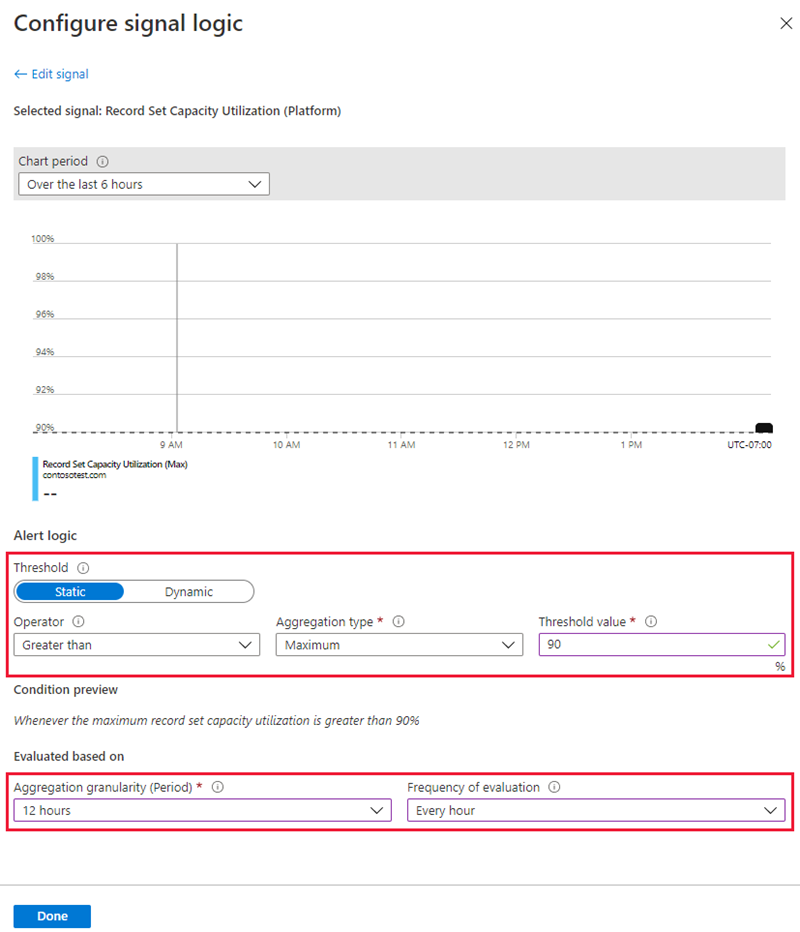
On the Configure signal logic page, configure the threshold and frequency of evaluation for the metric selected.
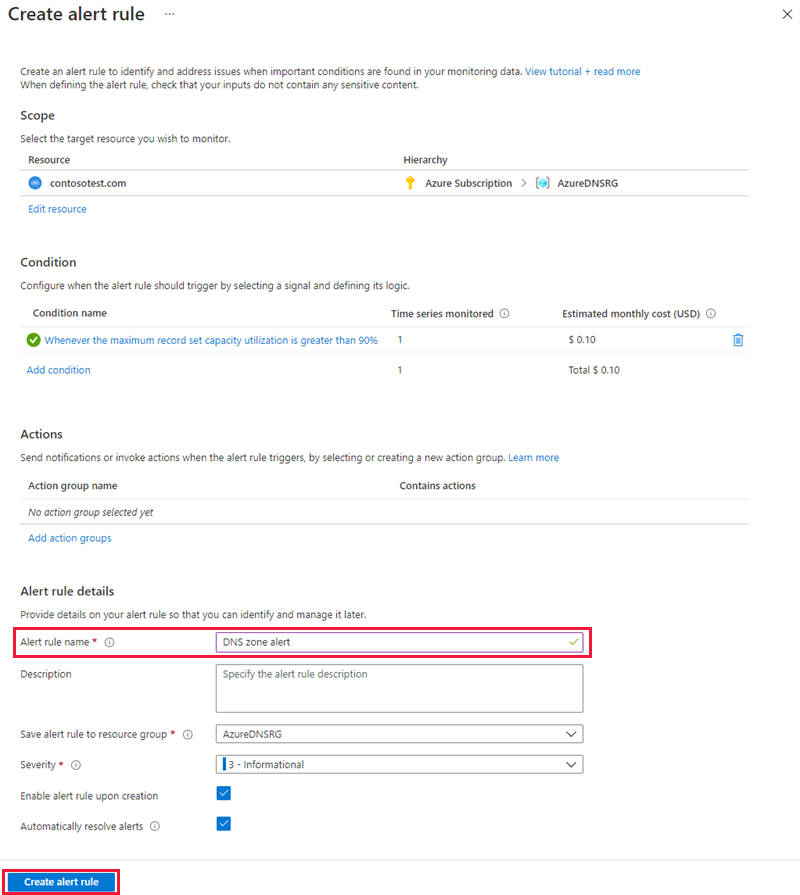
To send a notification or invoke an action triggered by the alert, click the Add action groups. On the Add action groups page, select + Create action group. For more information, see Action Group.
Enter an Alert rule name then select Create alert rule to save your configuration.
For more information on how to configure alerting for Azure Monitor metrics, see Create, view, and manage alerts using Azure Monitor.
Next steps
- Learn more about Azure DNS.
Feedback
Coming soon: Throughout 2024 we will be phasing out GitHub Issues as the feedback mechanism for content and replacing it with a new feedback system. For more information see: https://aka.ms/ContentUserFeedback.
Submit and view feedback for