To create a DNS security policy using the Azure portal:
On the Azure portal Home page, search for and select DNS Security Policies. You can also choose Dns Security Policy from the Azure Marketplace.
Select + Create to begin creating a new policy.
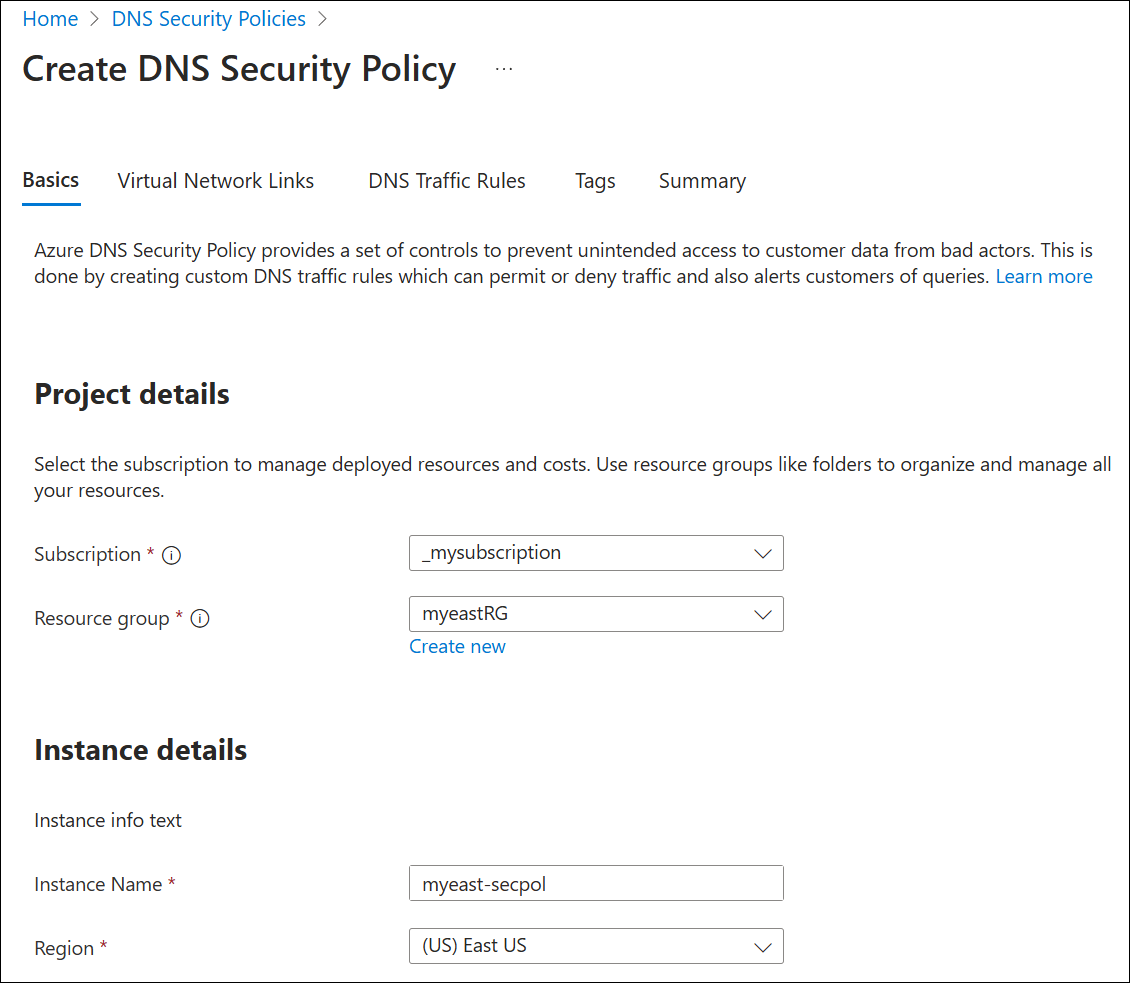
On the Basics tab, select the Subscription and Resource group, or create a new resource group.
Next to Instance Name, enter a name for the DNS security policy and then choose the Region where the security policy applies.
Note
A DNS security policy can only be applied to VNets in the same region as the security policy.
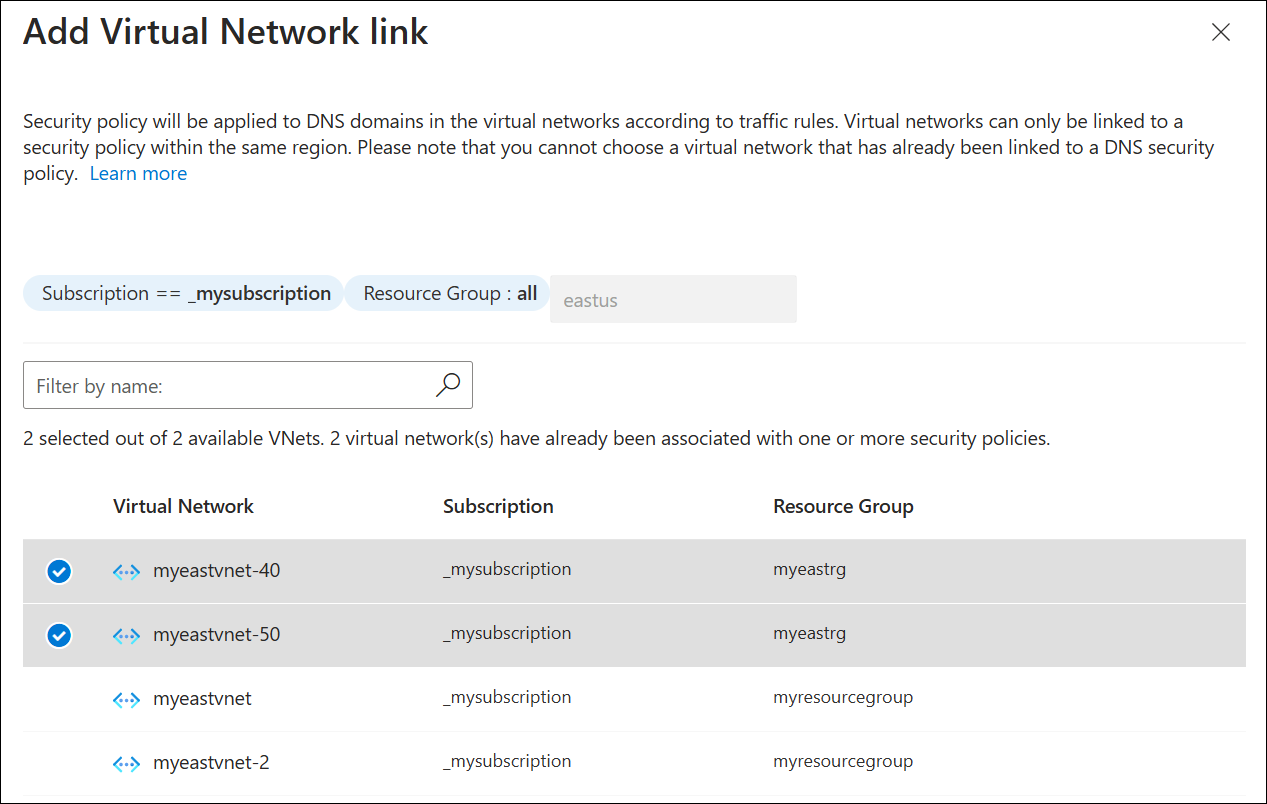
Select Next: Virtual Networks Link and then select + Add.
VNets in the same region as the security policy are displayed. Select one or more available VNets and then select Add. You can't choose a VNet that is already associated with another security policy. In the following example, two VNets are associated with a security policy, leaving two VNets available to select.
VNets that were selected are displayed. If desired, you can remove VNets from the list before creating virtual network links.
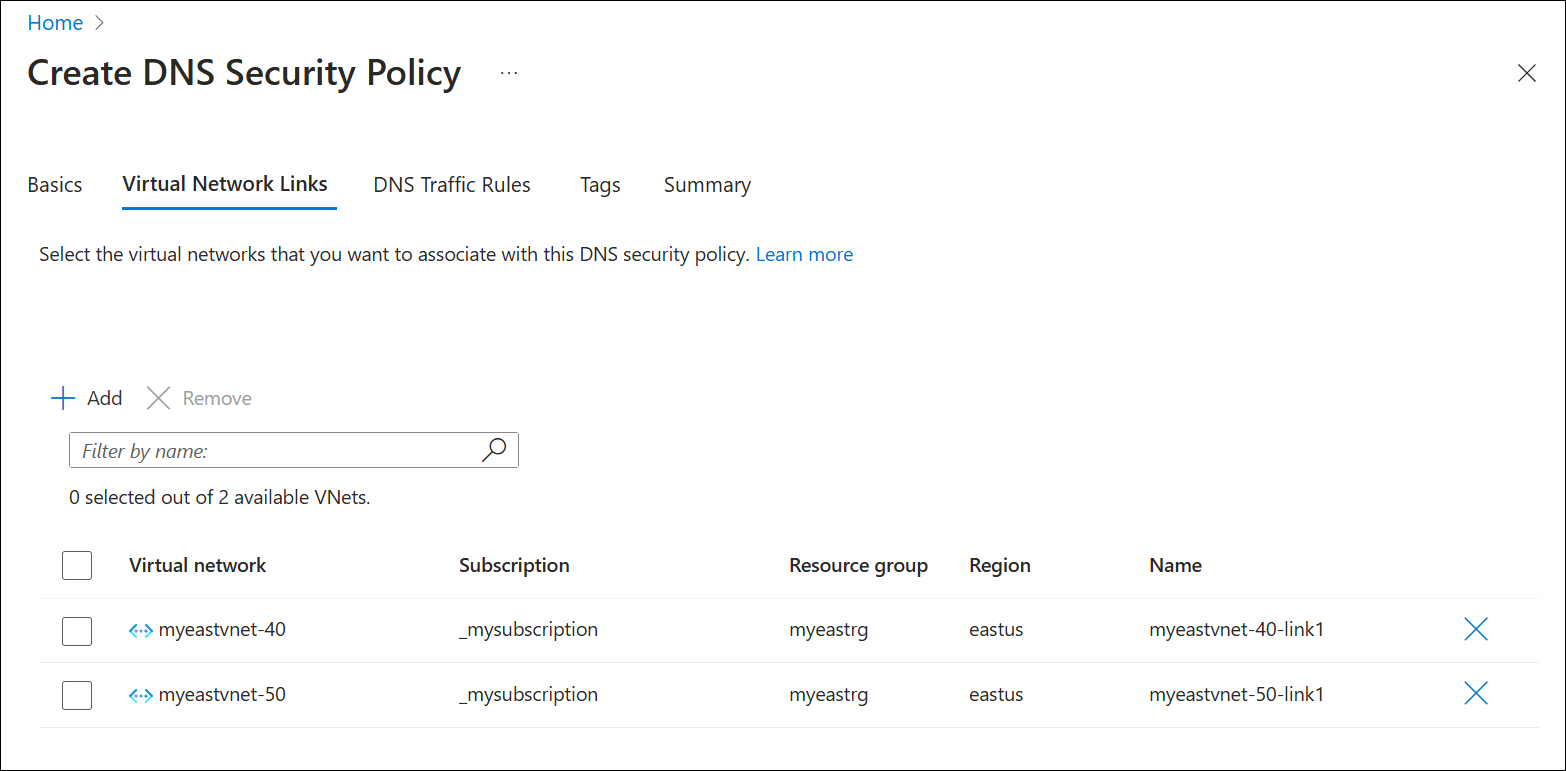
Note
Virtual network links are created for all VNets displayed in the list, whether or not they are selected. Use checkboxes to select VNets for removal from the list.
Select Review + create and then select Create. Choosing Next: DNS Traffic Rules is skipped here, but you can also create traffic rules now. In this guide, traffic rules and DNS domain lists are created and applied to DNS security policy later.
Create a log analytics workspace
Skip this section if you already have a Log Analytics Workspace that you'd like to use.
To create a Log Analytics Workspace using the Azure portal:
On the Azure portal Home page, search for and select Log Analytics workspaces. You can also choose Log Analytics Workspace from the Azure Marketplace.
Select + Create to begin creating a new workspace.
On the Basics tab, select the Subscription and Resource group, or create a new resource group.
Next to Name, enter a name for the workspace and then choose the Region for the workspace.
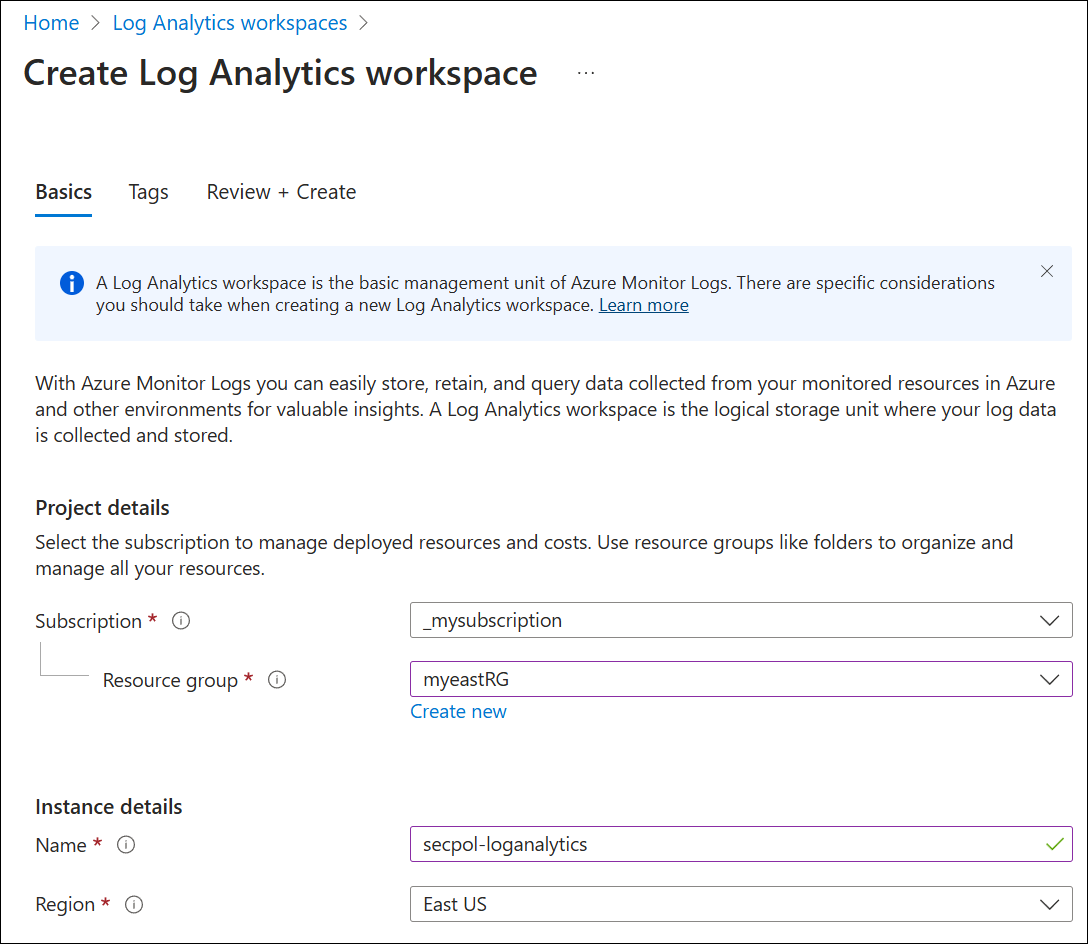
Select Review + create and then select Create.
Now that you have a Log Analytics Workspace, configure the diagnostic settings in your security policy to use this workspace.
To configure diagnostic settings:
Select the DNS security policy that you created (myeast-secpol in this example).
Under Monitoring, select Diagnostic settings.
Select Add diagnostic setting.
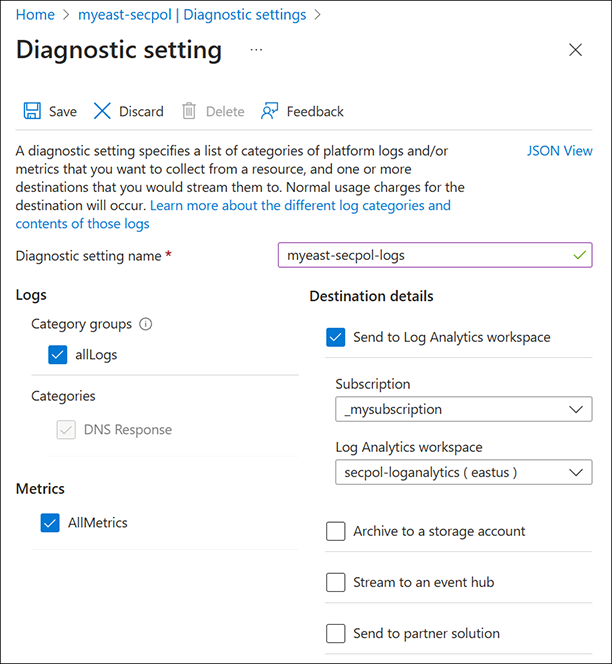
Next to Diagnostic setting name, enter a name for the logs you collect here.
Under Logs and under Metrics select "all" logs and metrics.
Under Destination details, select Send to Log Analytics workspace and then choose the subscription and workspace that you created.
Select Save. See the following example.
Create a DNS domain list
To create a DNS domain list using the Azure portal:
On the Azure portal Home page, search for and select DNS Domain Lists.
Select + Create to begin creating a new domain list.
On the Basics tab, select the Subscription and Resource group, or create a new resource group.
Next to Domain list name, enter a name for the domain list and then choose the Region for the list.
Note
Security policies require domain lists in the same region.
Select Next: DNS Domains.
On the DNS Domains tab, enter domain names manually one at a time, or import them from a comma-separated-value (CSV) file.
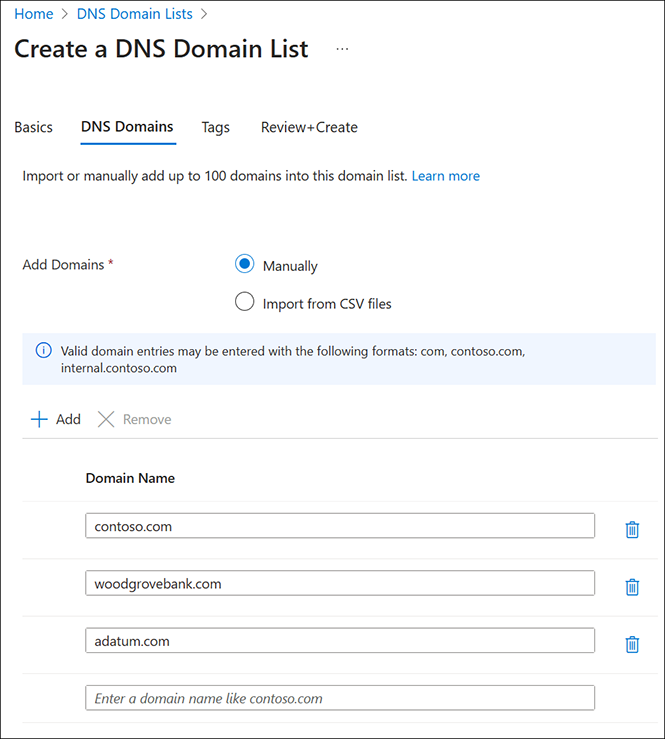
When you complete entering domain names, select Review + create and then select Create.
Repeat this section to create more domain lists if desired. Each domain list can be associated to a traffic rule that has one of three actions:
- Allow: Permit the DNS query and log it.
- Block: Block the DNS query and log the block action.
- Alert: Permit the DNS query and log an alert.
Multiple domain lists can be dynamically added or removed from a single DNS traffic rule.
Now that you have a DNS domain list, configure the diagnostic settings in your security policy to use this workspace.
Note
CNAME chains are examined ("chased") to determine if the traffic rules that are associated with a domain should apply. For example, a rule that applies to malicious.contoso.com also applies to adatum.com if adatum.com maps to malicious.contoso.com or if malicious.contoso.com appears anywhere in a CNAME chain for adatum.com.
To configure diagnostic settings:
Select the DNS security policy that you created (myeast-secpol in this example).
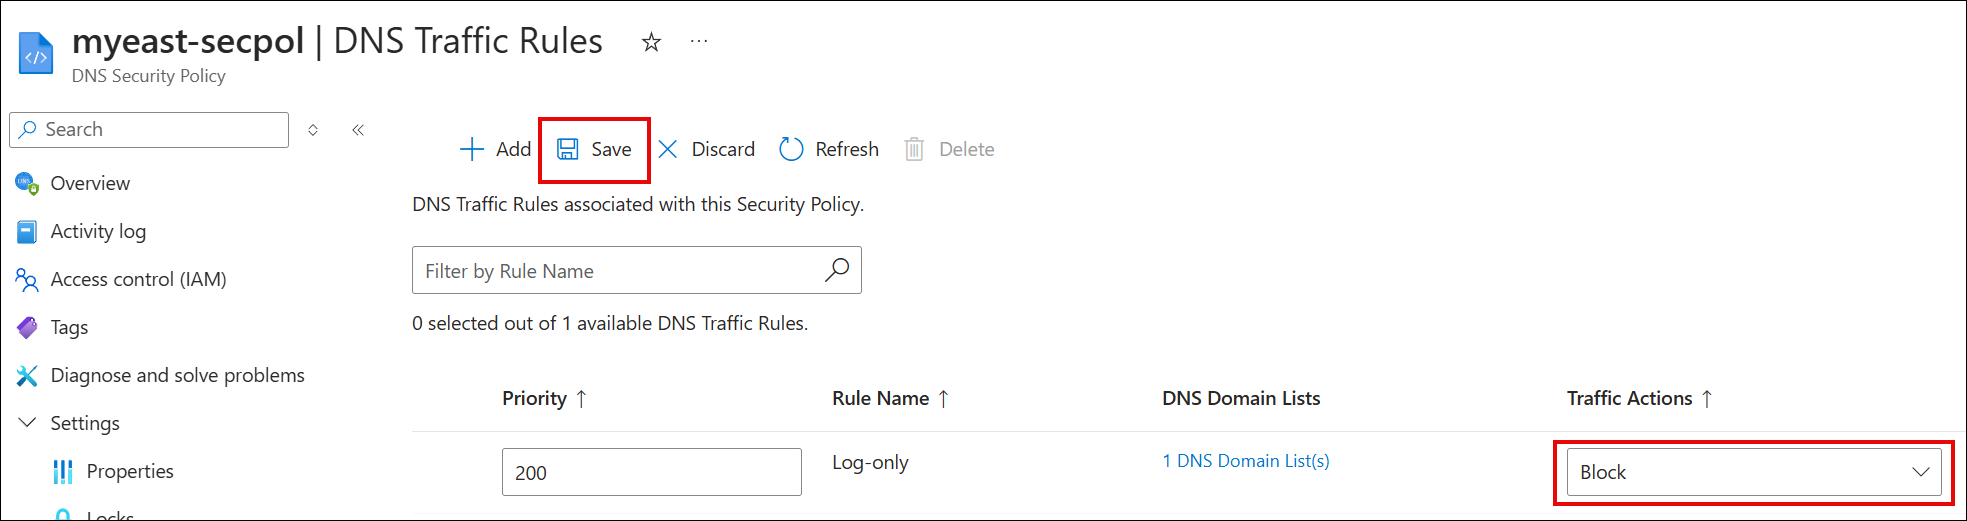
Under Settings, select DNS Traffic Rules.
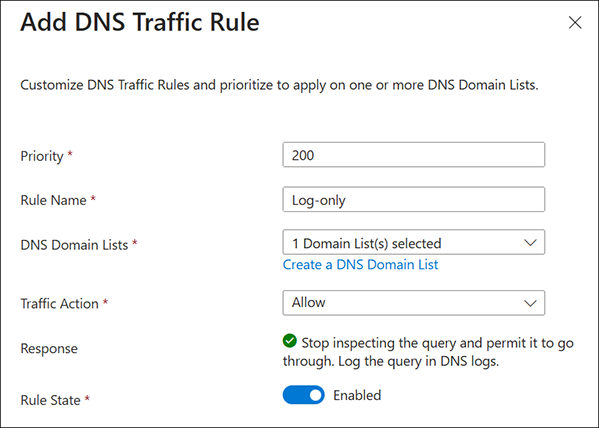
Select + Add. The Add DNS Traffic Rule pane opens.
Next to Priority, enter a value in the range of 100-65000. Lower number rules have higher priority.
Next to Rule Name, enter a name for the rule.
Next to DNS Domain Lists, select the domain lists to be used in this rule.
Next to Traffic Action, select Allow, Block, or Alert based on the type of action that should apply to the selected domains. In this example, Allow is chosen.
Leave the default Rule State as Enabled and select Save.
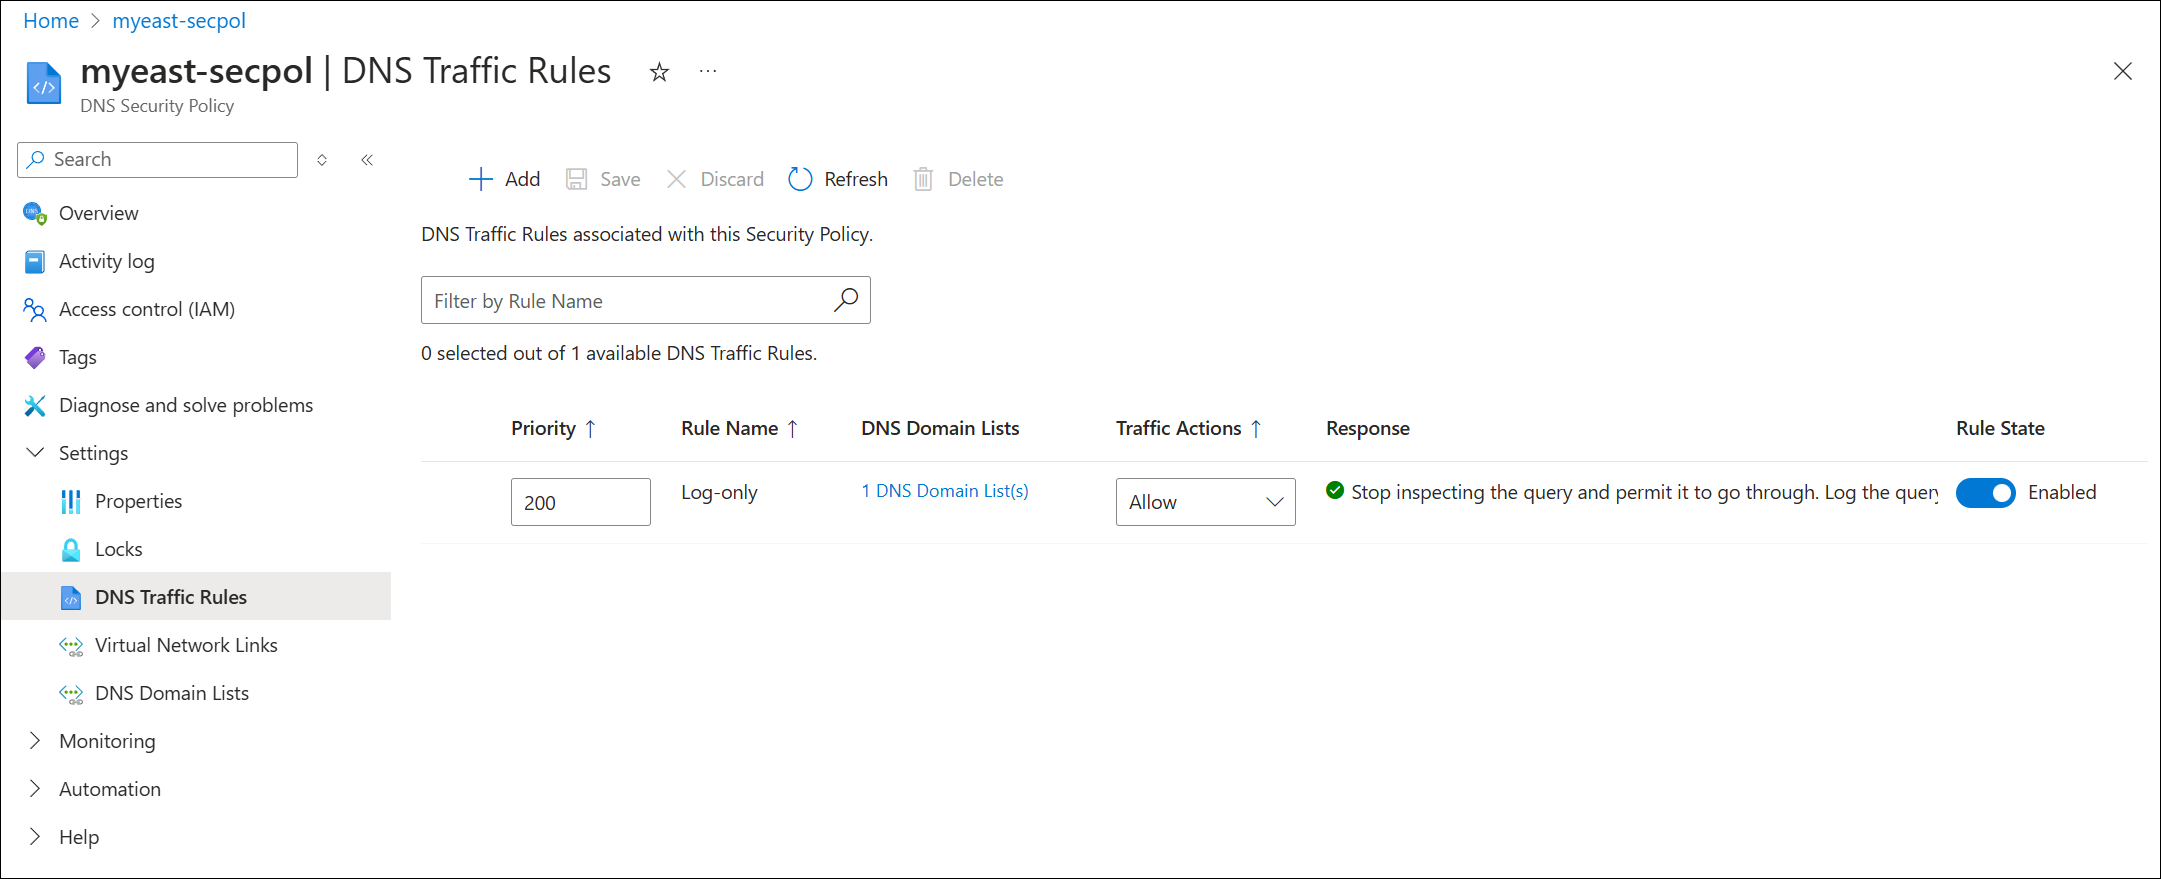
Refresh the view to verify that the rule was added successfully. You can edit traffic actions, DNS domain lists, rule priority, and rule state.
View and test DNS logs
- Navigate to your DNS security policy and then under Monitoring, select Diagnostic settings.
- Select the Log Analytics workspace that you previously associated with security policy (secpol-loganalytics in this example).
- Select Logs on the left.
- To view DNS queries from a virtual machine with IP address 10.40.40.4 in the same region, run a query as follows:
DNSQueryLogs
| where SourceIpAddress contains "10.40.40.4"
| limit 1000
See the following example:
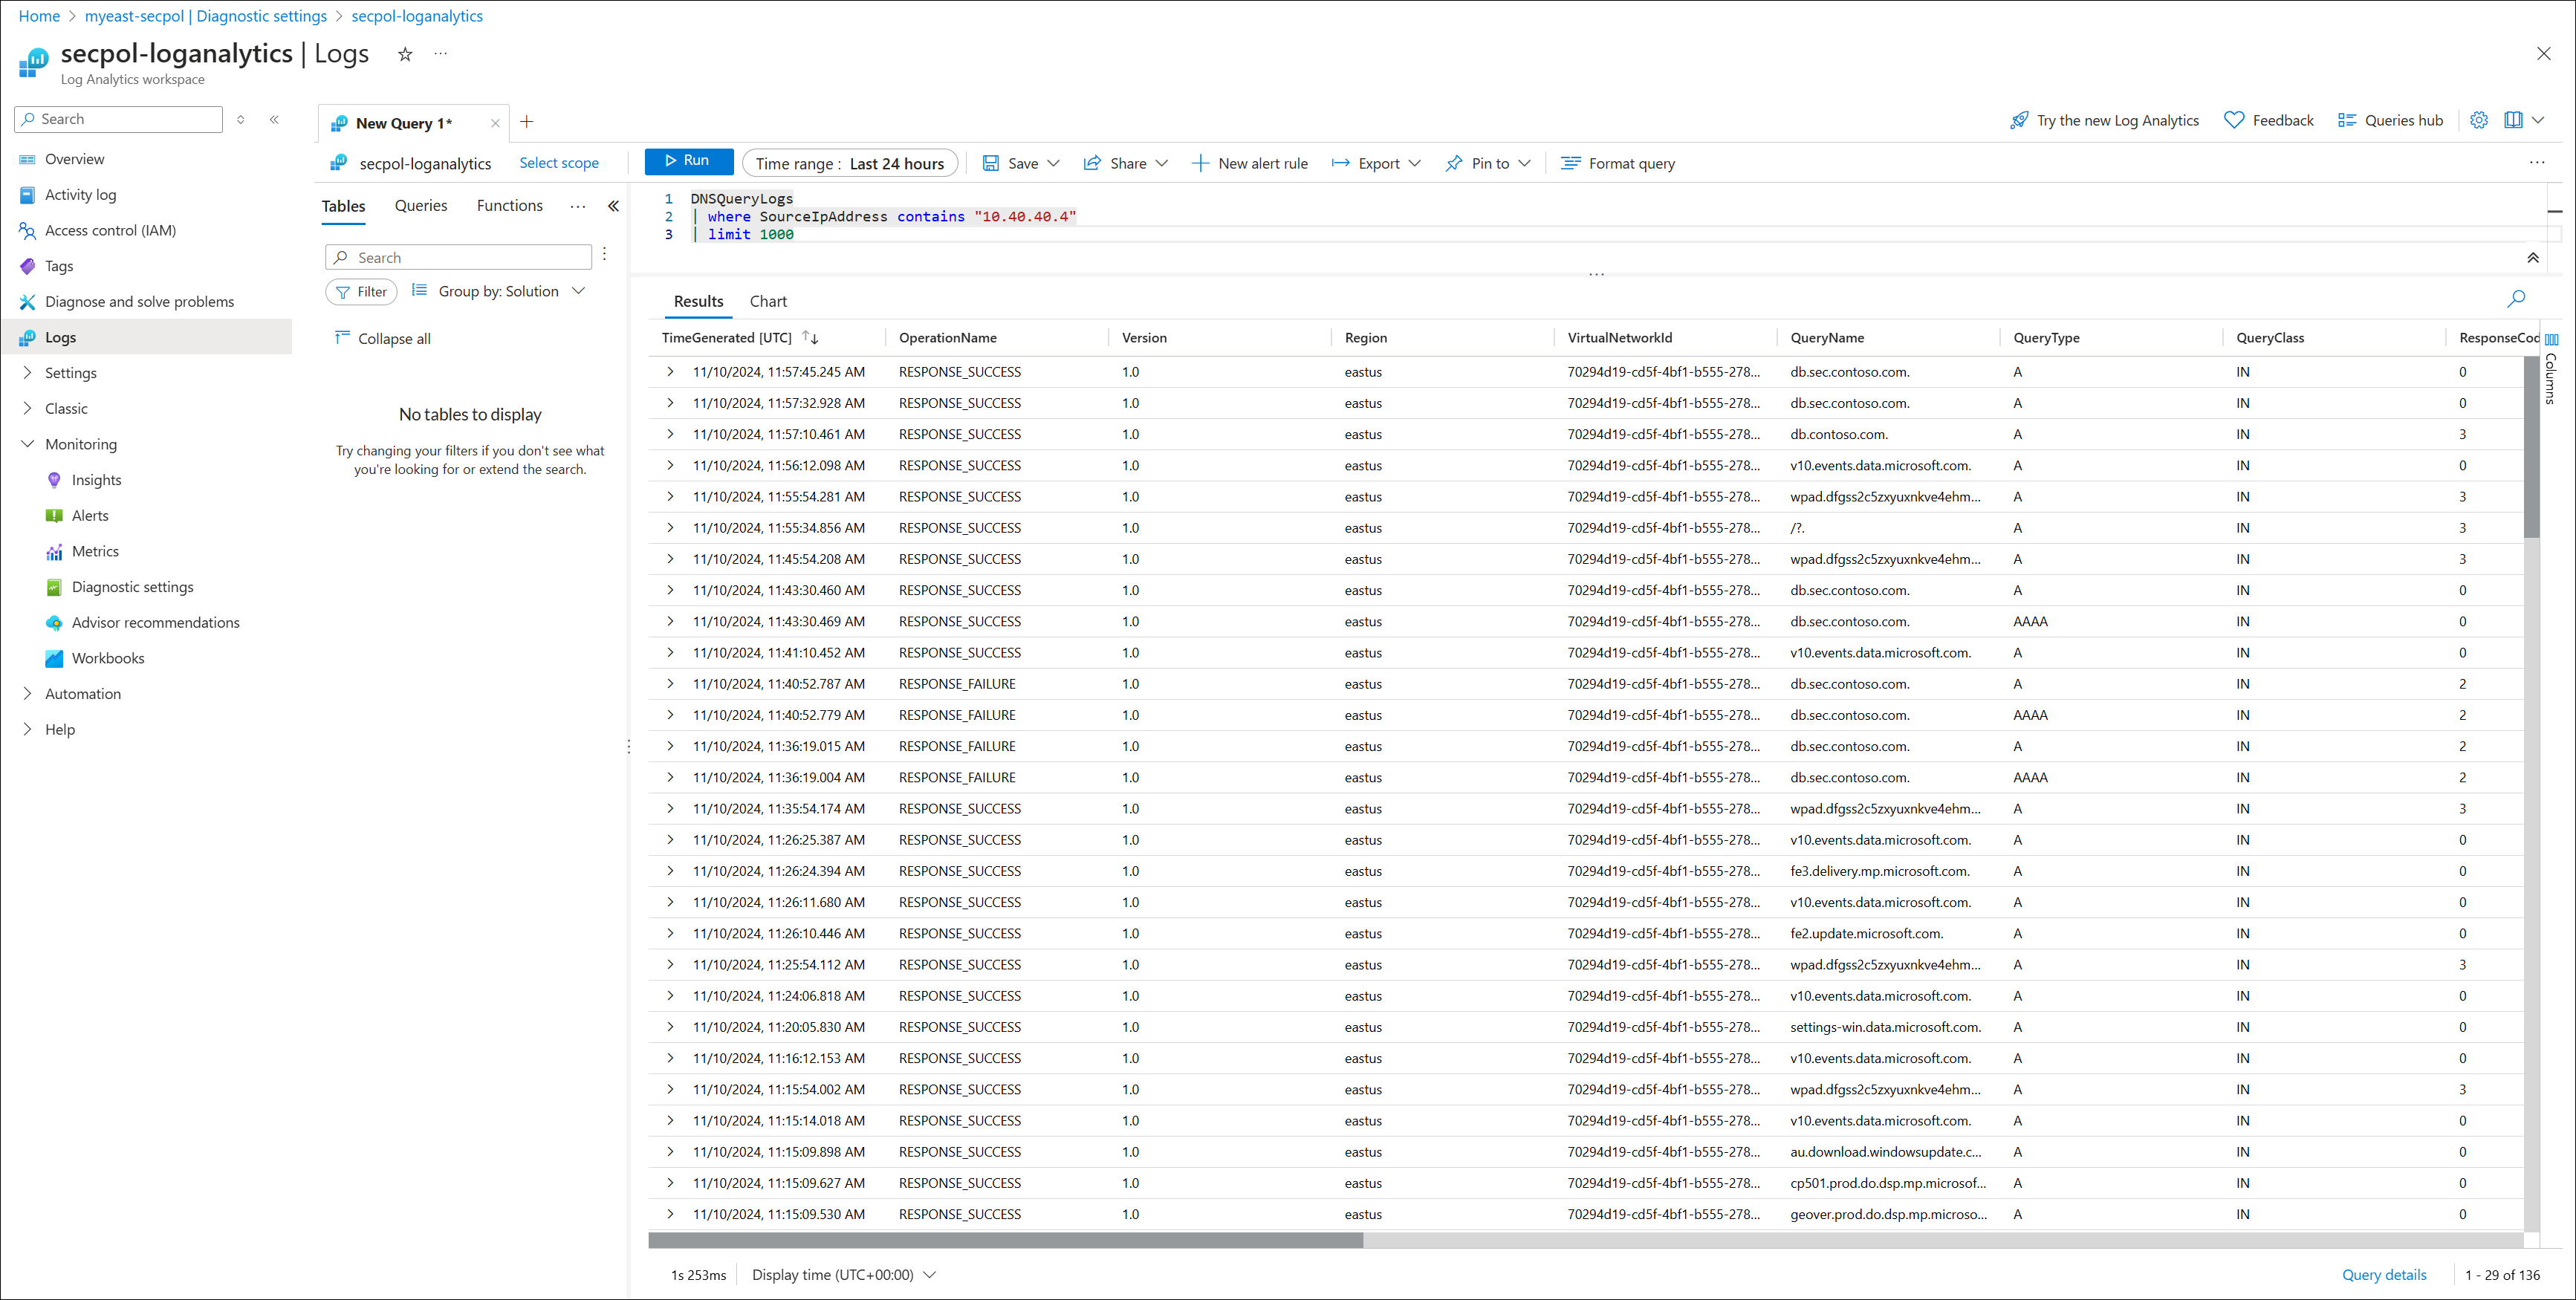
Recall that the traffic rule containing contoso.com was set to Allow queries. The query from the virtual machine results in a successful response:
C:\>dig db.sec.contoso.com +short
10.0.1.2
Expanding the query details in log analytics displays data such as:
- OperationName: RESPONSE_SUCCESS
- Region: eastus
- QueryName: db.sec.contoso.com
- QueryType: A
- SourceIpAddress: 10.40.40.4
- ResolutionPath: PrivateDnsResolution
- ResolverPolicyRuleAction: Allow
If the traffic rule is edited and set to Block contoso.com queries, the query from the virtual machine results in a failed response. Be sure to select Save when you change the components of a rule.
This change results in a failed query:
C:\>dig db.sec.contoso.com

; <<>> DiG 9.9.2-P1 <<>> db.sec.contoso.com
;; global options: +cmd
;; Got answer:
;; ->>HEADER<<- opcode: QUERY, status: SERVFAIL, id: 24053
;; flags: qr rd ra; QUERY: 1, ANSWER: 0, AUTHORITY: 0, ADDITIONAL: 1
The failed query is recorded in log analytics:

Note
It can take a few minutes for query results to show up in log analytics.
Set up a local PowerShell repository and install the Az.DnsResolver PowerShell module. This is only needed if you aren't using Cloud Shell.
Create a new folder on your disk to act as a local PowerShell repository. In this example, C:\bin\PSRepo is used.
Download Az.DnsResolver.0.2.6.nupkg into this directory.
Set up your local repository by running the following command:
# Register the repository
Register-PSRepository -Name LocalPSRepo -SourceLocation 'C:\bin\PSRepo' -ScriptSourceLocation 'C:\bin\PSRepo' -InstallationPolicy Trusted

# Install the Az.DnsResolver module
Install-Module -Name Az.DnsResolver -RequiredVersion 0.2.6 -SkipPublisherCheck

# If you already installed Az.DnsResolver, update your version to 0.2.6
Update-Module -Name Az.DnsResolver

# Confirm that the Az.DnsResolver module was installed properly
Get-InstalledModule -Name Az.DnsResolver
Set the subscription context
# Connect PowerShell to Azure cloud
Connect-AzAccount -Environment AzureCloud

# Set your default subscription
Select-AzSubscription -SubscriptionObject (Get-AzSubscription -SubscriptionId <your-sub-id>)
Create a DNS security policy with PowerShell.
$ErrorActionPreference = "Stop"

################################################################
# Configure resource names and locations
################################################################

$resourceNumber = 1 # Customize this if needed
$region = "centralus" # Change this region to your preference
if ($env:username) {$name = "$($env:username)"} else {$name = "$($env:USER)"}  # The environment variable is different in Cloud Shell vs local PowerShell
$nameSuffix = "test-$($region)-$($name)-resolverpolicytest$($resourceNumber)-test"
$resourceGroupName = "rg-$($nameSuffix)"
$virtualNetworkName = "vnet-$($nameSuffix)"
$resolverPolicyName = "dnsresolverpolicy-$($nameSuffix)"
$domainListName = "domainlist-$($nameSuffix)"
$securityRuleName = "securityrule-$($nameSuffix)"
$resolverPolicyLinkName = "dnsresolverpolicylink"
$storageAccountName = "stor$($name.ToLower())"  # Customize this, taking care that the name is not too long
$storageAccountName = $storageAccountName.Substring(0, [Math]::Min(24, $storageAccountName.Length)) # Storage account names must be 3-24 characters long
$diagnosticSettingName = "diagnosticsetting-$($nameSuffix)"
$vnetId = "/subscriptions/$subscriptionId/resourceGroups/$resourceGroupName/providers/Microsoft.Network/virtualNetworks/$virtualNetworkName"

################################################################
# Create resource group, virtual network, and storage account
################################################################

Write-Host "Creating resource group"
$rg = New-AzResourceGroup -Name $resourceGroupName -Location $region
Write-Host ($rg | ConvertTo-Json -Depth 64)

Write-Host "Creating virtual network"
$defaultSubnet = New-AzVirtualNetworkSubnetConfig -Name "default" -AddressPrefix "10.$resourceNumber.0.0/24"
$vnet = New-AzVirtualNetwork -Name $virtualNetworkName -ResourceGroupName $resourceGroupName -Location $region -AddressPrefix "10.$resourceNumber.0.0/16" -Subnet $defaultSubnet
Write-Host ($vnet | ConvertTo-Json -Depth 64)

Write-Host "Creating storage account"
$storageAccount = New-AzStorageAccount -ResourceGroupName $resourceGroupName -Name $storageAccountName -Location $region -SkuName Standard_GRS
Write-Host $storageAccount.ToString()

################################
# Create DNS security policy
################################

Write-Host "Creating DNS resolver policy"
$resolverPolicy = New-AzDnsResolverPolicy -Location $region -ResourceGroupName $resourceGroupName -Name $resolverPolicyName
Write-Host $resolverPolicy.ToJsonString()

Write-Host "Creating DNS resolver policy virtual network link"
$link = New-AzDnsResolverPolicyVirtualNetworkLink -Location $region -ResourceGroupName $resourceGroupName -DnsResolverPolicyName $resolverPolicyName -Name $resolverPolicyLinkName -VirtualNetworkId $vnetId
Write-Host $link.ToJsonString()

$log = New-AzDiagnosticSettingLogSettingsObject -Enabled $true -Category DnsResponse

Write-Host "Creating diagnostic setting"
$diagnosticSetting = New-AzDiagnosticSetting -Name $diagnosticSettingName -ResourceId  $resolverPolicy.id -Log $log -StorageAccountId $storageAccount.id
Write-Host $diagnosticSetting.ToJsonString()

Write-Host "Creating domain list"
$domainList = New-AzDnsResolverDomainList -Location $region -ResourceGroupName $resourceGroupName -Name $domainListName -Domain @("contoso.com.", "adatum.com.")
Write-Host $domainList.ToJsonString()

Write-Host "Creating DNS security policy rule"
$rule = New-AzDnsResolverPolicyDnsSecurityRule -ResourceGroupName $resourceGroupName -Name $securityRuleName -DnsResolverDomainList @{id = $domainList.Id;} -DnsSecurityRuleState "Enabled" -ActionType "Block" -ActionBlockResponseCode "SERVFAIL" -Priority 100 -DnsResolverPolicyName $resolverPolicyName -Location $region
Write-Host $rule.ToJsonString()
Optional: Update DNS resolver policies with new values.
################################
# Update DNS security policy
################################

Write-Host "Updating DNS resolver policy"
$resolverPolicy = Update-AzDnsResolverPolicy -ResourceGroupName $resourceGroupName -Name $resolverPolicyName -Tag @{"key0" = "value0"}
Write-Host $resolverPolicy.ToJsonString()

Write-Host "Updating DNS resolver policy virtual network link"
$link = Update-AzDnsResolverPolicyVirtualNetworkLink -ResourceGroupName $resourceGroupName -DnsResolverPolicyName $resolverPolicyName -Name $resolverPolicyLinkName -Tag @{"key1" = "value1"}
Write-Host $link.ToJsonString()

$log = New-AzDiagnosticSettingLogSettingsObject -Enabled $false -Category DnsResponse

Write-Host "Updating diagnostic setting by disabling log category"
$diagnosticSetting = New-AzDiagnosticSetting -Name $diagnosticSettingName -ResourceId  $resolverPolicy.id -Log $log -StorageAccountId $storageAccount.id
Write-Host $diagnosticSetting.ToJsonString()

Write-Host "Updating domain list"
$domainList = Update-AzDnsResolverDomainList -ResourceGroupName $resourceGroupName -Name $domainListName -Tag @{"key2" = "value2"}
Write-Host $domainList.ToJsonString()

Write-Host "Updating DNS security policy rule"
$rule = Update-AzDnsResolverPolicyDnsSecurityRule -ResourceGroupName $resourceGroupName -Name $securityRuleName -DnsResolverDomainList @{id = $domainList.Id;} -DnsResolverPolicyName $resolverPolicyName
Write-Host $rule.ToJsonString()
Review the DNS security policy configuration.
################################
# Get DNS security policy
################################

Write-Host "Getting DNS resolver policy"
$resolverPolicy = Get-AzDnsResolverPolicy -ResourceGroupName $resourceGroupName -Name $resolverPolicyName
Write-Host $resolverPolicy.ToJsonString()

Write-Host "Getting DNS resolver policy virtual network link"
$link = Get-AzDnsResolverPolicyVirtualNetworkLink -ResourceGroupName $resourceGroupName -DnsResolverPolicyName $resolverPolicyName -Name $resolverPolicyLinkName
Write-Host $link.ToJsonString()

Write-Host "Getting diagnostic setting"
$diagnosticSetting = Get-AzDiagnosticSetting -ResourceId $resolverPolicy.id
Write-Host $diagnosticSetting.ToJsonString()

Write-Host "Getting domain list"
$domainList = Get-AzDnsResolverDomainList -ResourceGroupName $resourceGroupName -Name $domainListName
Write-Host $rule.ToJsonString()

Write-Host "Getting DNS security policy rule"
$rule = Get-AzDnsResolverPolicyDnsSecurityRule -ResourceGroupName $resourceGroupName -Name $securityRuleName -DnsResolverPolicyName $resolverPolicyName
Write-Host $rule.ToJsonString()
Test DNS security policy
To test your new security policy, connect to a host device inside the virtual network and issue a query for the domains that you blocked. In this example the domainlist is contoso.com and adatum.com.
Input:
Resolve-DnsName -Name contoso.com -Type NS
Output:
Resolve-DnsName : contoso.com : DNS server failure
At line:1 char:1
+ Resolve-DnsName -Name contoso.com -Type NS
+ ~~~~~~~~~~~~~~~~~~~~~~~~~~~~~~~~~~~~~~~~~~
    + CategoryInfo          : ResourceUnavailable: (contoso.com:String) [Resolve-DnsName], Win32Exception
    + FullyQualifiedErrorId : RCODE_SERVER_FAILURE,Microsoft.DnsClient.Commands.ResolveDnsName
