Note
Access to this page requires authorization. You can try signing in or changing directories.
Access to this page requires authorization. You can try changing directories.
This article provides step-by-step instructions for enabling diagnostic settings for Event Grid resources. These settings allow you to capture and view diagnostic information so that you can troubleshoot any failures. The following table shows the settings available for different types of Event Grid resources - custom topics, system topics, and domains.
| Diagnostic setting | Event Grid topics | Event Grid system topics | Event domains | Event Grid partner namespaces |
|---|---|---|---|---|
| DeliveryFailures | Yes | Yes | Yes | No |
| PublishFailures | Yes | No | Yes | Yes |
| DataPlaneRequests | Yes | No | Yes | Yes |
Important
For schemas of delivery failures, publish failures, and data plane requests, see Diagnostic logs.
Prerequisites
- A provisioned Event Grid resource
- A provisioned destination for capturing diagnostic logs:
- Log Analytics workspace
- Storage account
- Event Hubs
- Partner solution
Enable diagnostic logs for Event Grid topics and domains
Note
The following procedure provides step-by-step instructions for enabling diagnostic logs for topics. Steps for enabling diagnostic logs for a domain are very similar. In step 2, navigate to the Event Grid domain in the Azure portal.
Sign in to the Azure portal.
Navigate to the Event Grid topic for which you want to enable diagnostic log settings.
In the search bar at the top, search for Event Grid topics.
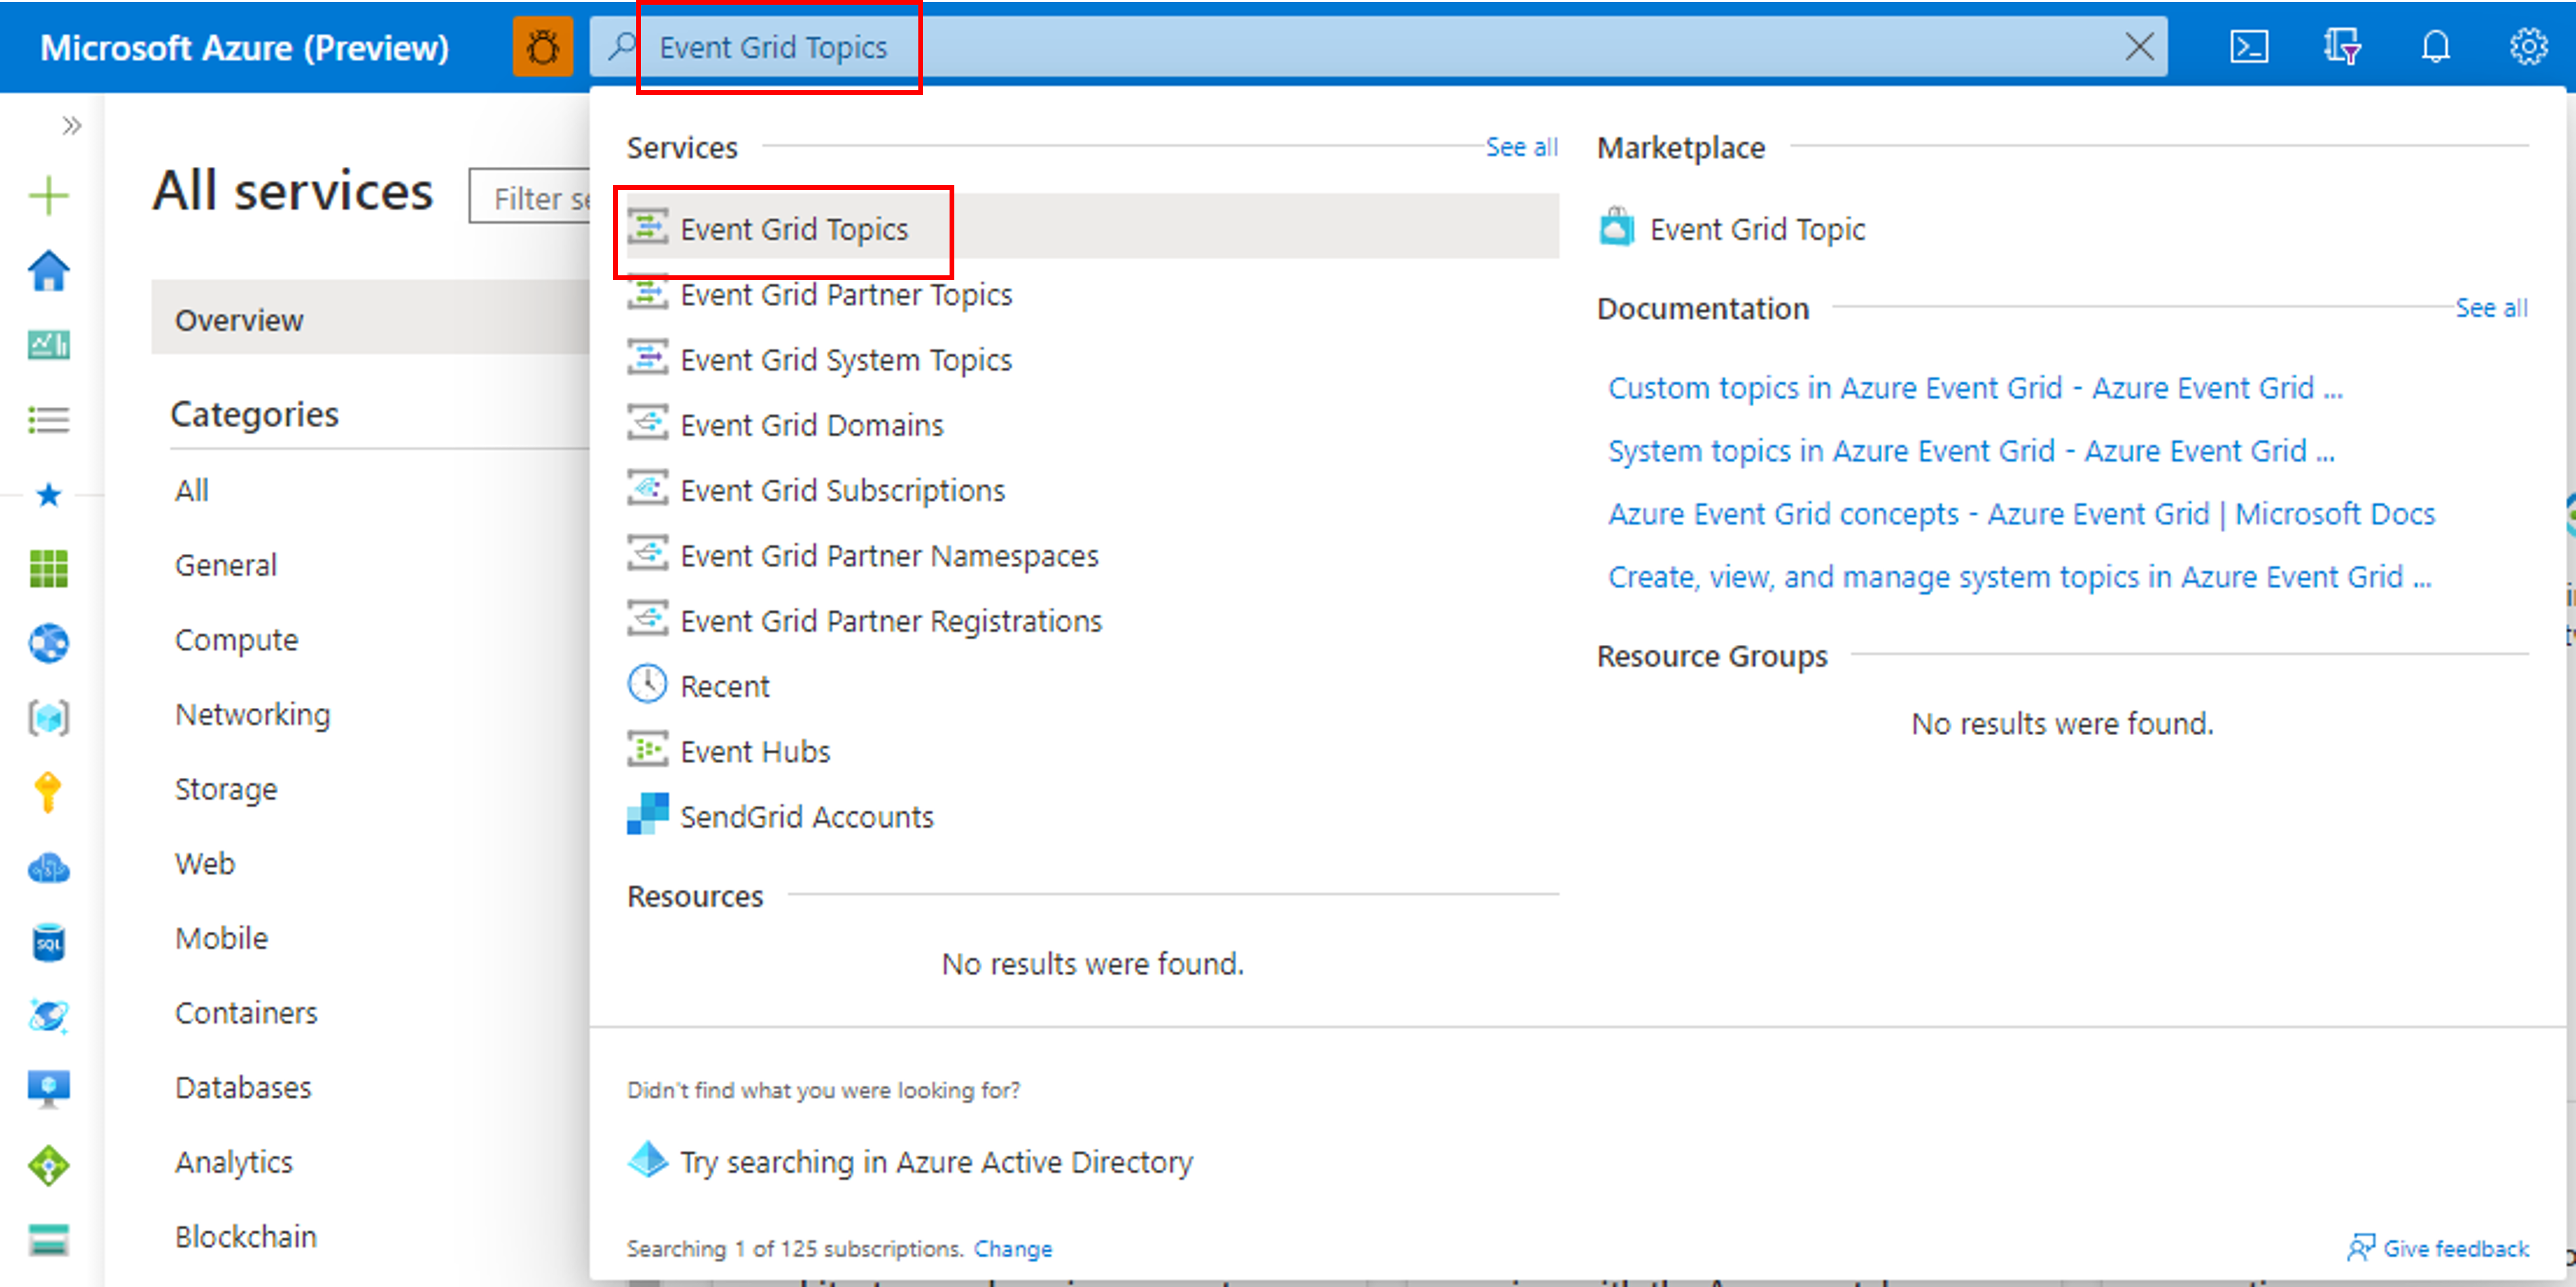
Select the topic from the list for which you want to configure diagnostic settings.
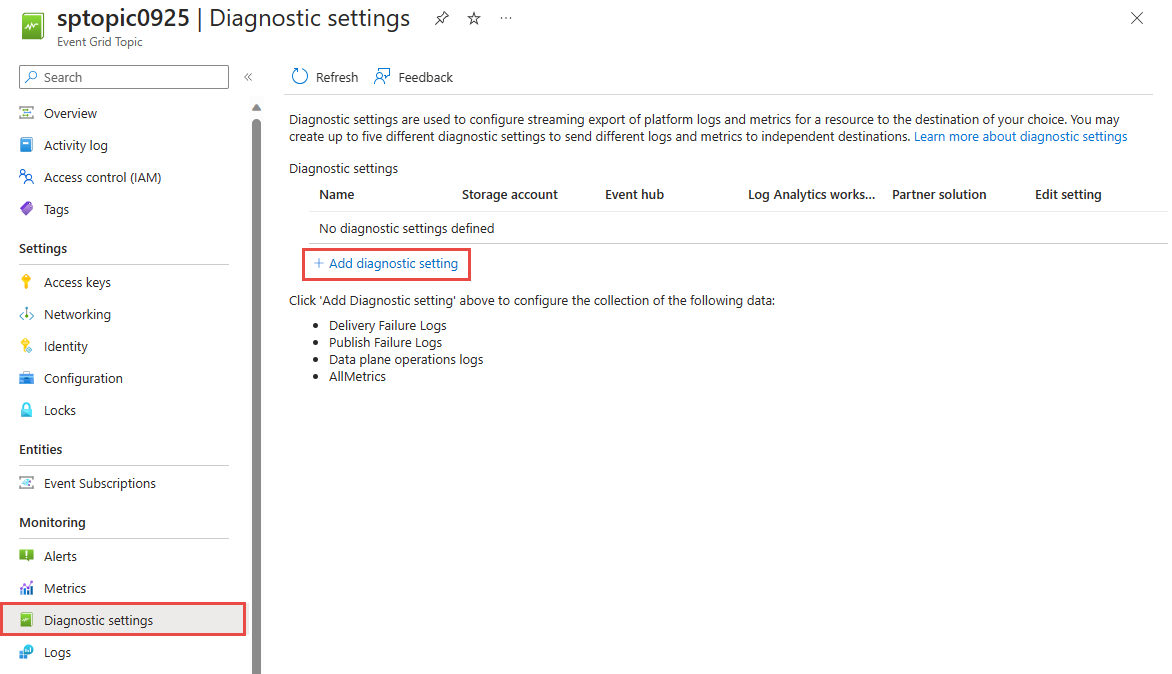
Select Diagnostic settings under Monitoring in the left menu.
On the Diagnostic settings page, select Add New Diagnostic Setting.
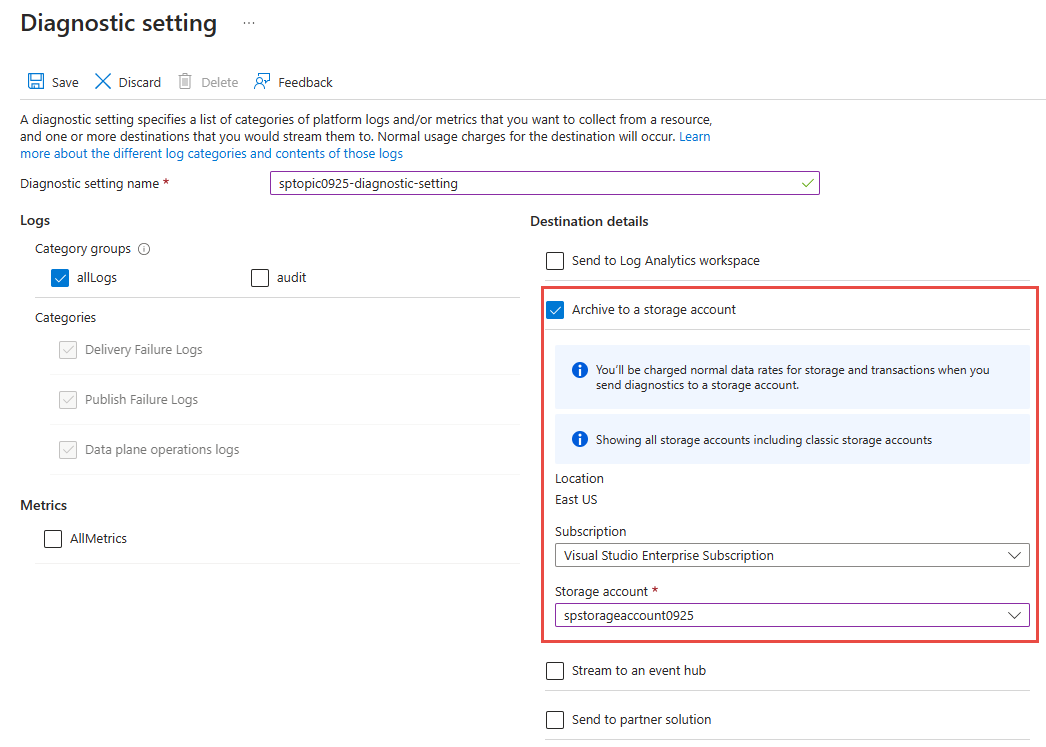
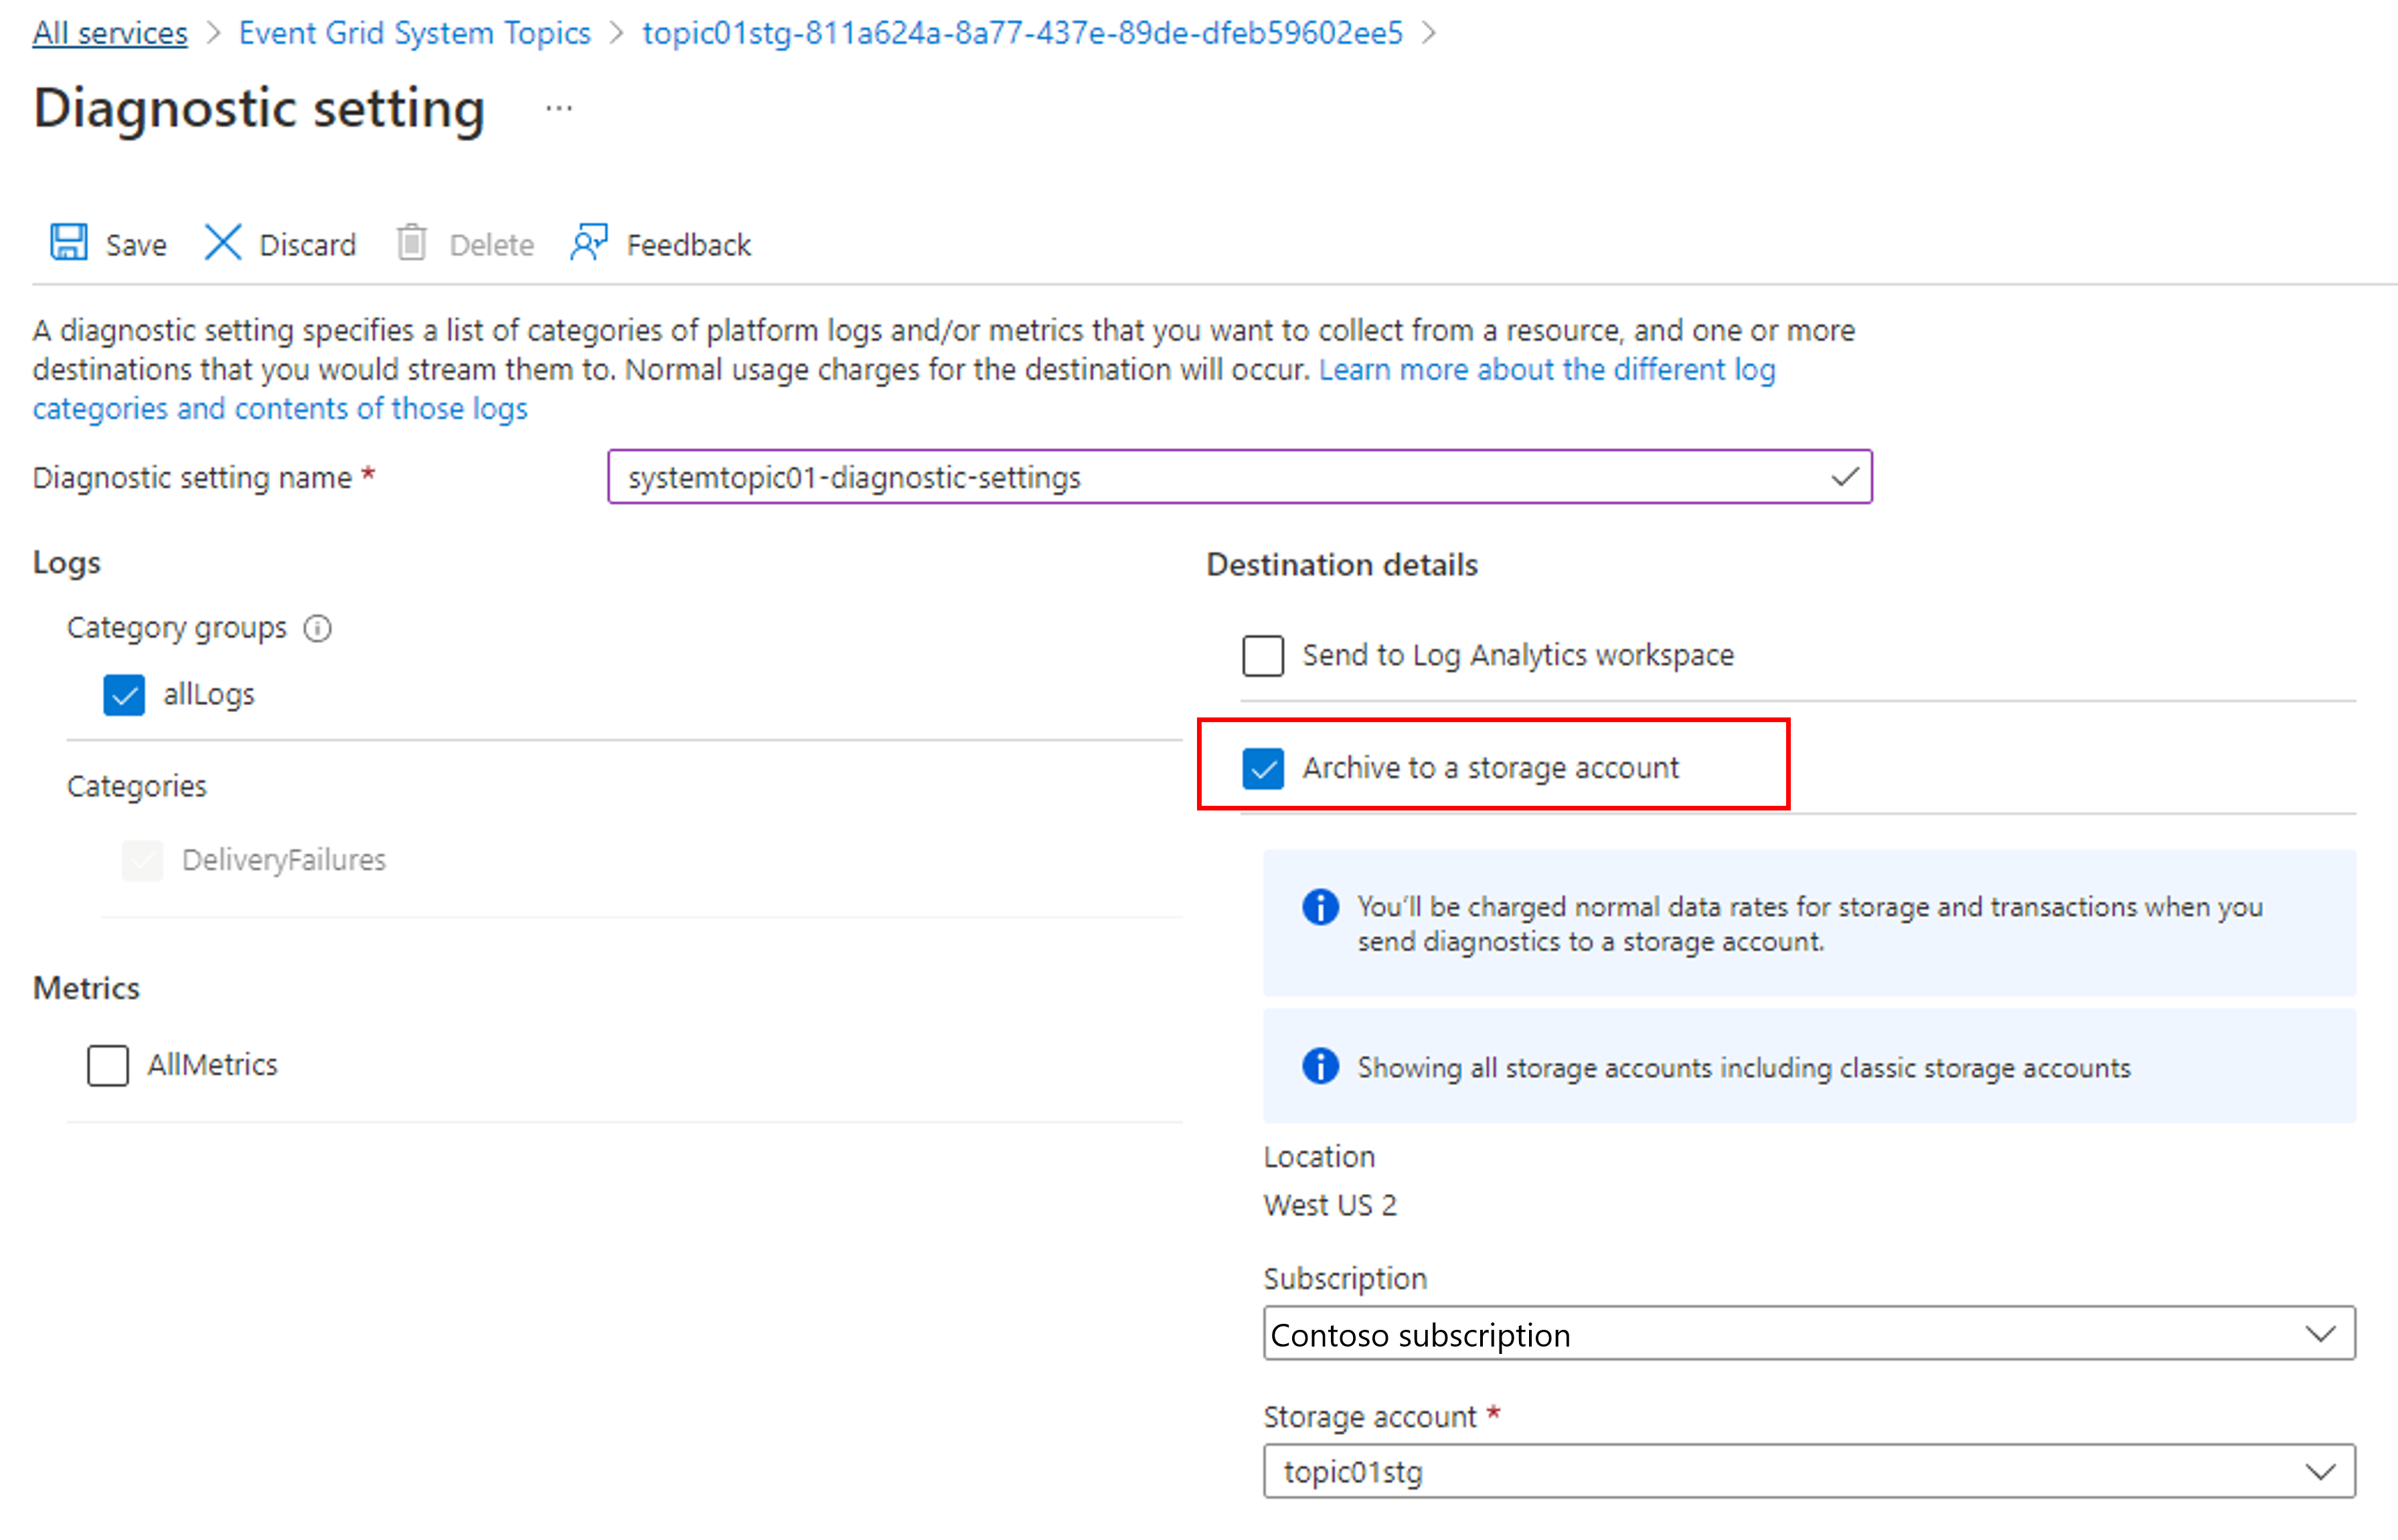
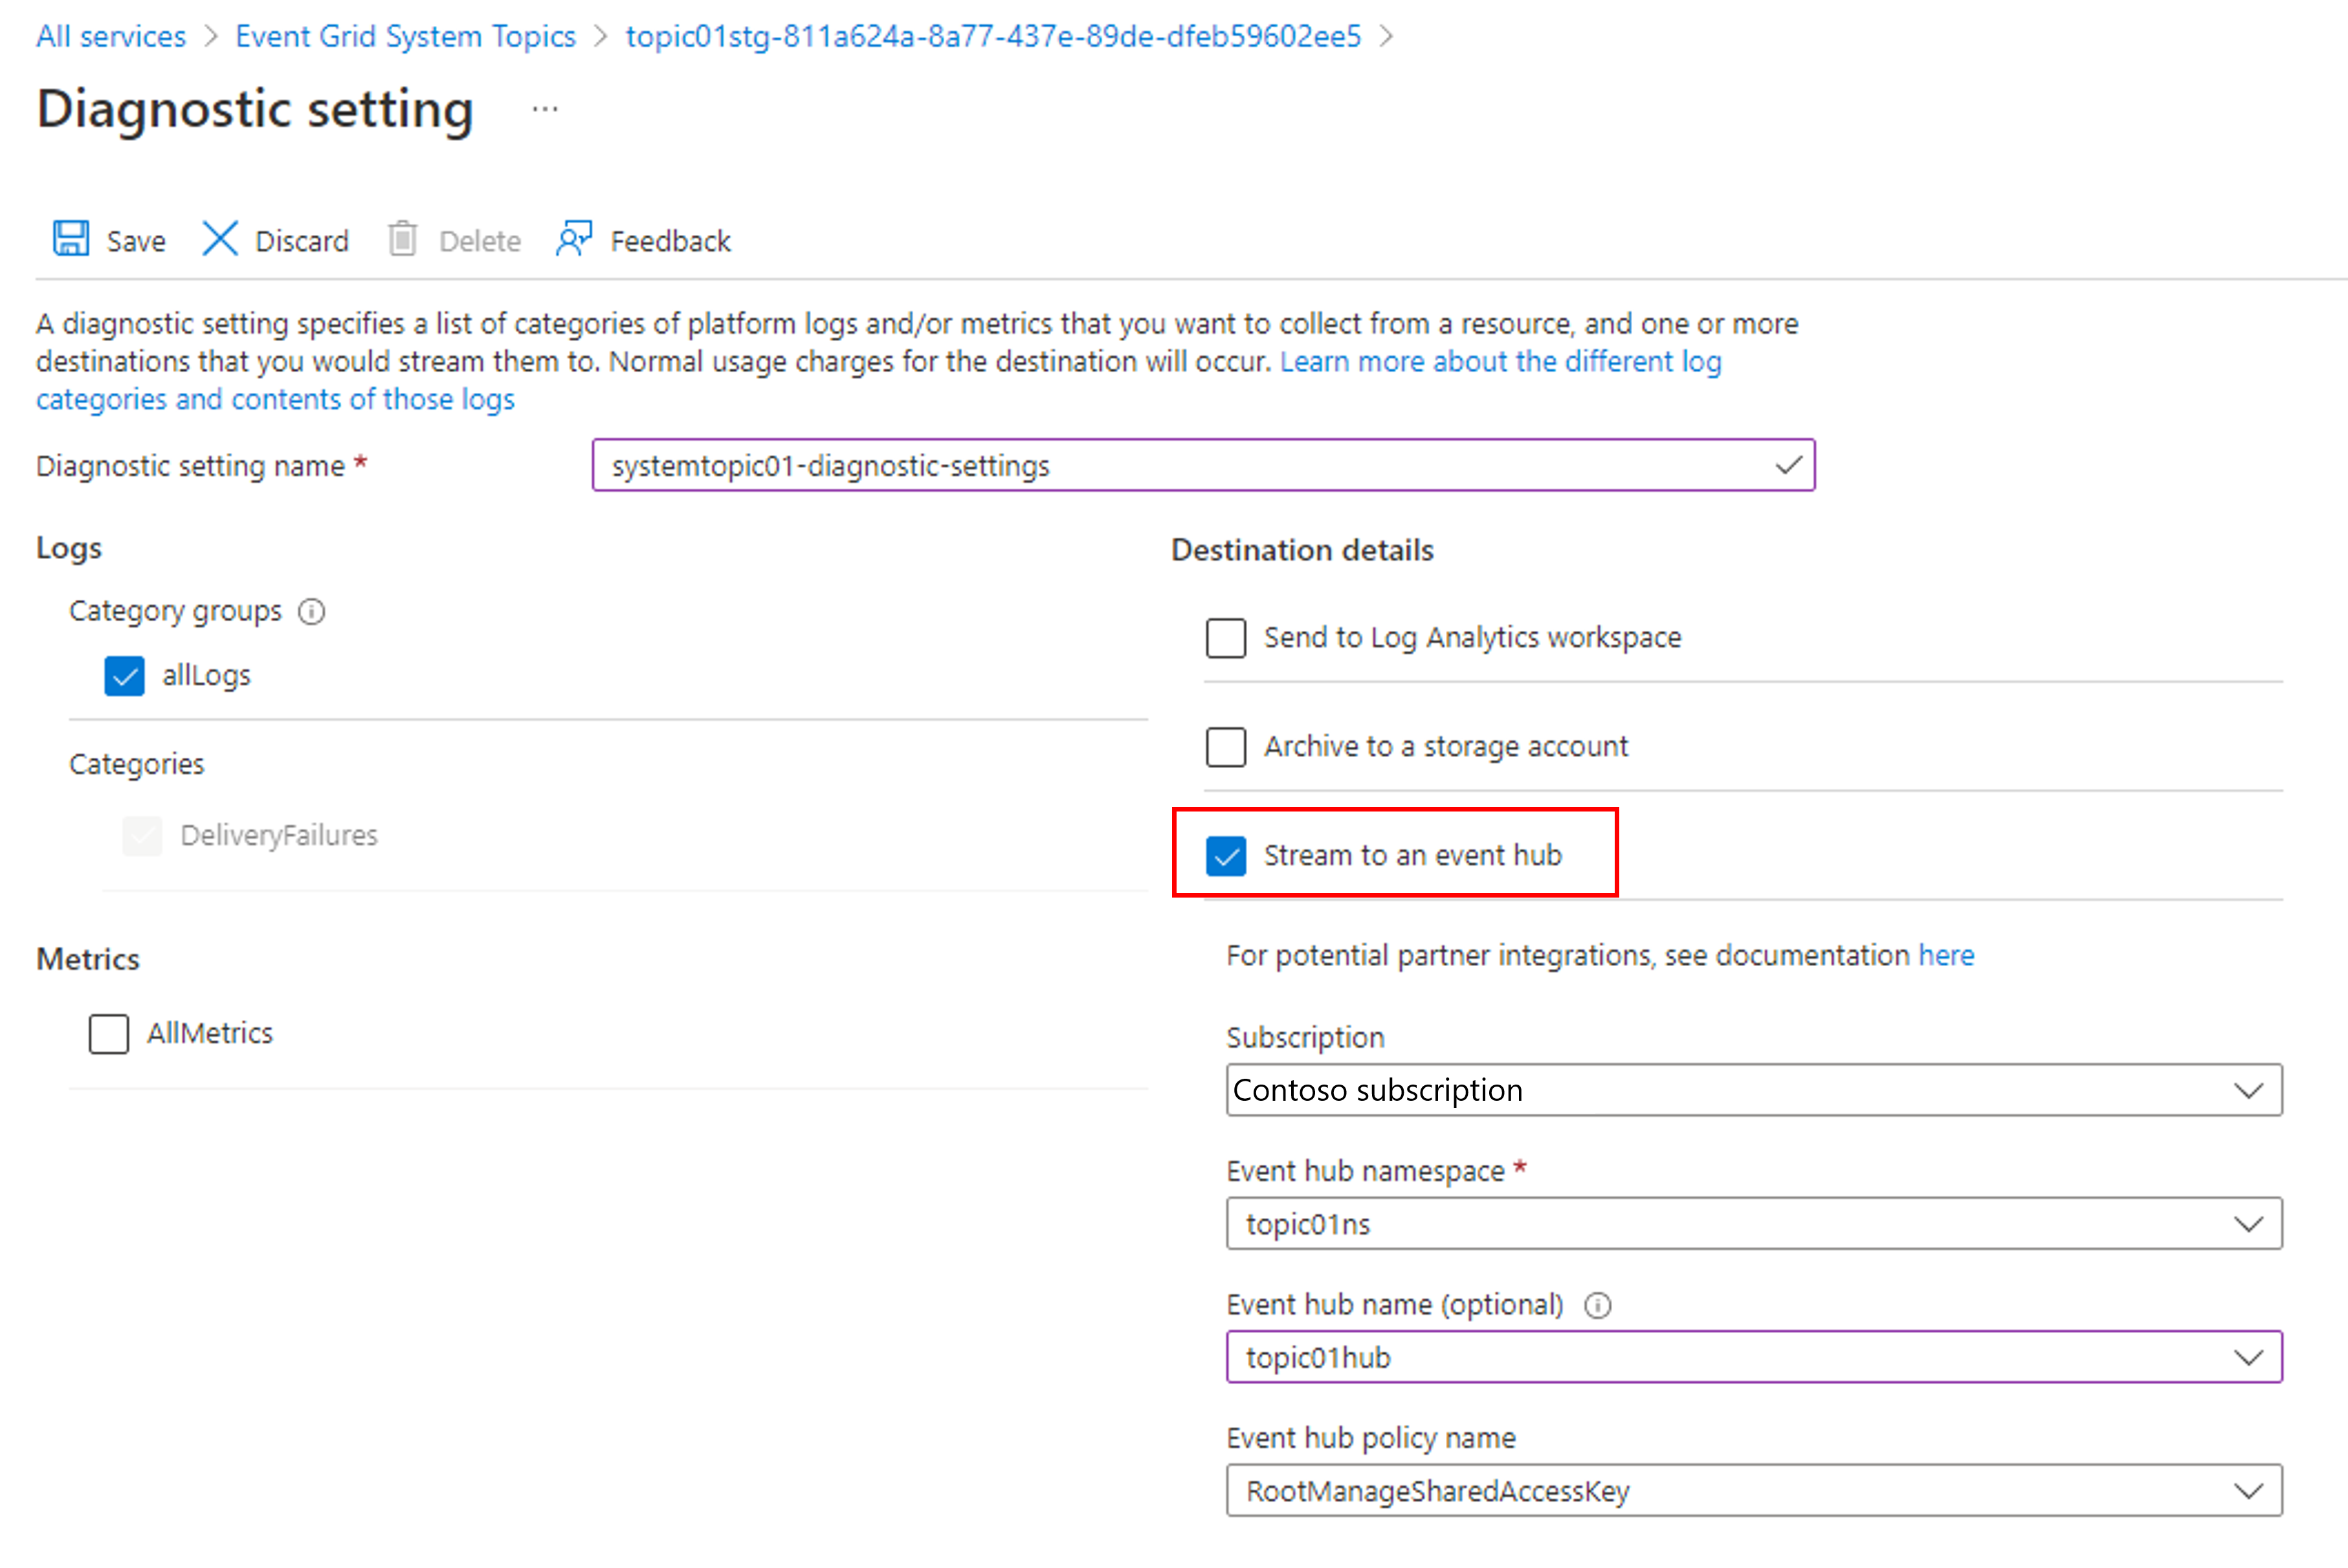
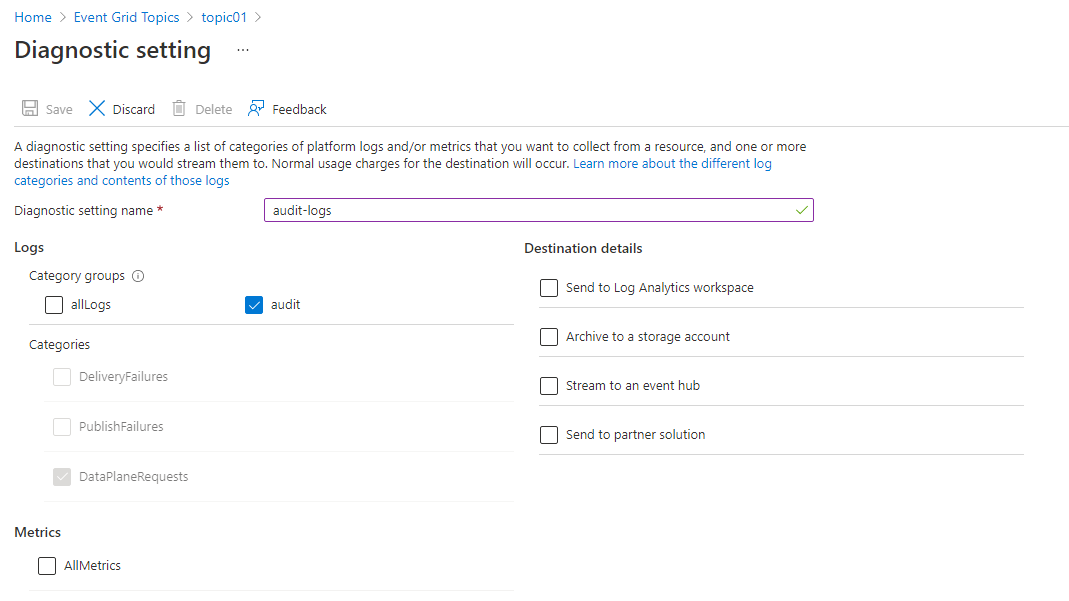
Specify a name for the diagnostic setting.
Select the allLogs option in the Logs section.
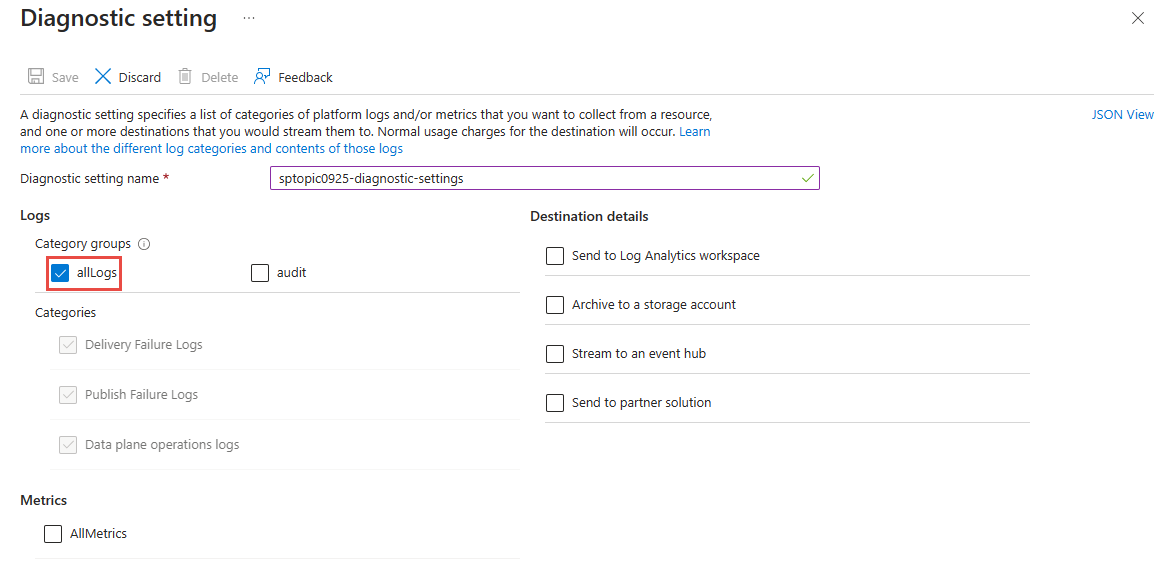
Enable one or more of the capture destinations for the logs, and then configure them by selecting a previous created capture resource.
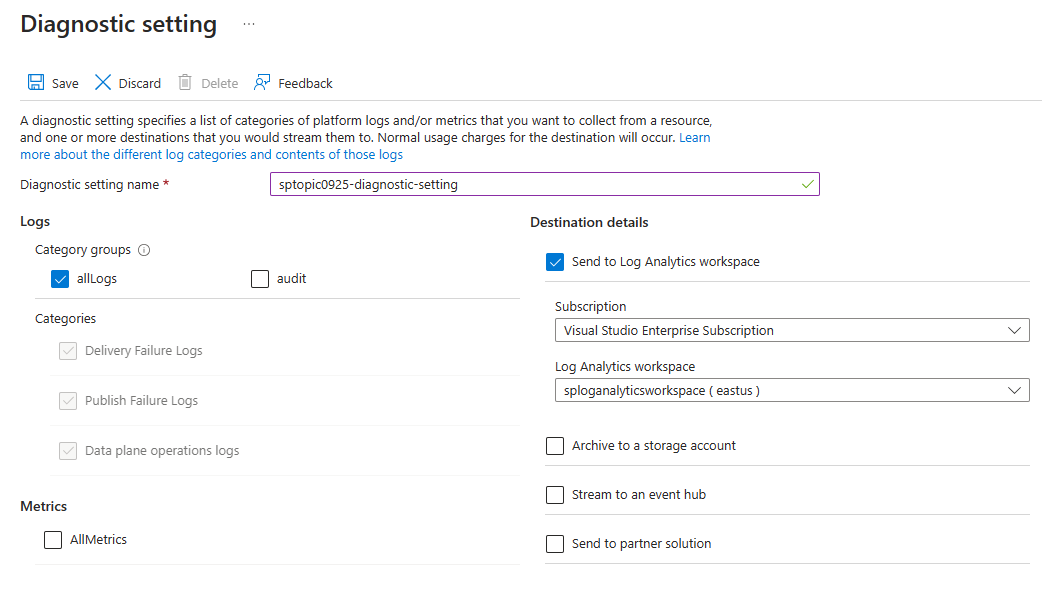
If you select Send to Log Analytics, select the Log Analytics workspace.
If you select Archive to a storage account, select Storage account - Configure, and then select the storage account in your Azure subscription.
If you select Stream to an event hub, select Event hub - Configure, and then select the Event Hubs namespace, event hub, and the access policy.
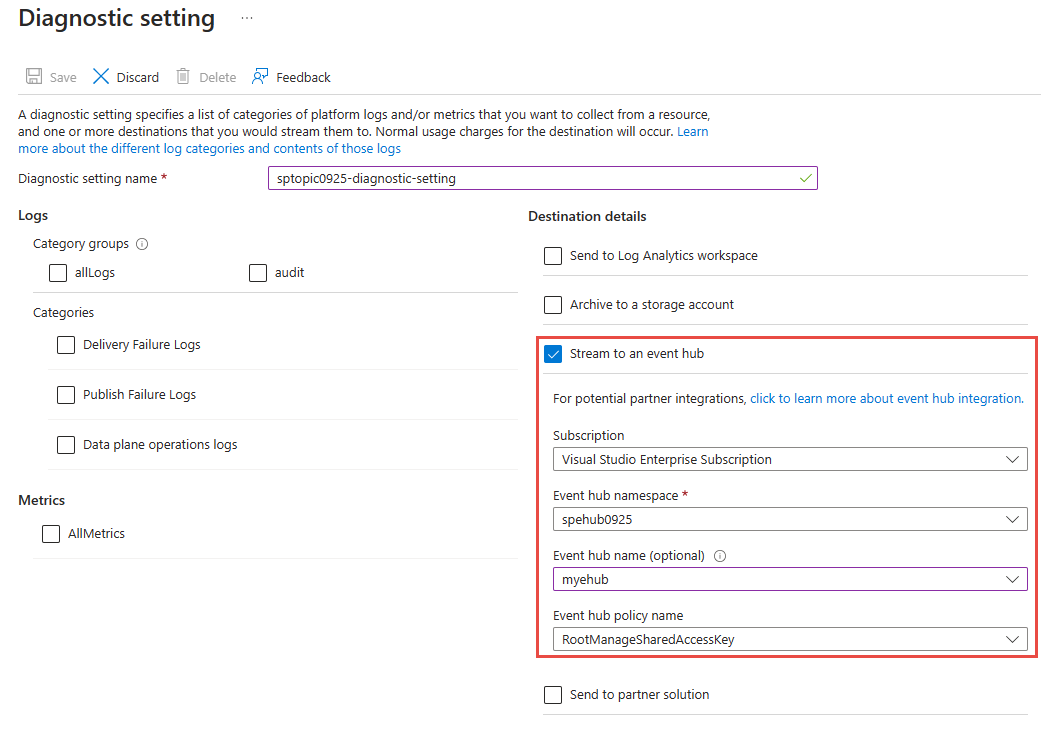
Select Save. Then, select X in the right-corner to close the page.
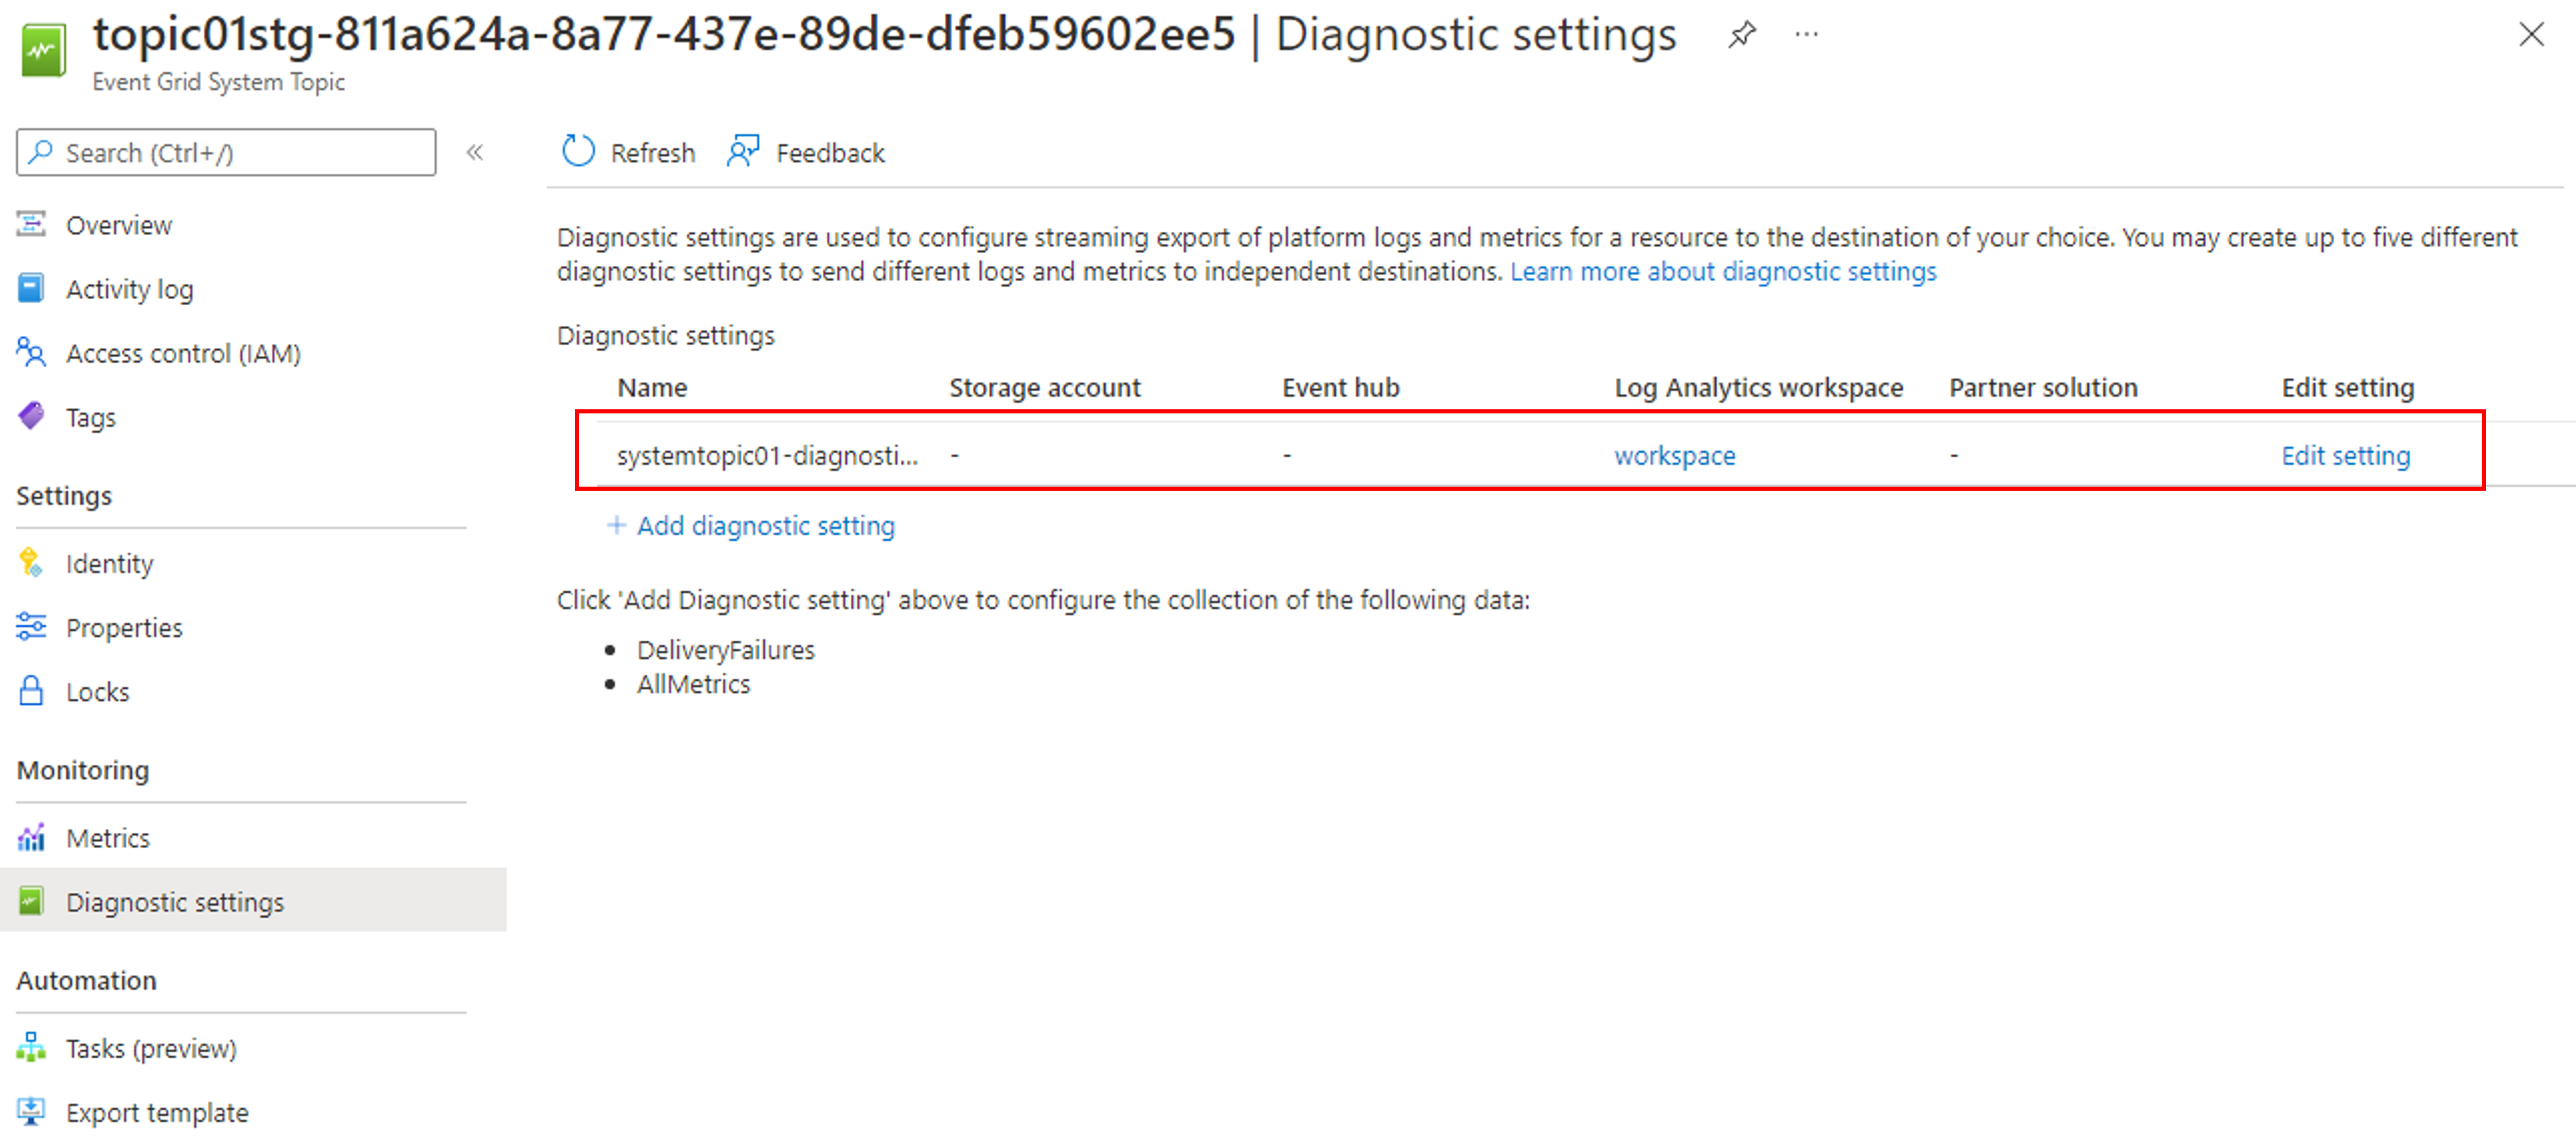
Now, back on the Diagnostic settings page, confirm that you see a new entry in the Diagnostics Settings table.
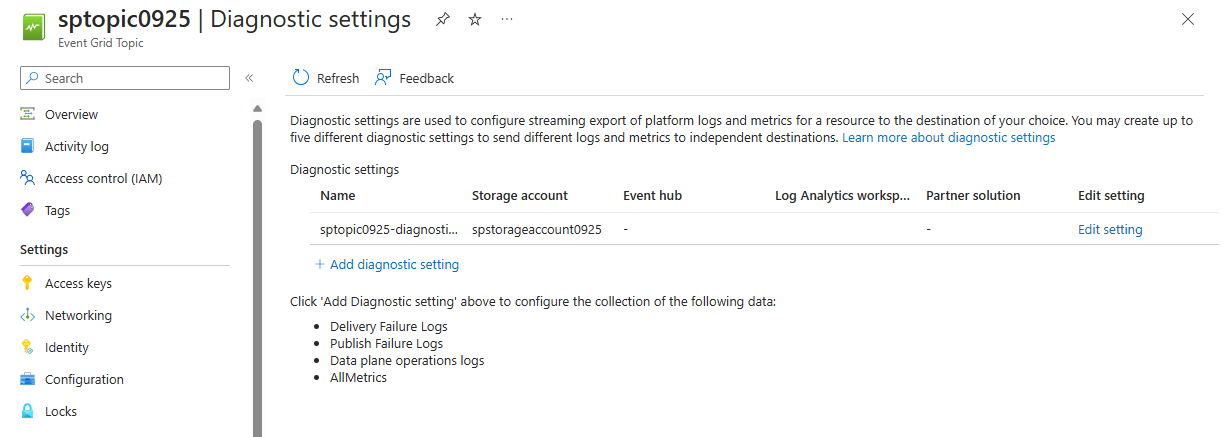
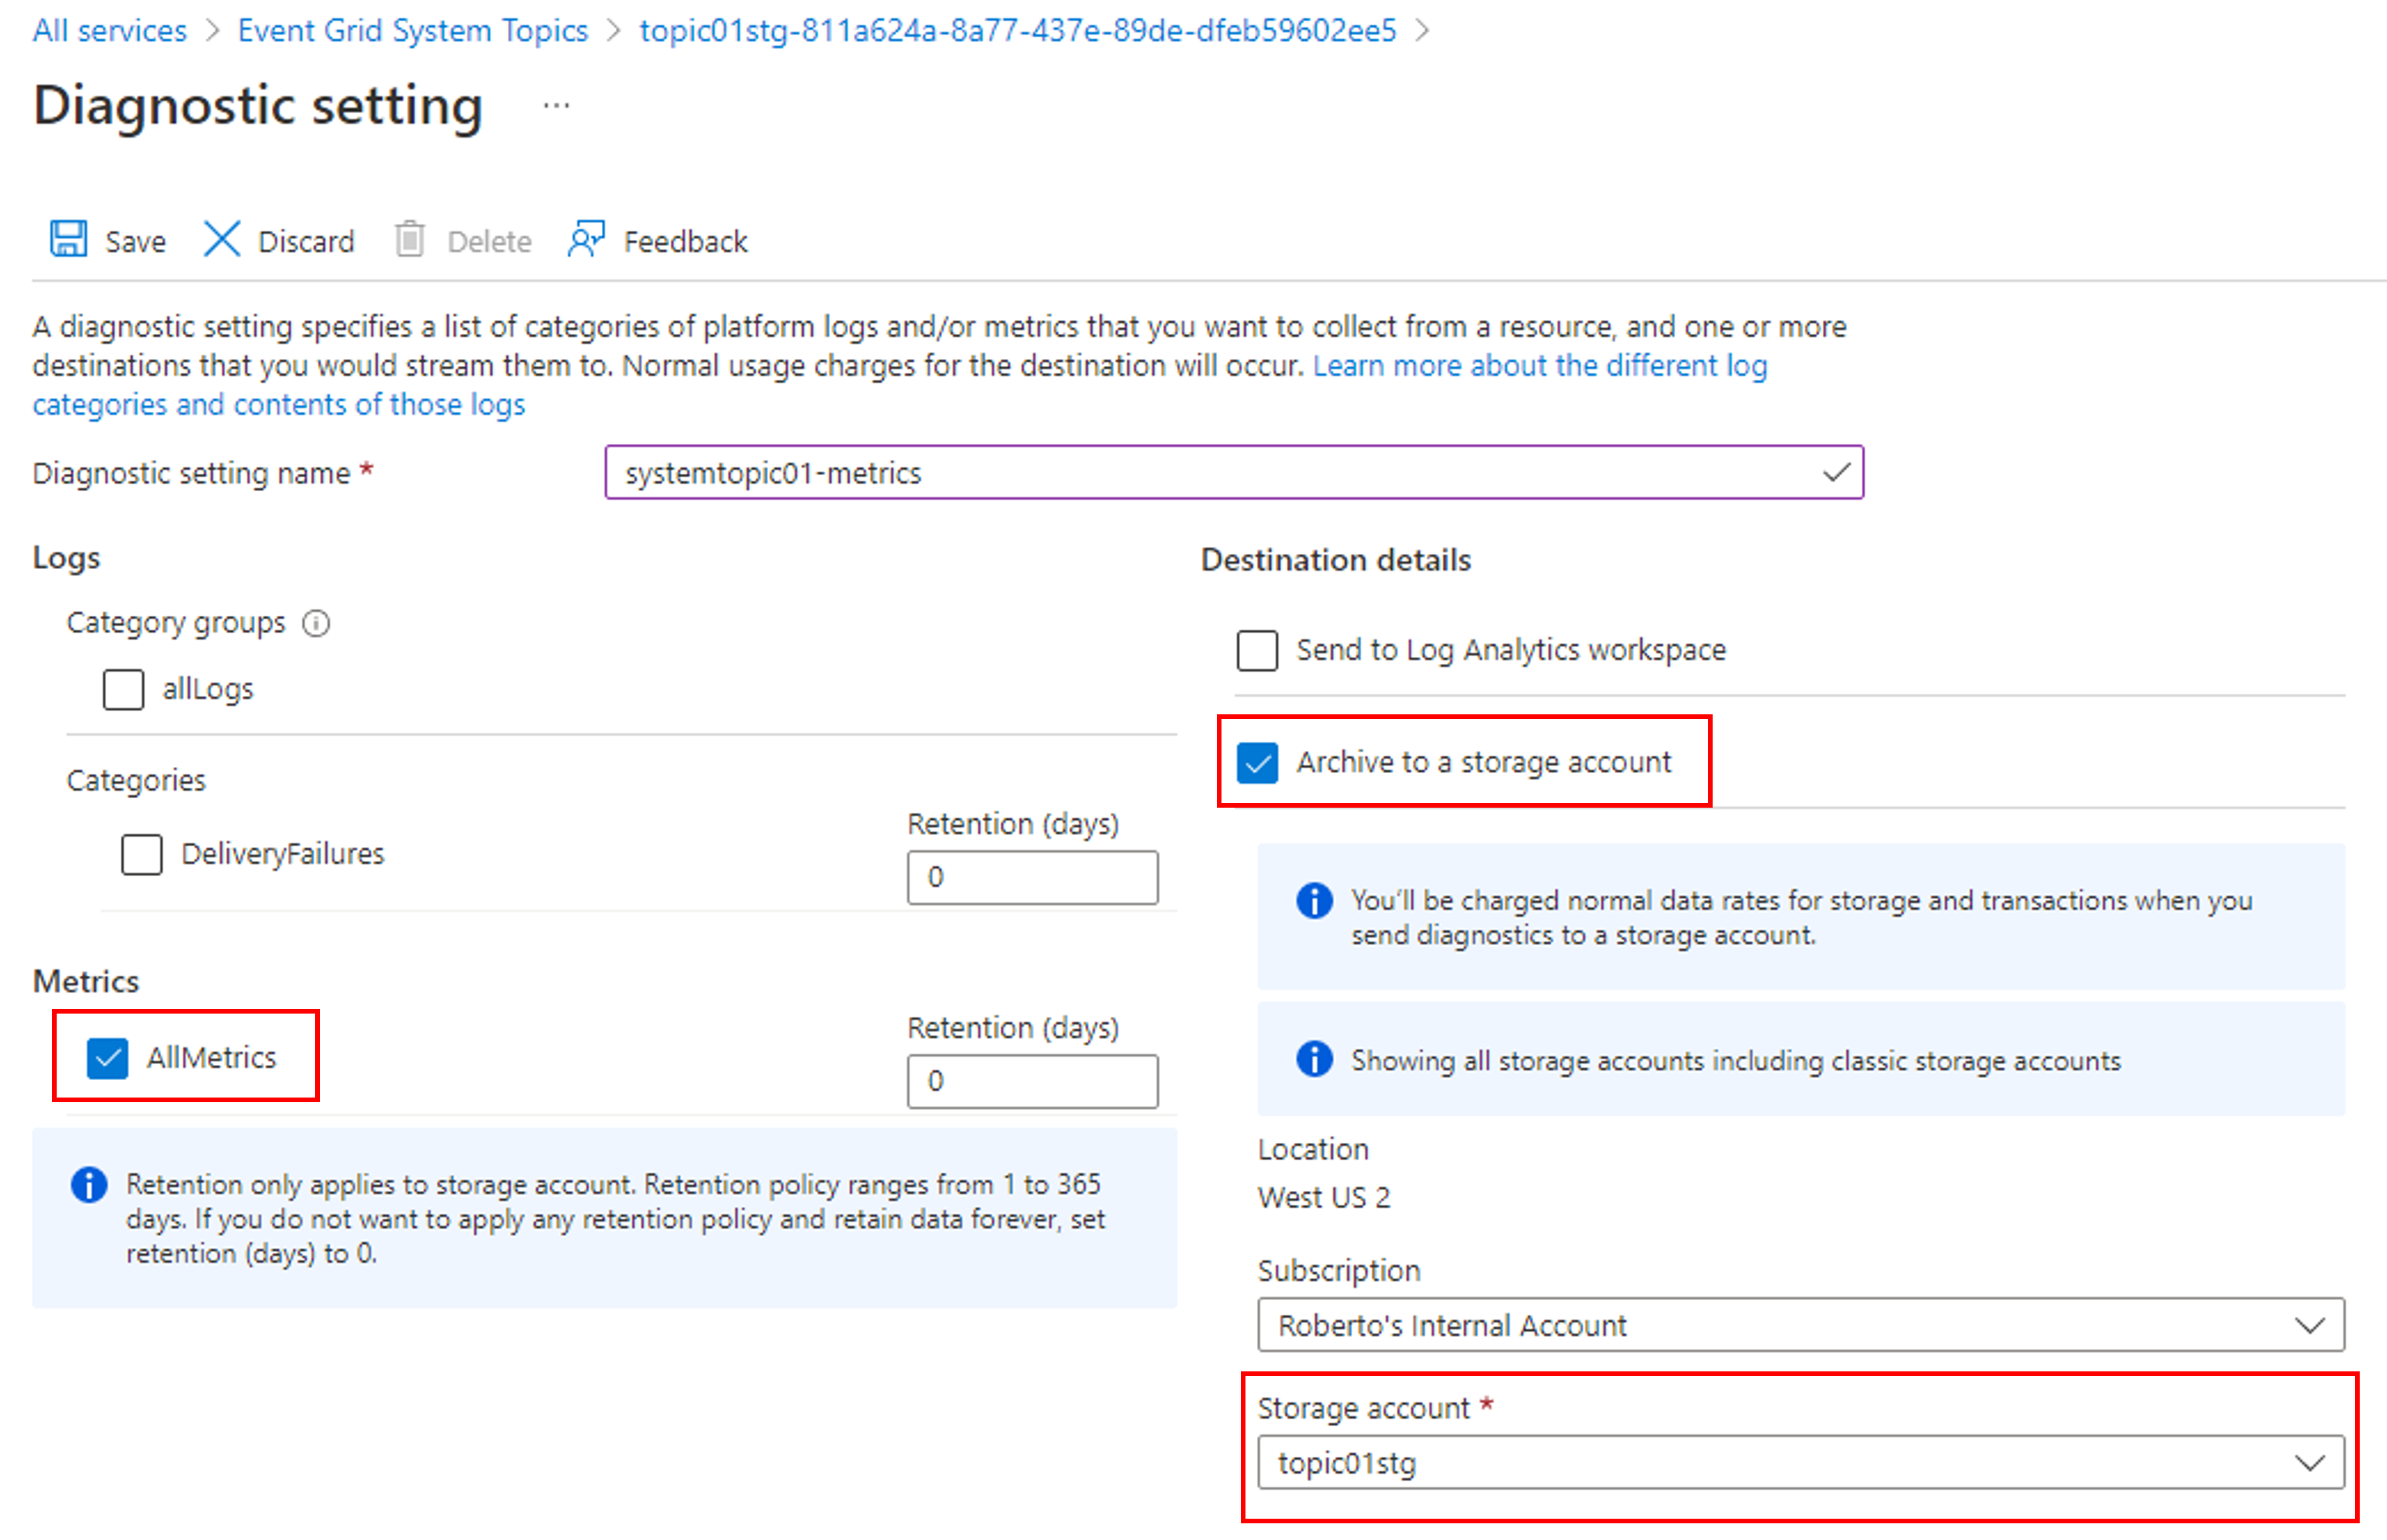
You can also enable collection of all metrics for the topic.
Enable diagnostic logs for Event Grid system topics
- Sign in to the Azure portal.
- Navigate to the system topic for which you want to enable diagnostic log settings.
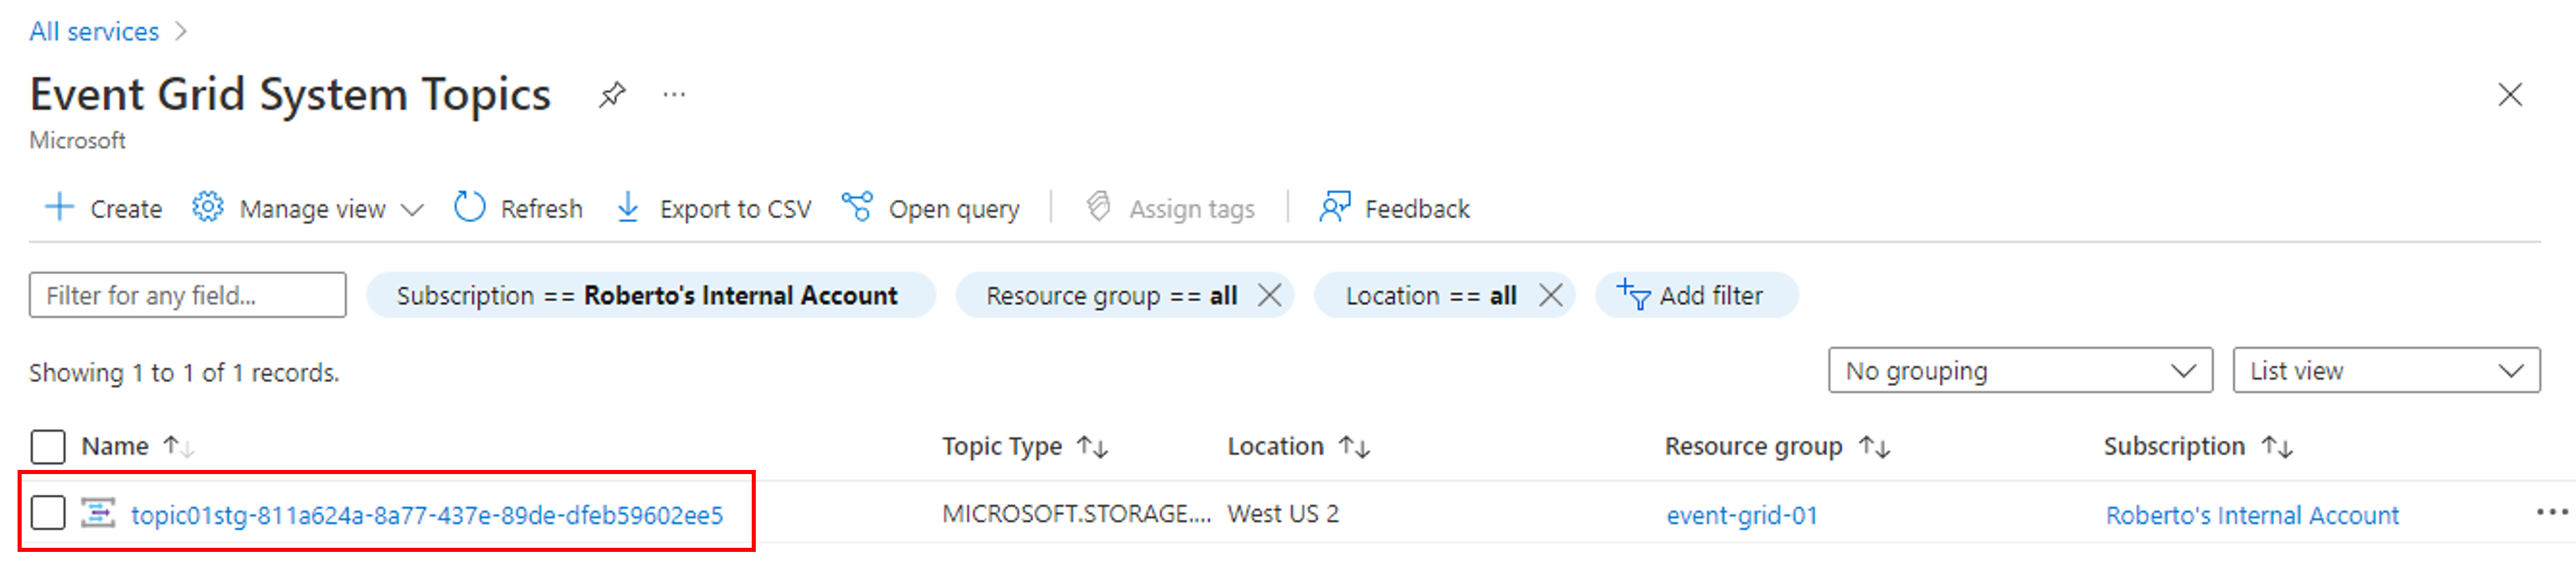
- In the search bar at the top, search for Event Grid system topics.
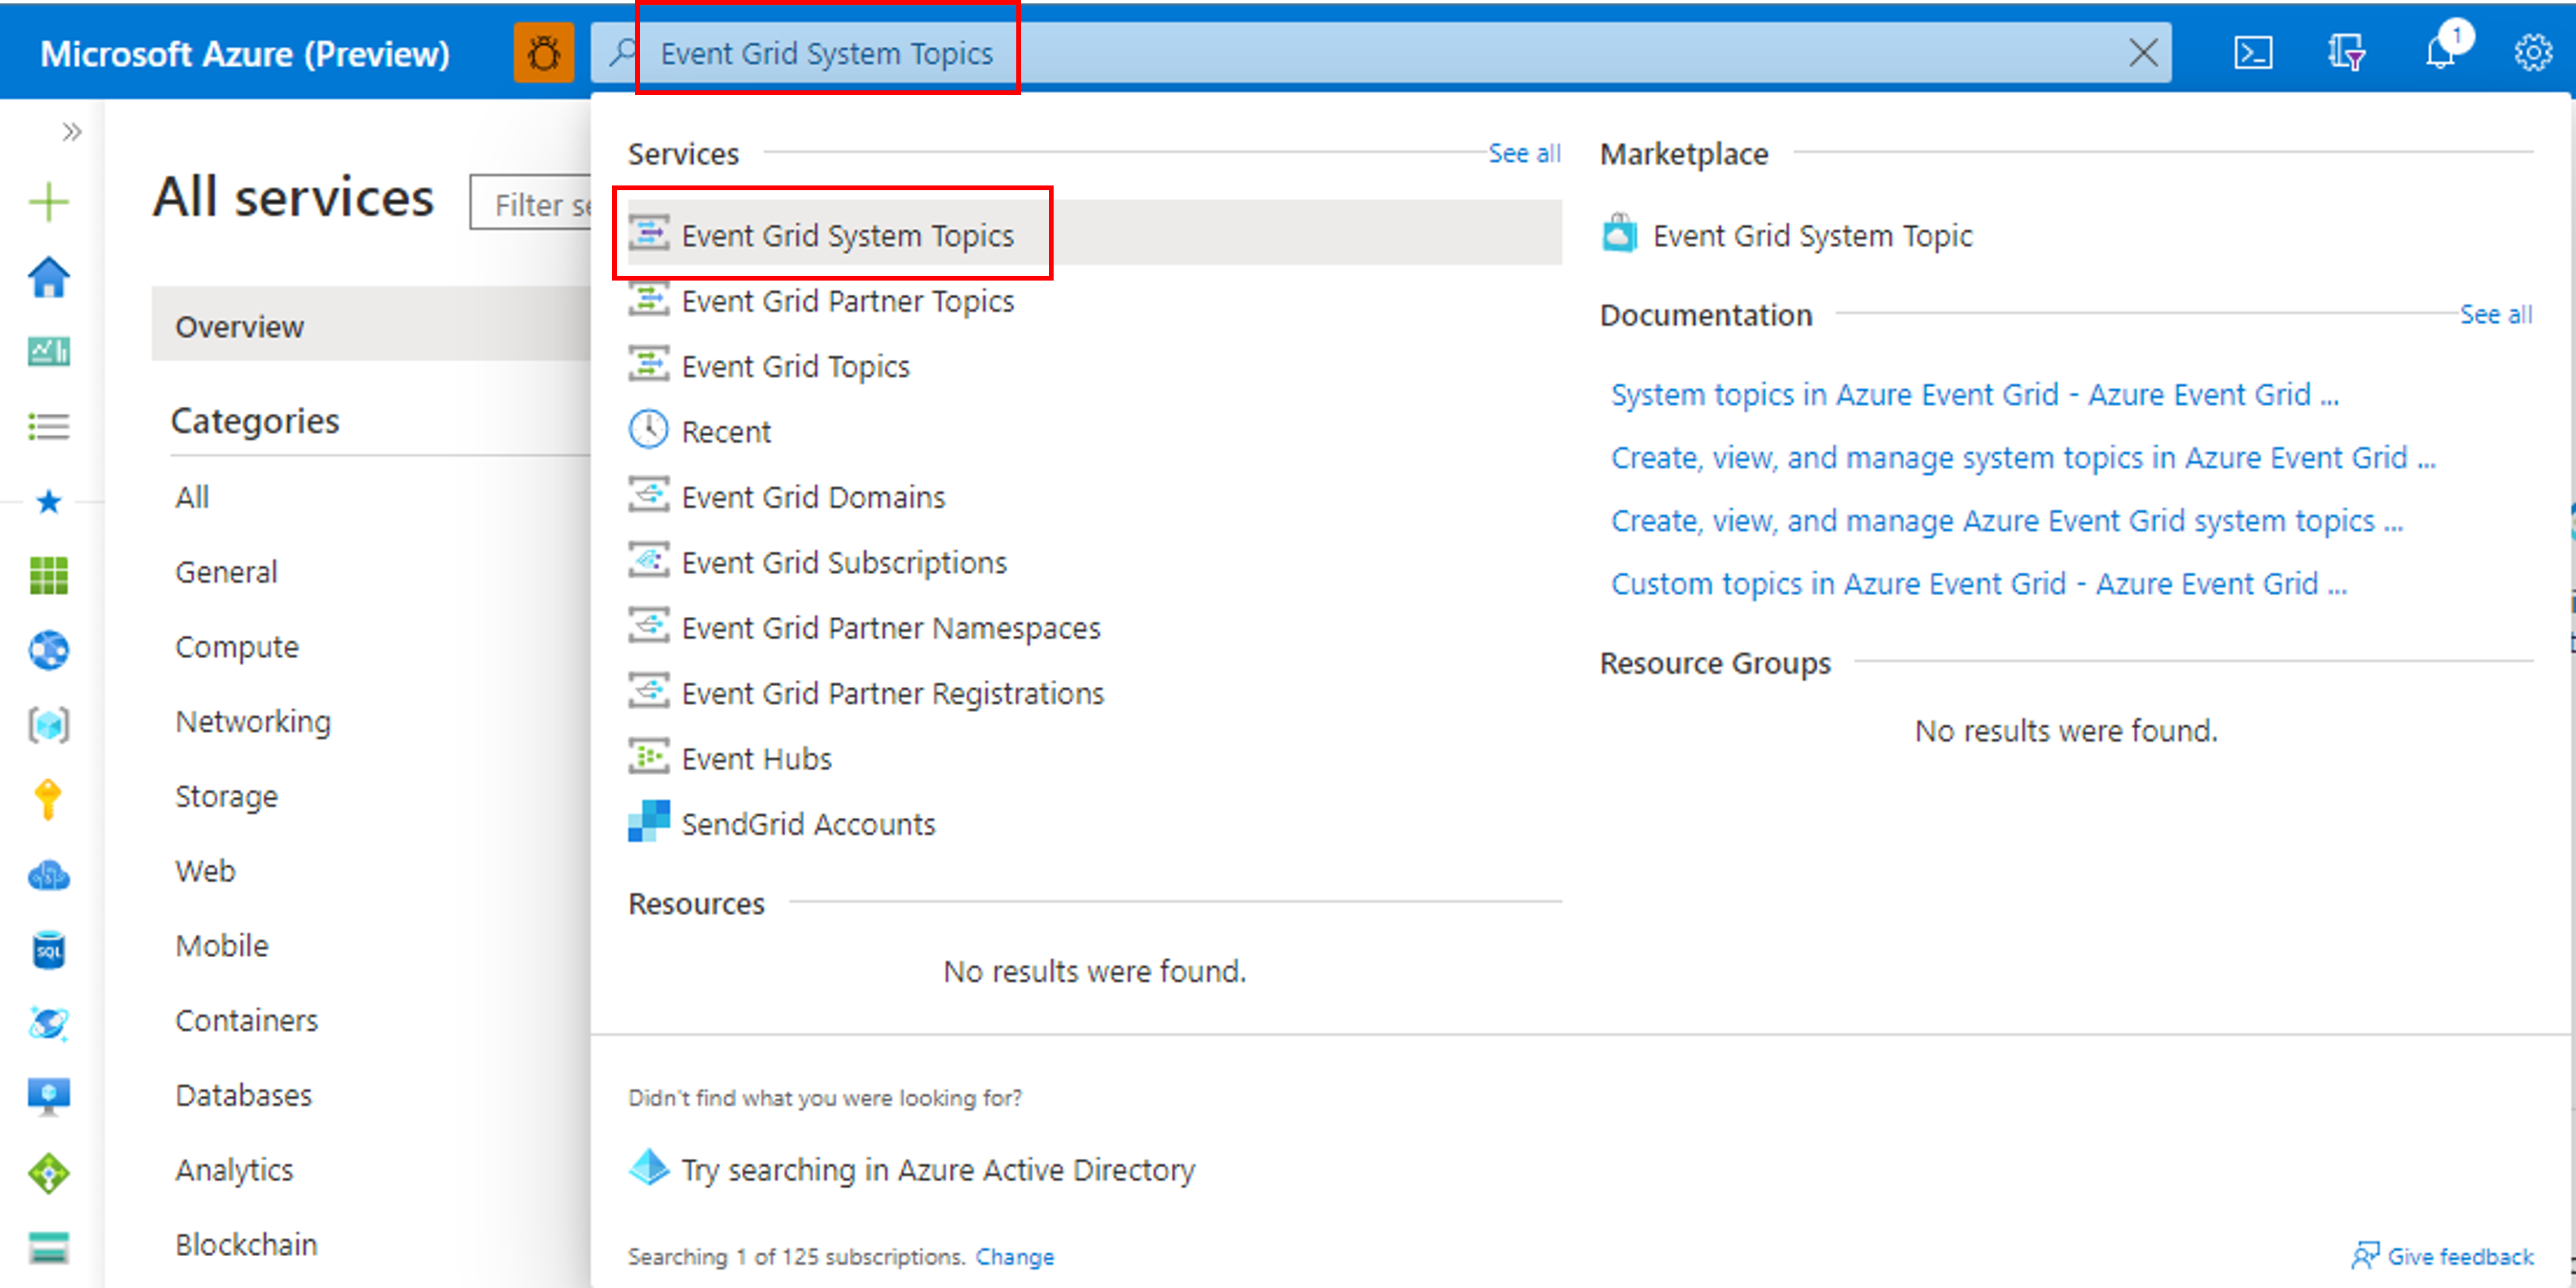
- Select the system topic for which you want to configure diagnostic settings.
- In the search bar at the top, search for Event Grid system topics.
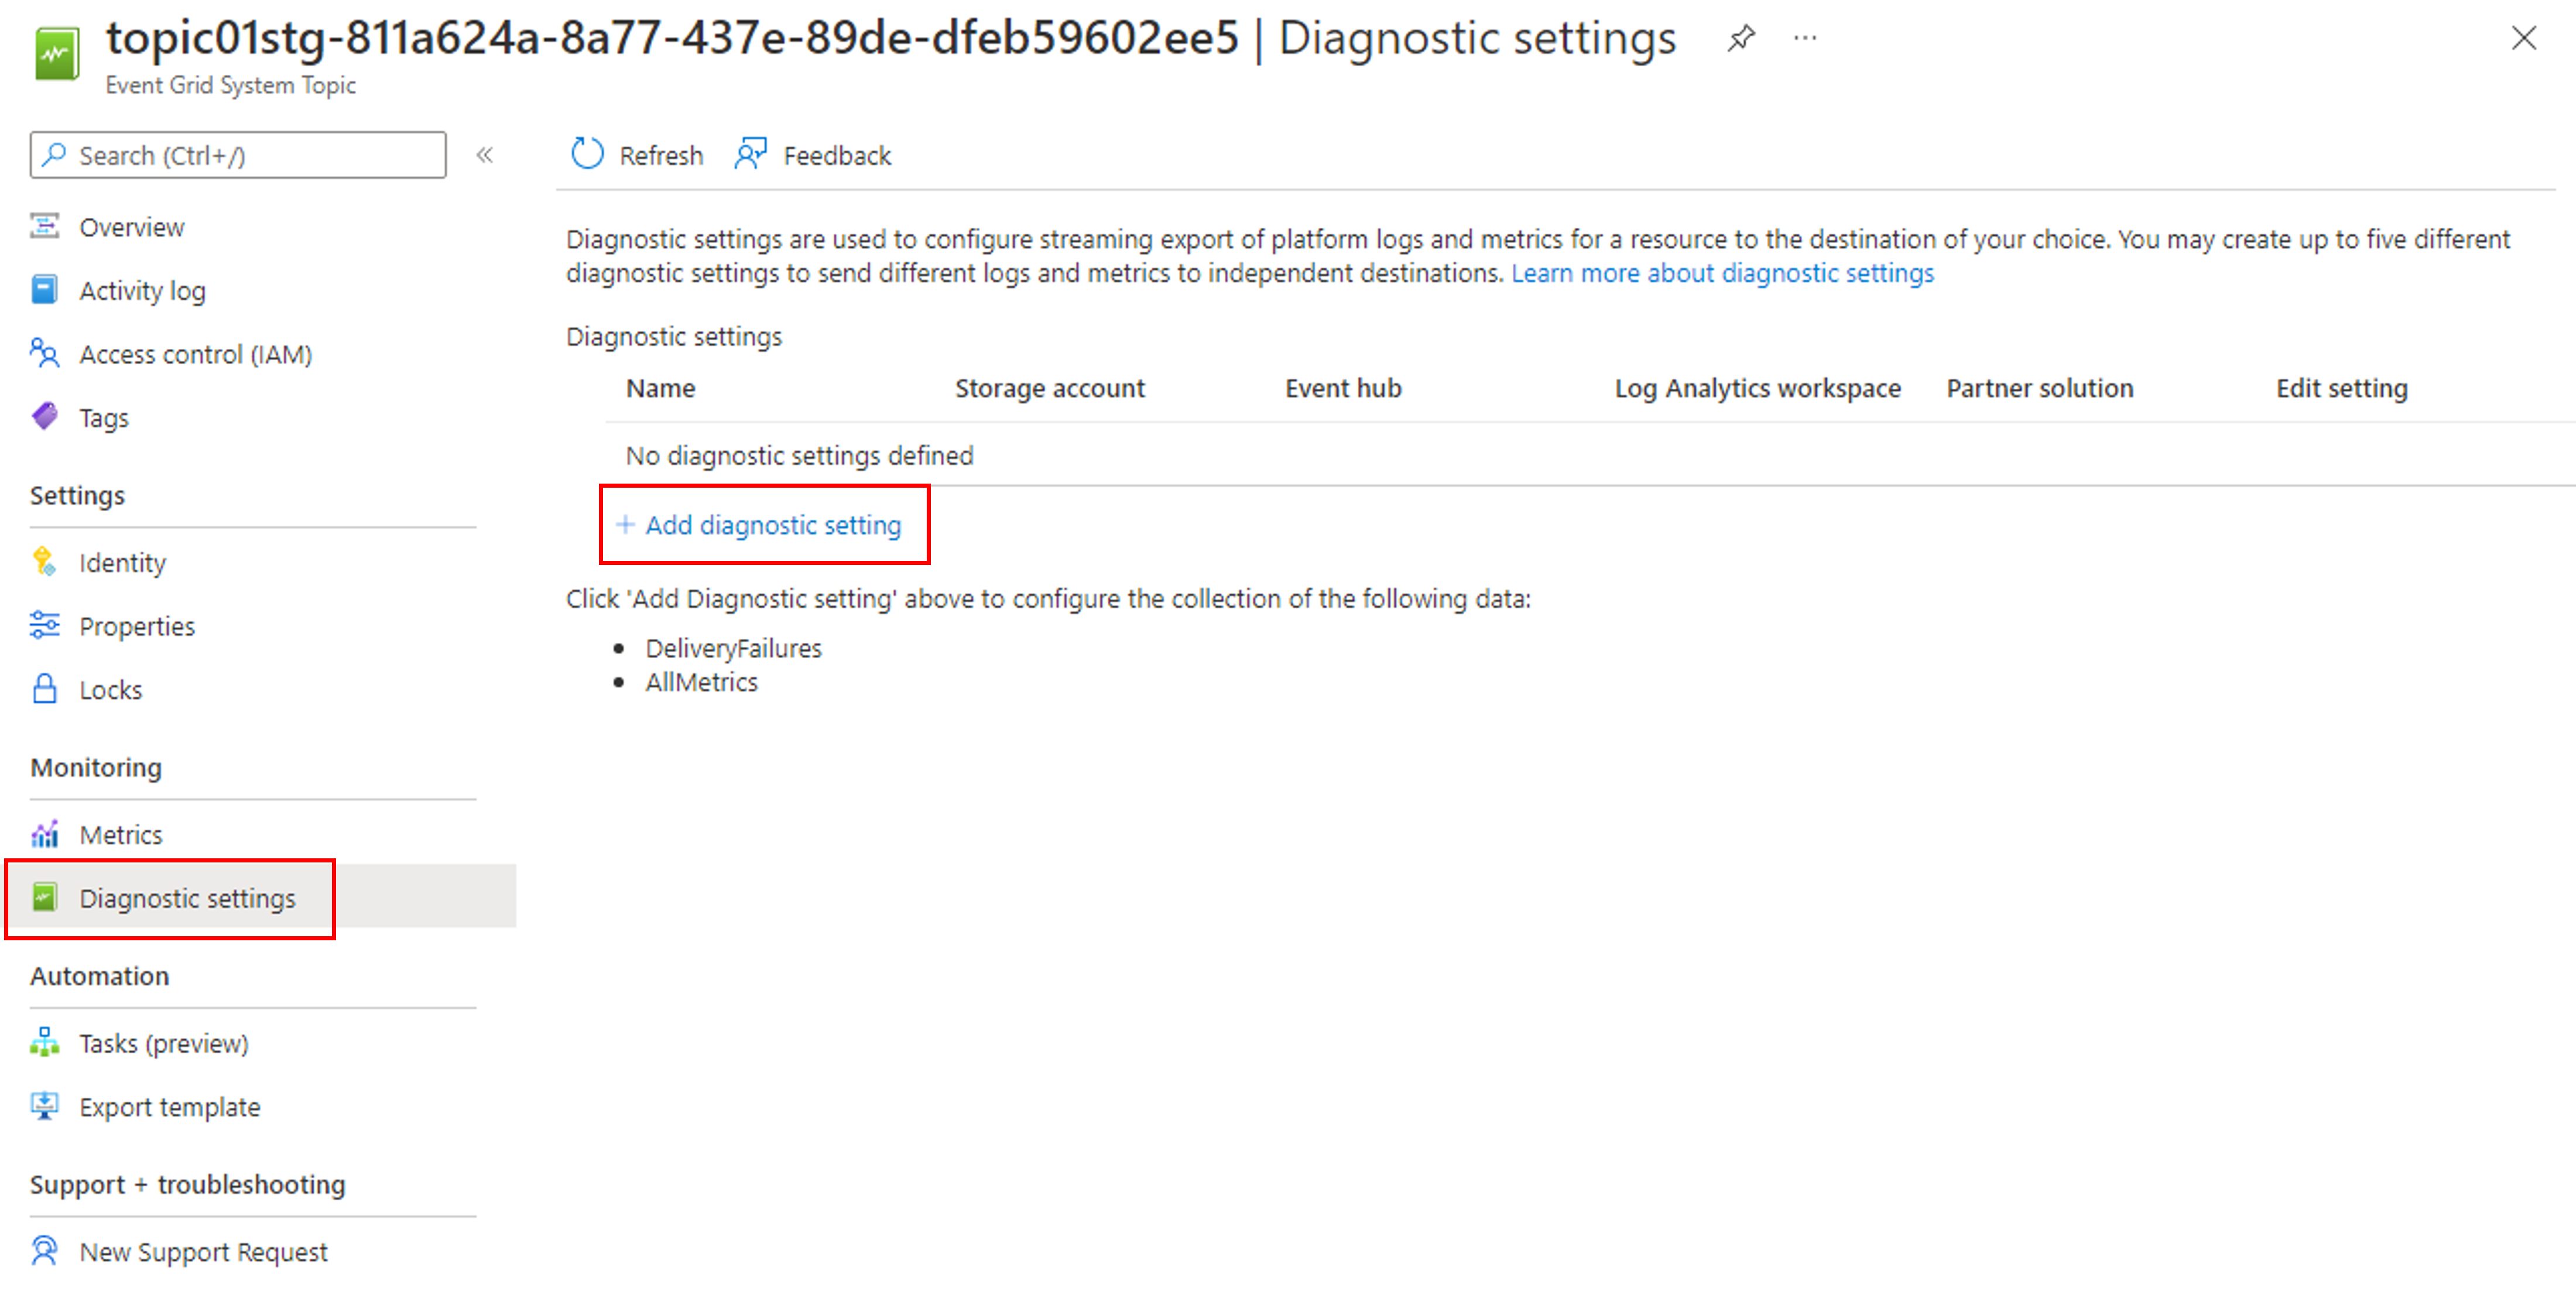
- Select Diagnostic settings under Monitoring on the left menu, and then select Add diagnostic setting.
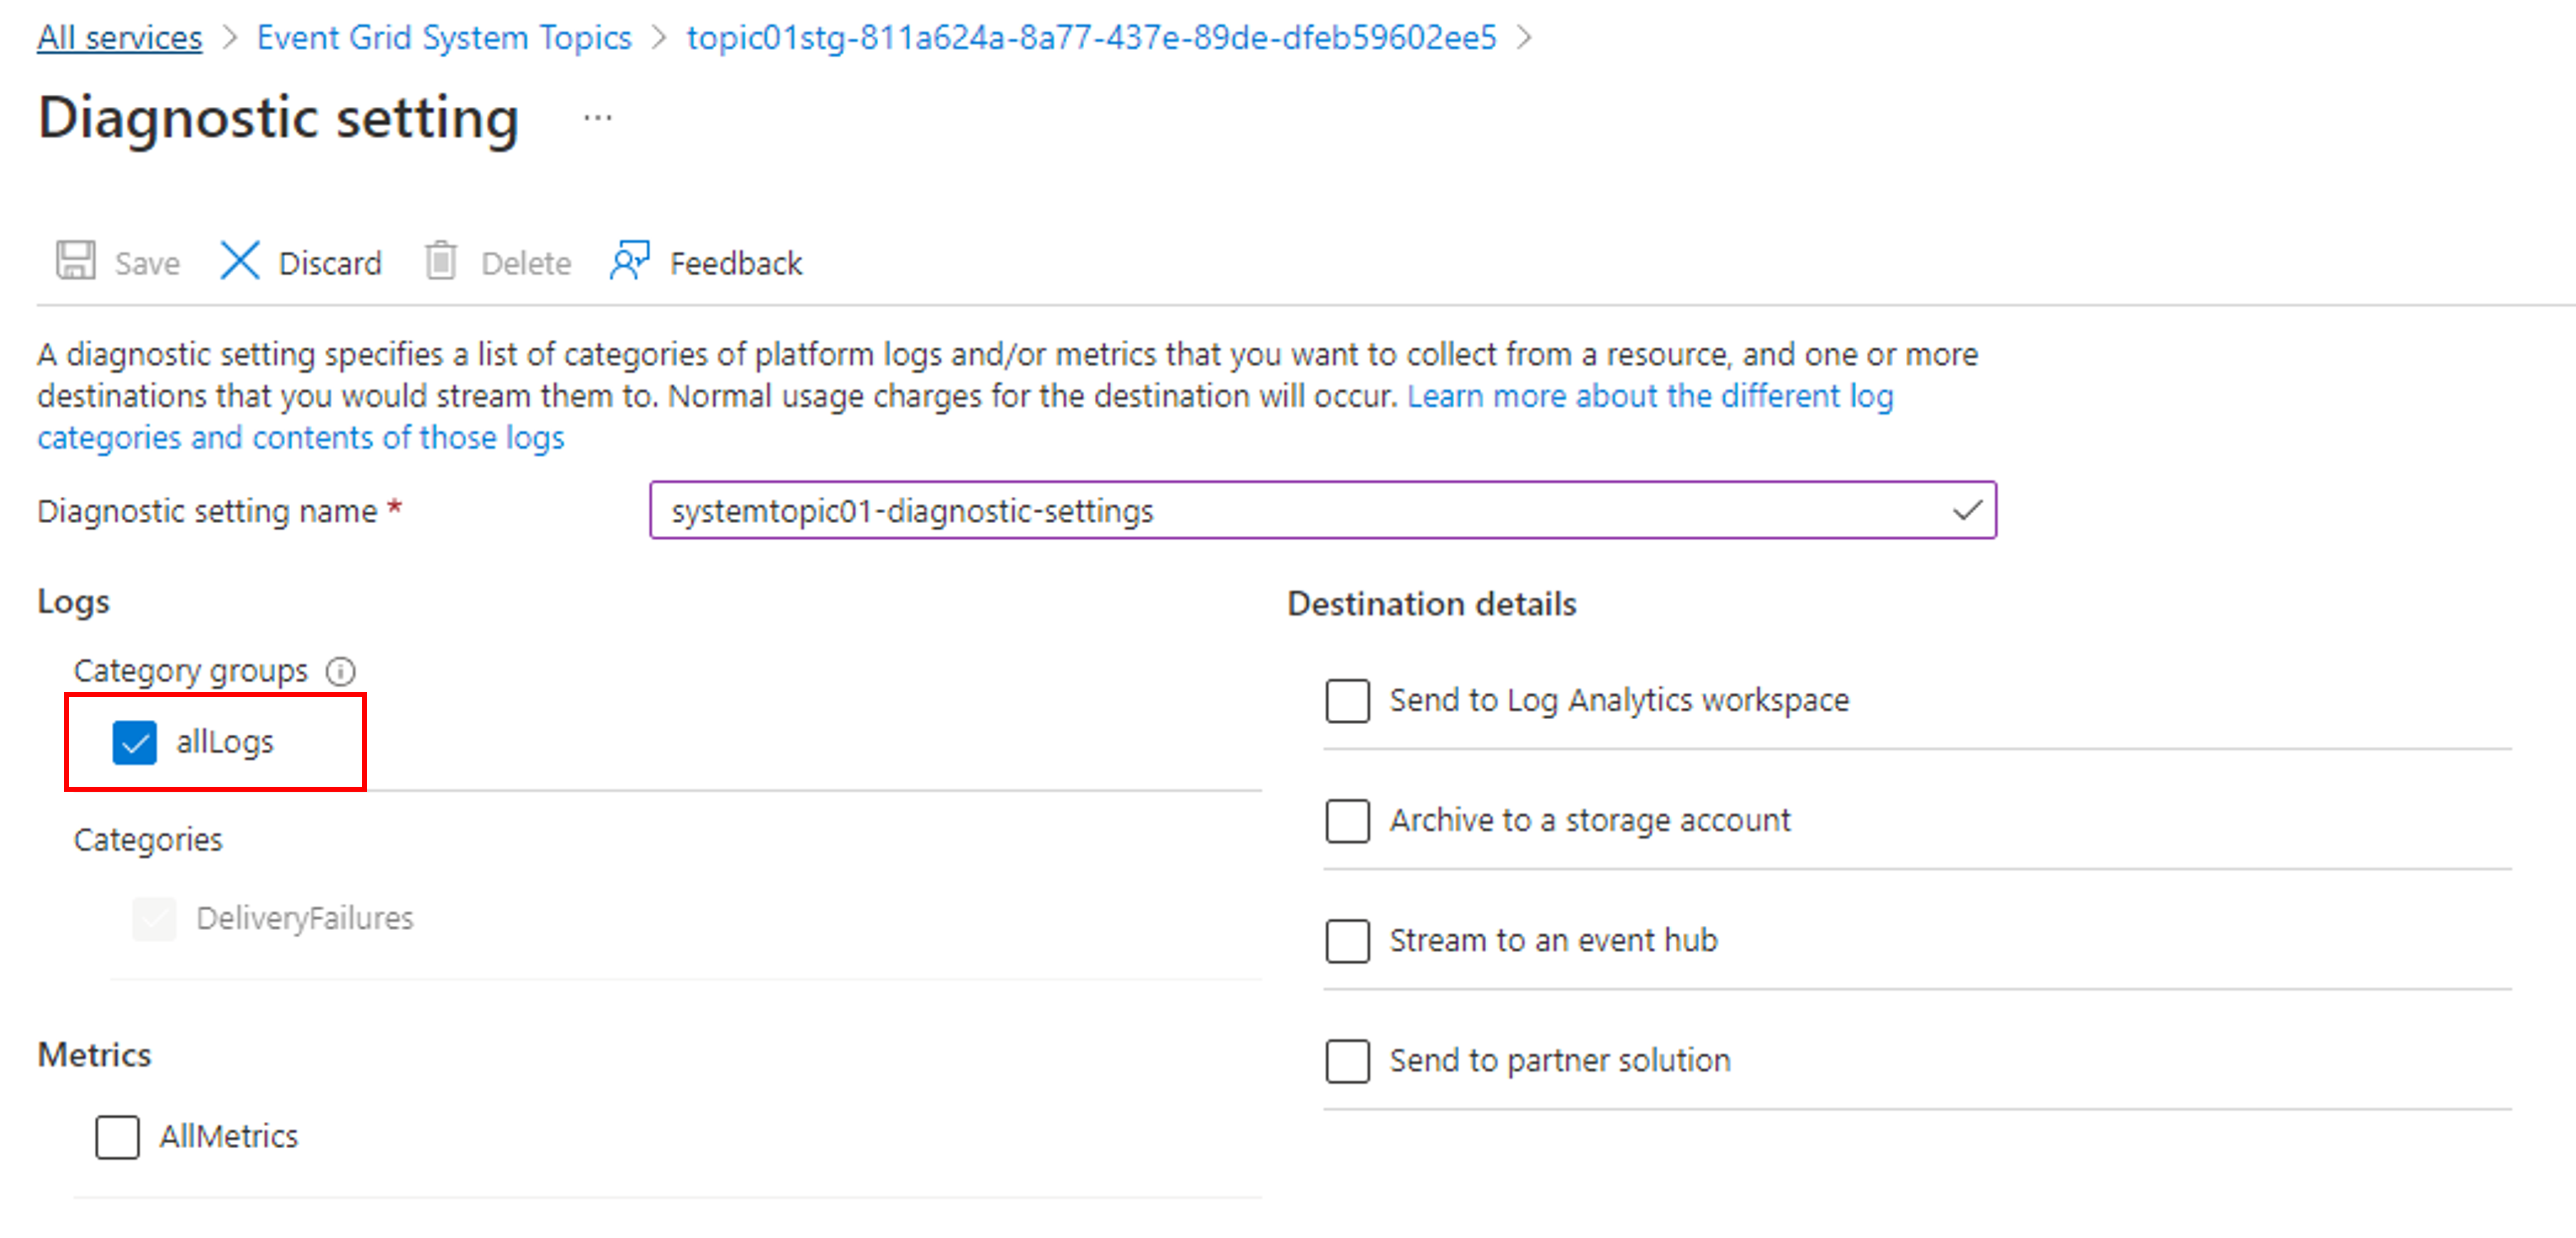
- Specify a name for the diagnostic setting.
- Select the allLogs option in the Logs section.
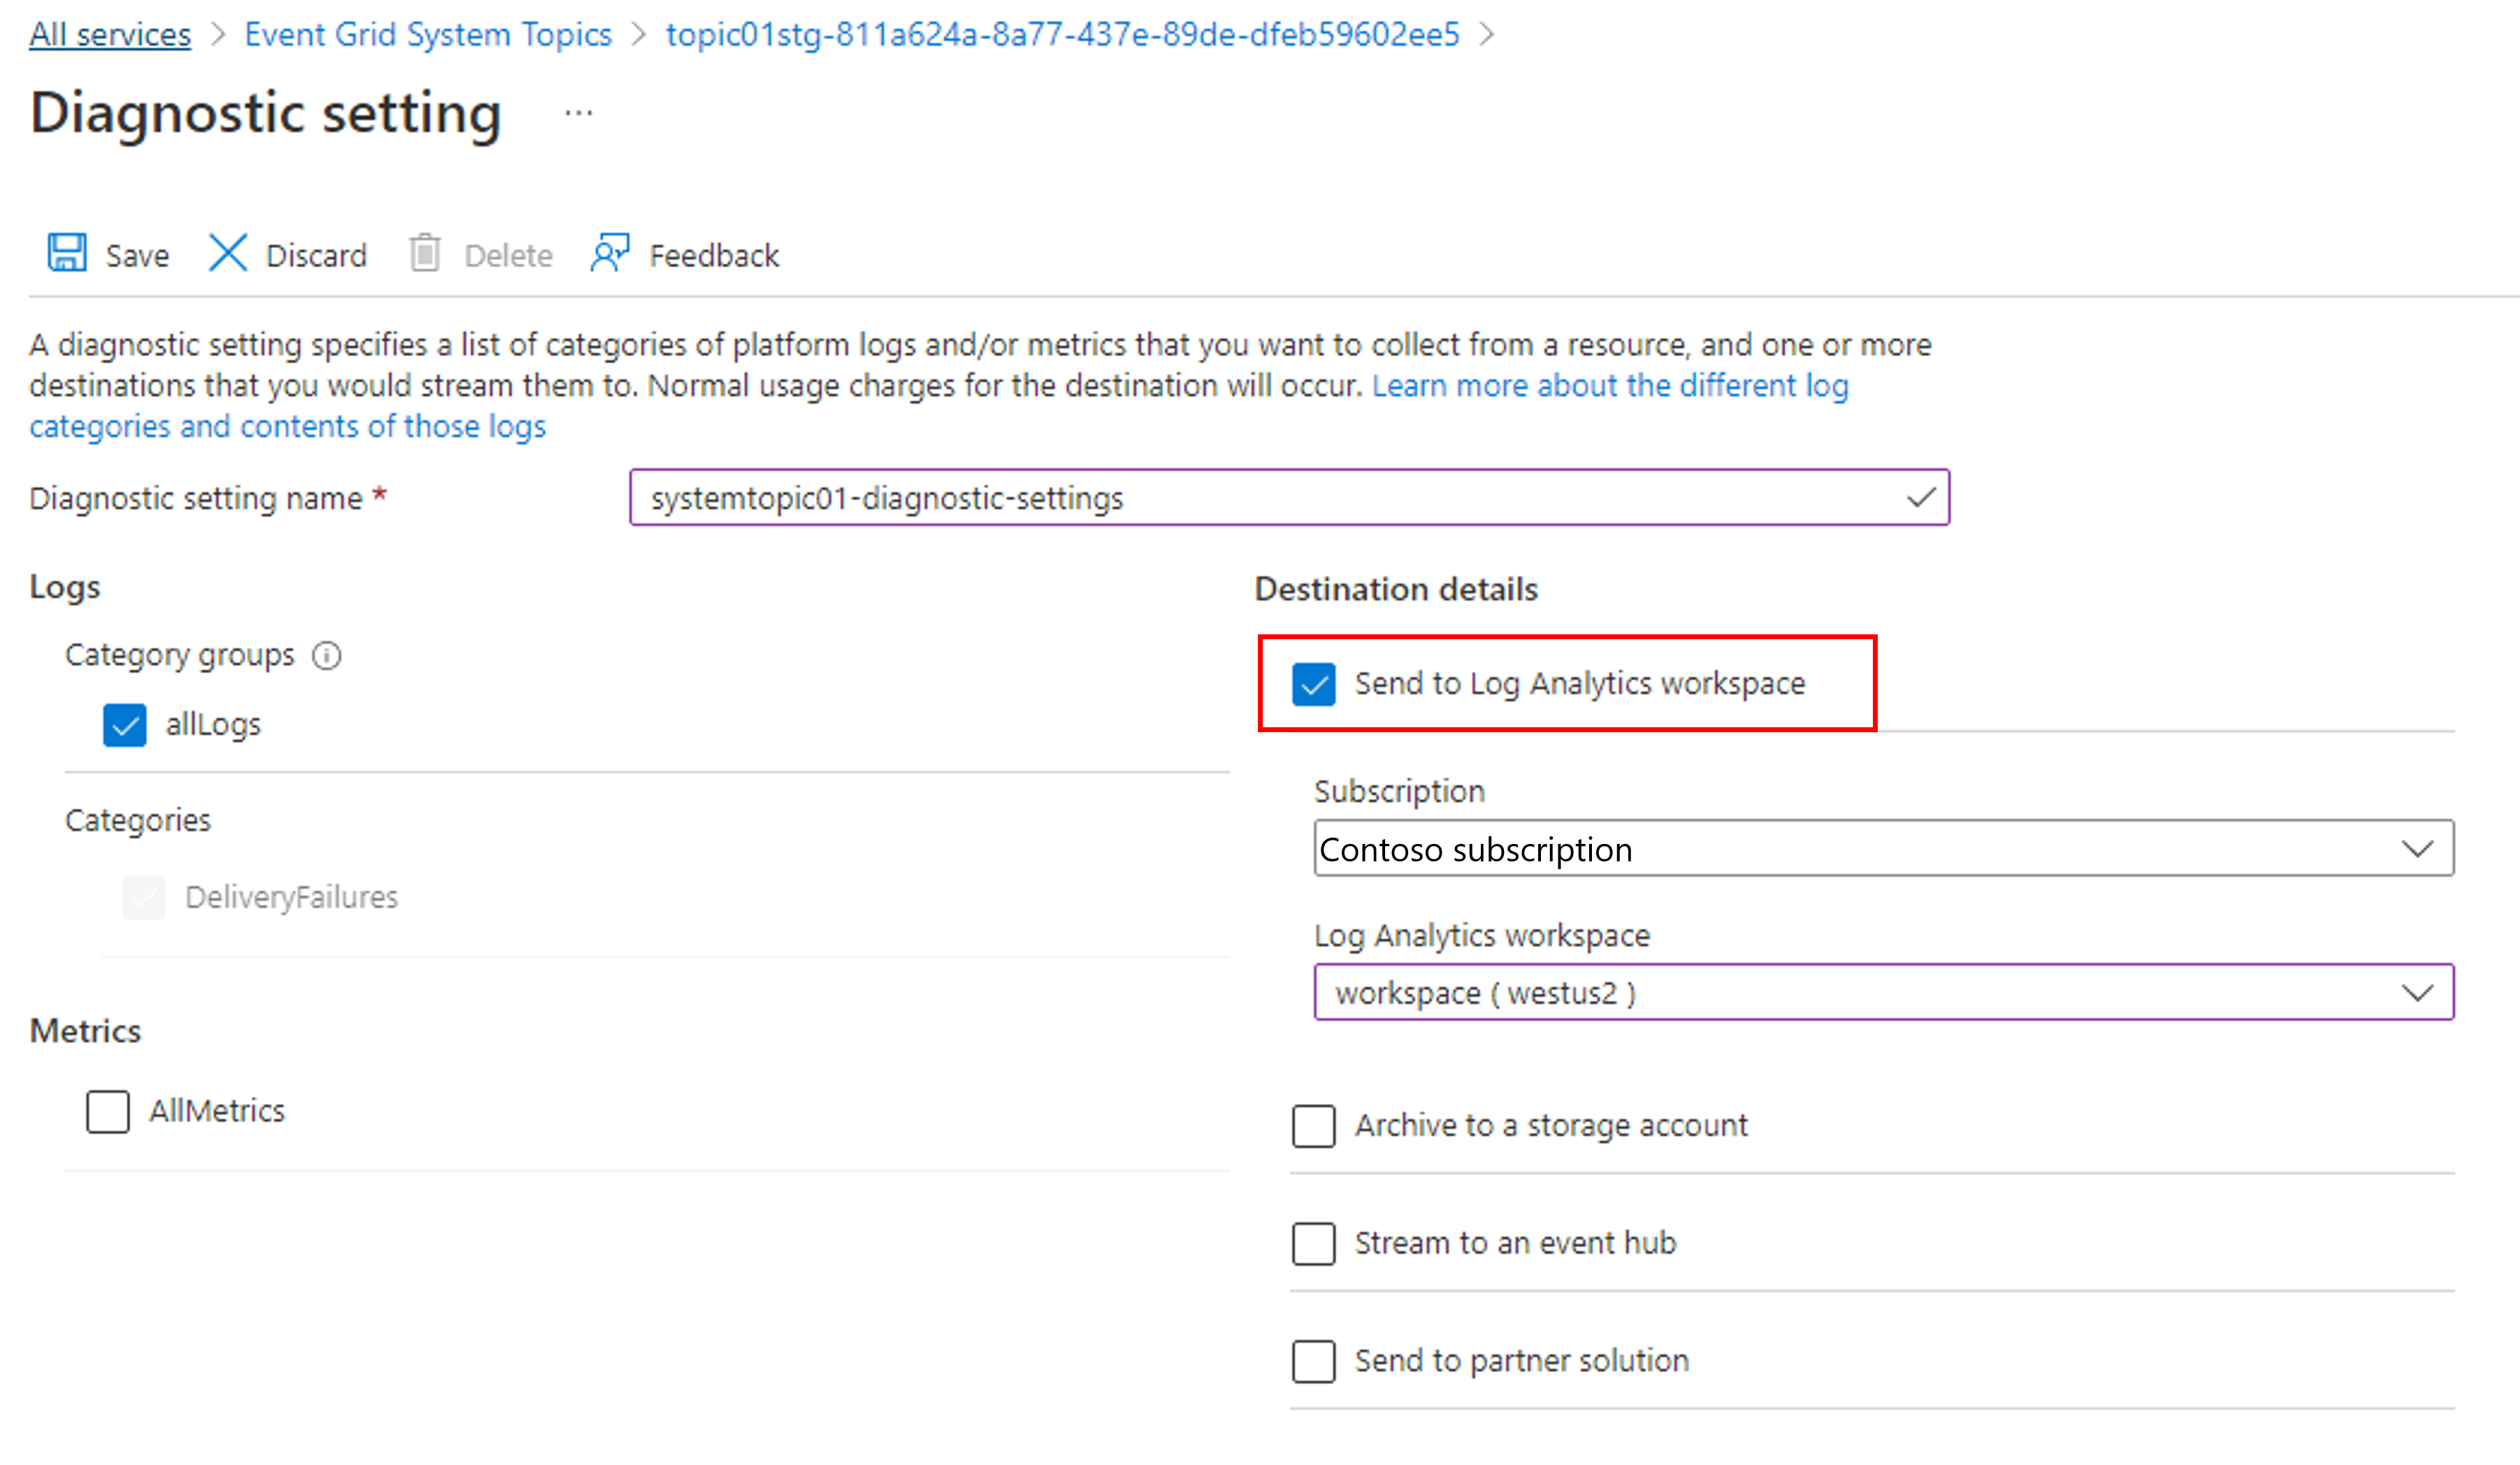
- Enable one or more of the capture destinations for the logs, and then configure them by selecting a previous created capture resource.
- If you select Send to Log Analytics, select the Log Analytics workspace.
- If you select Archive to a storage account, select Storage account - Configure, and then select the storage account in your Azure subscription.
- If you select Stream to an Event Hub, select Event Hub - Configure, and then select the Event Hubs namespace, event hub, and the access policy.
- If you select Send to Log Analytics, select the Log Analytics workspace.
- Select Save. Then, select X in the right-corner to close the page.
- Now, back on the Diagnostic settings page, confirm that you see a new entry in the Diagnostics Settings table.
You can also enable collection of all metrics for the system topic.
View diagnostic logs in Azure Storage
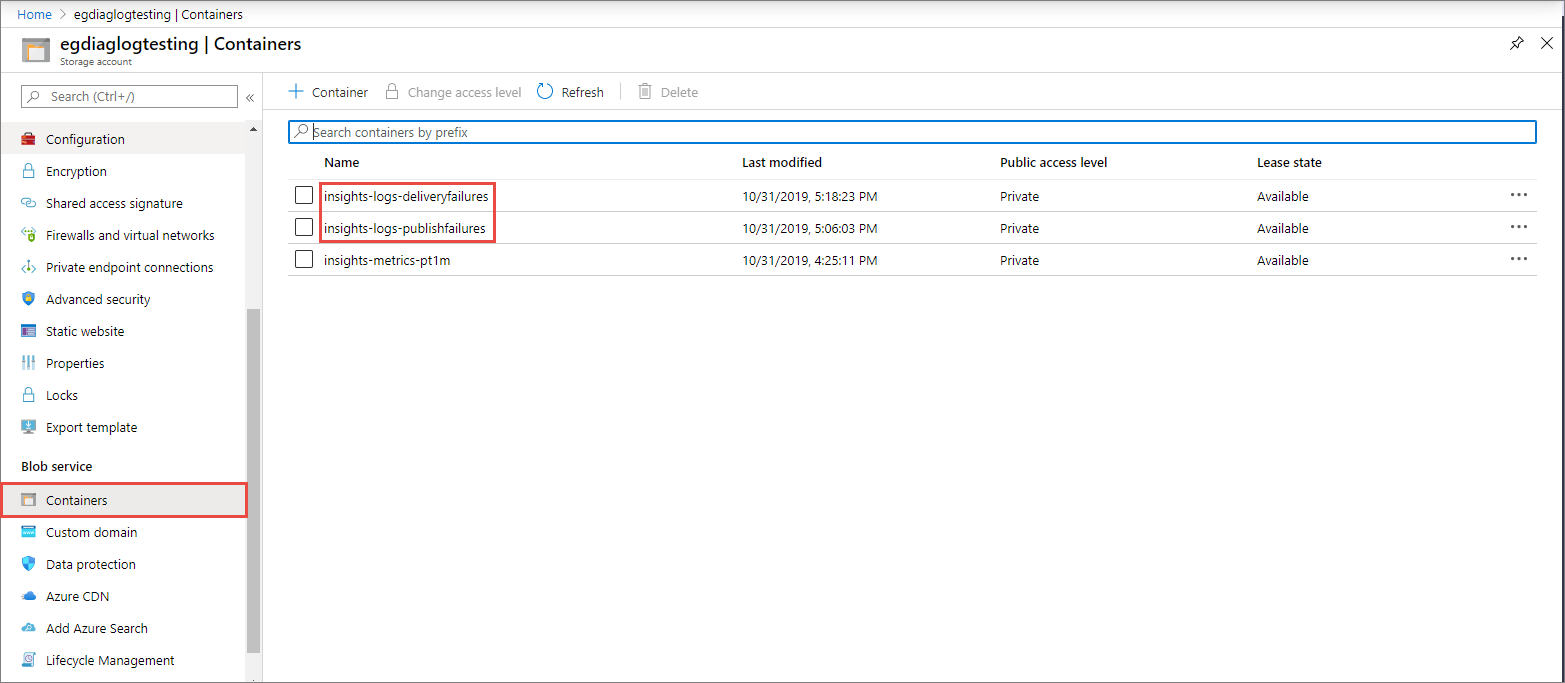
Once you enable a storage account as a capture destination, Event Grid starts emitting diagnostic logs. You should see new containers named insights-logs-deliveryfailures and insights-logs-publishfailures in the storage account.
As you navigate through one of the containers, you'll end up at a blob in JSON format. The file contains log entries for either a delivery failure or a publish failure. The navigation path represents the ResourceId of the Event Grid topic and the timestamp (minute level) as to when the log entries were emitted. The blob/JSON file, which is downloadable, in the end adheres to the schema described in the next section.
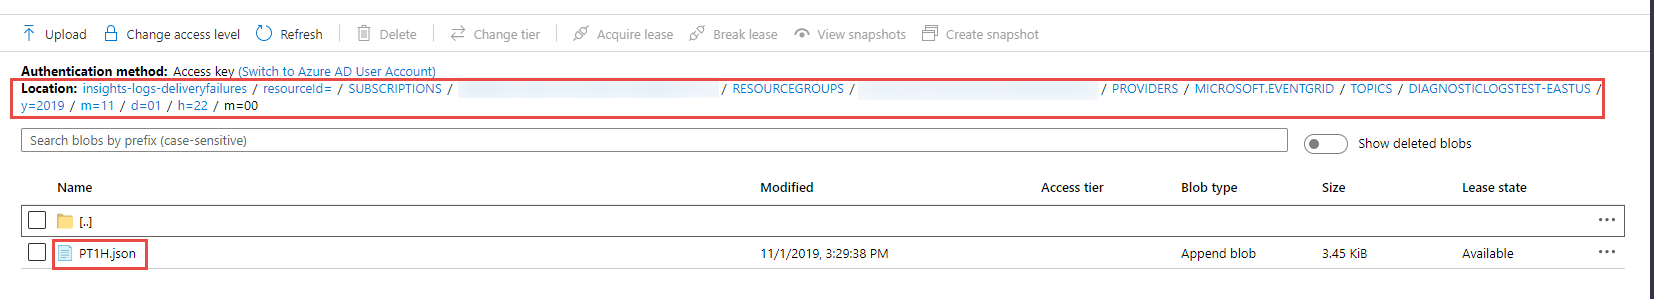
You should see content in the JSON file similar to the following example:
{
    "time": "2019-11-01T00:17:13.4389048Z",
    "resourceId": "/SUBSCRIPTIONS/SAMPLE-SUBSCRIPTION-ID /RESOURCEGROUPS/SAMPLE-RESOURCEGROUP-NAME/PROVIDERS/MICROSOFT.EVENTGRID/TOPICS/SAMPLE-TOPIC-NAME ",
    "eventSubscriptionName": "SAMPLEDESTINATION",
    "category": "DeliveryFailures",
    "operationName": "Deliver",
    "message": "Message:outcome=NotFound, latencyInMs=2635, id=xxxxxxxx-xxxx-xxxx-xxxx-xxxxxxxxxxxxx, systemId=xxxxxxx-xxxx-xxxx-xxxx-xxxxxxxxxxxx, state=FilteredFailingDelivery, deliveryTime=11/1/2019 12:17:10 AM, deliveryCount=0, probationCount=0, deliverySchema=EventGridEvent, eventSubscriptionDeliverySchema=EventGridEvent, fields=InputEvent, EventSubscriptionId, DeliveryTime, State, Id, DeliverySchema, LastDeliveryAttemptTime, SystemId, fieldCount=, requestExpiration=1/1/0001 12:00:00 AM, delivered=False publishTime=11/1/2019 12:17:10 AM, eventTime=11/1/2019 12:17:09 AM, eventType=Type, deliveryTime=11/1/2019 12:17:10 AM, filteringState=FilteredWithRpc, inputSchema=EventGridEvent, publisher=DIAGNOSTICLOGSTEST-EASTUS.EASTUS-1.EVENTGRID.AZURE.NET, size=363, fields=Id, PublishTime, SerializedBody, EventType, Topic, Subject, FilteringHashCode, SystemId, Publisher, FilteringTopic, TopicCategory, DataVersion, MetadataVersion, InputSchema, EventTime, fieldCount=15, url=sb://diagnosticlogstesting-eastus.servicebus.windows.net/, deliveryResponse=NotFound: The messaging entity 'sb://diagnosticlogstesting-eastus.servicebus.windows.net/eh-diagnosticlogstest' could not be found. TrackingId:c98c5af6-11f0-400b-8f56-c605662fb849_G14, SystemTracker:diagnosticlogstesting-eastus.servicebus.windows.net:eh-diagnosticlogstest, Timestamp:2019-11-01T00:17:13, referenceId: ac141738a9a54451b12b4cc31a10dedc_G14:"
}
Use Azure Resource Manager template
Here's a sample Azure Resource Manager template to enable diagnostic settings for an Event Grid topic. When you deploy this sample template, the following resources are created.
- An Event Grid topic
- A Log Analytics workspace
Then, it creates a diagnostic setting on the topic to send diagnostic information to the Log Analytics workspace.
{
    "$schema": "https://schema.management.azure.com/schemas/2019-04-01/deploymentTemplate.json#",
    "contentVersion": "1.0.0.0",
    "parameters": {
        "topic_name": {
            "defaultValue": "spegrid0917topic",
            "type": "String"
        },
        "log_analytics_workspace_name": {
            "defaultValue": "splogaw0625",
            "type": "String"
        },
        "location": {
            "defaultValue": "eastus",
            "type": "String"
        },
        "sku": {
            "defaultValue": "Free",
            "type": "String"
        }
    },
    "variables": {},
    "resources": [
        {
            "type": "Microsoft.EventGrid/topics",
            "apiVersion": "2020-10-15-preview",
            "name": "[parameters('topic_name')]",
            "location": "[parameters('location')]",
            "sku": {
                "name": "Basic"
            },
            "kind": "Azure",
            "identity": {
                "type": "None"
            },
            "properties": {
                "inputSchema": "EventGridSchema",
                "publicNetworkAccess": "Enabled"
            }
        },
        {
            "apiVersion": "2017-03-15-preview",
            "name": "[parameters('log_analytics_workspace_name')]",
            "location": "[parameters('location')]",
            "type": "Microsoft.OperationalInsights/workspaces",
            "properties": {
                "sku": {
                    "name": "[parameters('sku')]"
                }
            }
        },
        {
            "type": "Microsoft.EventGrid/topics/providers/diagnosticSettings",
            "apiVersion": "2017-05-01-preview",
            "name": "[concat(parameters('topic_name'), '/', 'Microsoft.Insights/', parameters('log_analytics_workspace_name'))]",
            "location": "[parameters('location')]",
            "dependsOn": [
                "[resourceId('Microsoft.EventGrid/topics', parameters('topic_name'))]",
                "[resourceId('Microsoft.OperationalInsights/workspaces', parameters('log_analytics_workspace_name'))]"
            ],
            "properties": {
                "workspaceId": "[resourceId('Microsoft.OperationalInsights/workspaces', parameters('log_analytics_workspace_name'))]",
                "metrics": [
                    {
                        "category": "AllMetrics",
                        "enabled": true
                    }
                ],
                "logs": [
                    {
                        "category": "DeliveryFailures",
                        "enabled": true
                    },
                    {
                        "category": "PublishFailures",
                        "enabled": true
                    }
                ]
            }
        }
    ]
}
Enable diagnostic logs for audit traces
Event Grid can publish audit traces for data plane operations. To enable the feature, select audit in the Category groups section or select DataPlaneRequests in the Categories section.
The audit trace can be used to ensure that data access is allowed only for authorized purposes. It collects information about security control such as resource name, operation type, network access, level, region and more. For more information about how to enable the diagnostic setting, see Diagnostic logs in Event Grid topics and Event domains.
Important
For more information about the DataPlaneRequests schema, see Diagnostic logs.
Next steps
For the log schema and other conceptual information about diagnostic logs for topics or domains, see Diagnostic logs.