Note
Access to this page requires authorization. You can try signing in or changing directories.
Access to this page requires authorization. You can try changing directories.
When you have critical applications and business processes relying on Azure resources, you want to monitor those resources for their availability, performance, and operation. This article describes the monitoring data generated by Azure Event Grid namespaces and how to analyze and alert on this data with Azure Monitor.
What is Azure Monitor?
Azure Event Grid creates monitoring data using Azure Monitor, which is a full stack monitoring service in Azure. Azure Monitor provides a complete set of features to monitor your Azure resources. It can also monitor resources in other clouds and on-premises.
Start with the article Monitoring Azure resources with Azure Monitor, which describes the following concepts:
- What is Azure Monitor?
- Costs associated with monitoring
- Monitoring data collected in Azure
- Configuring data collection
- Standard tools in Azure for analyzing and alerting on monitoring data
The following sections build on this article by describing the specific data gathered for Azure Event Grid namespaces. These sections also provide examples for configuring data collection and analyzing this data with Azure tools.
Tip
To understand costs associated with Azure Monitor, see Azure Monitor cost and usage. To understand the time it takes for your data to appear in Azure Monitor, see Log data ingestion time.
Monitoring data from Event Grid namespaces
Azure Event Grid collects the same kinds of monitoring data as other Azure resources that are described in Monitoring data from Azure resources.
See the following monitoring data reference articles for a detailed reference of the logs and metrics created by Azure Event Grid.
- Monitor data reference for MQTT broker feature
- Monitor data reference for pull delivery
- Monitor data reference for Azure Event Grid's push delivery using namespaces
Collection and routing
Platform metrics and the activity log are collected and stored automatically, but can be routed to other locations by using a diagnostic setting. Resource Logs aren't collected and stored until you create a diagnostic setting and route them to one or more locations.
See Create diagnostic setting to collect platform logs and metrics in Azure for the detailed process for creating a diagnostic setting using the Azure portal, CLI, or PowerShell. When you create a diagnostic setting, you specify which categories of logs to collect.
The categories for Azure Event Grid's MQTT broker are listed in Monitor data reference for Azure Event Grid’s MQTT broker feature.
Note
Azure Monitor doesn't include dimensions in the exported metrics data, that's sent to a destination like Azure Storage, Azure Event Hubs, Log Analytics, etc.
Azure Storage
If you use Azure Storage to store the diagnostic logging information, the information is stored in containers named insights-logs-operationlogs and insights-metrics-pt1m. Sample URL for an operation log: https://<Azure Storage account>.blob.core.windows.net/insights-logs-operationallogs/resourceId=/SUBSCRIPTIONS/<Azure subscription ID>/RESOURCEGROUPS/<Resource group name>/PROVIDERS/MICROSOFT.EVENTGRID/NAMESPACES/<Namespace name>/y=<YEAR>/m=<MONTH-NUMBER>/d=<DAY-NUMBER>/h=<HOUR>/m=<MINUTE>/PT1H.json. The URL for a metric log is similar.
Azure Event Hubs
If you use Azure Event Hubs to store the diagnostic logging information, the information is stored in event hubs named insights-logs-operationlogs and insights-metrics-pt1m. You can also select an existing event hub except for the event hub for which you're configuring diagnostic settings.
Log Analytics
If you use Log Analytics to store the diagnostic logging information, the information is stored in tables named AzureDiagnostics / AzureMetrics or resource specific tables
Important
Enabling these settings requires additional Azure services (storage account, event hub, or Log Analytics), which may increase your cost. To calculate an estimated cost, visit the Azure pricing calculator.
Note
When you enable metrics in a diagnostic setting, dimension information is not currently included as part of the information sent to a storage account, event hub, or log analytics.
The metrics and logs you can collect are discussed in the following sections.
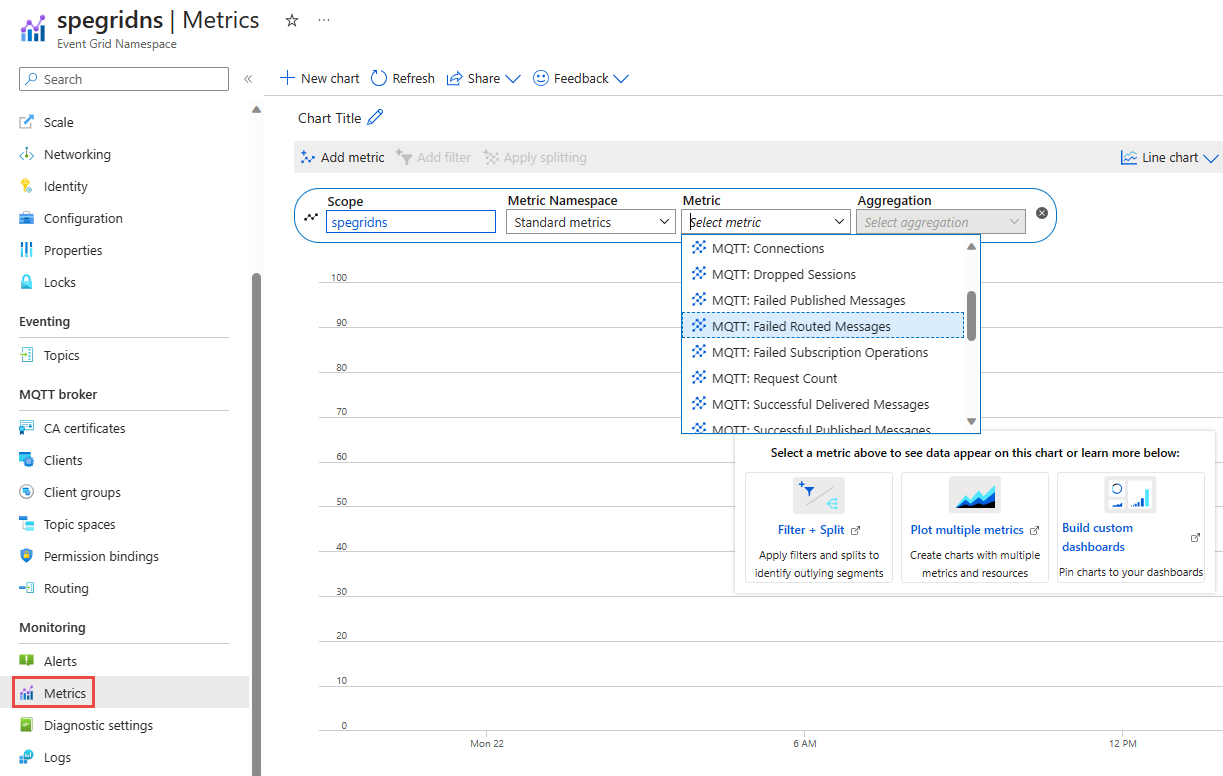
Analyze metrics
You can analyze metrics for Azure Event Grid namespaces by selecting Metrics from the Azure Monitor section on the home page for your Event Grid namespace. See Analyze metrics with Azure Monitor metrics explorer for details on using this tool.
See the following monitoring data reference articles for metrics created by Azure Event Grid.
- Monitor data reference for MQTT broker feature
- Monitor data reference for pull delivery
- Monitor data reference for Azure Event Grid's push delivery using namespaces
For reference, you can see a list of all resource metrics supported in Azure Monitor.
Tip
Azure Monitor metrics data is available for 90 days. However, when creating charts only 30 days can be visualized. For example, if you want to visualize a 90 day period, you must break it into three charts of 30 days within the 90 day period.
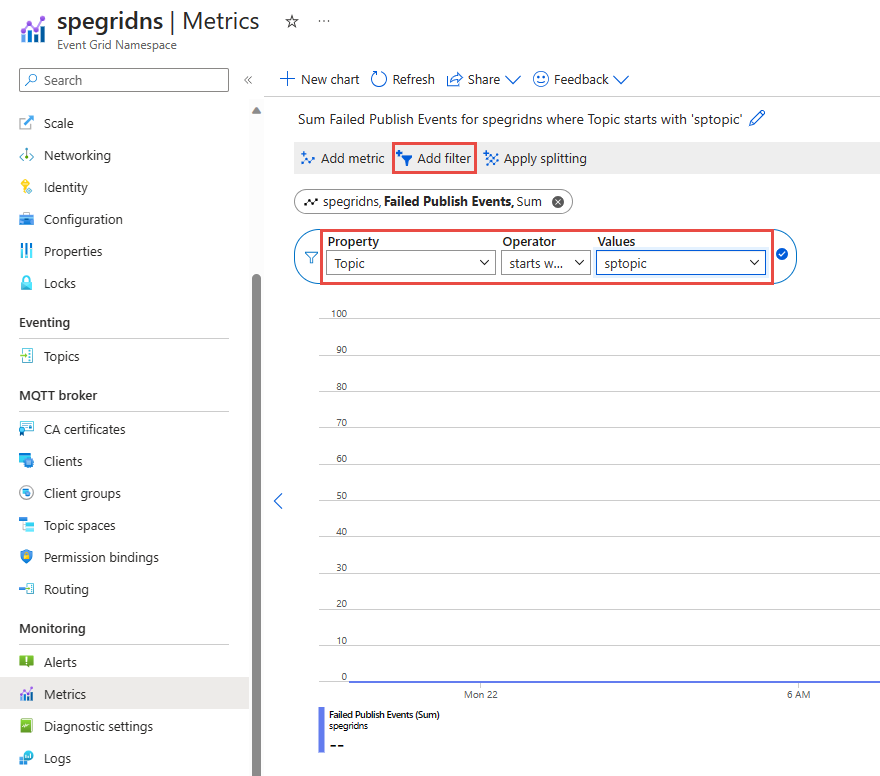
Filter and split
For metrics that support dimensions, you can apply filters using a dimension value. You can also split a metric by dimension to visualize how different segments of the metric compare with each other. For more information of filtering and splitting, see Advanced features of Azure Monitor.
Analyze logs
Using Azure Monitor Log Analytics requires you to create a diagnostic configuration and enable Send information to Log Analytics. For more information, see the Collection and routing section. Data in Azure Monitor Logs is stored in tables, with each table having its own set of unique properties. Azure Event Grid stores data in the following tables: AzureDiagnostics and AzureMetrics.
See the following monitoring data reference articles for a detailed reference of the logs and metrics created by Azure Event Grid.
- Monitor data reference for MQTT broker feature
- Monitor data reference for pull delivery
- Monitor data reference for Azure Event Grid's push delivery using namespaces
Sample Kusto queries
Important
When you select Logs on the left menu of the Azure Event Grid namespace page in the Azure portal, Log Analytics is opened with the query scope set to the current Azure Event Grid namespace. This means that log queries will only include data from that resource. If you want to run a query that includes data from other workspaces or data from other Azure services, select Logs from the Azure Monitor menu. See Log query scope and time range in Azure Monitor Log Analytics for details.
Following are sample queries that you can use to help you monitor your Azure Event Grid namespaces:
Disconnections report by reasons
EGNMqttDisconnections
| summarize count() by ResultSignature
Authentication errors report by session name
EGNFailedMqttConnections
| where ResultSignature == "AuthenticationError"
| summarize count() by SessionName
Use runtime logs
Azure Event Grid allows you to monitor and audit data plane interactions of your client applications using runtime audit logs and application metrics logs.
Using Runtime audit logs you can capture aggregated diagnostic information for all data plane access operations such as publishing or consuming events. Application metrics logs capture the aggregated data on certain runtime metrics (such as consumer lag and active connections) related to client applications are connected to Event Grid.
Enable runtime logs
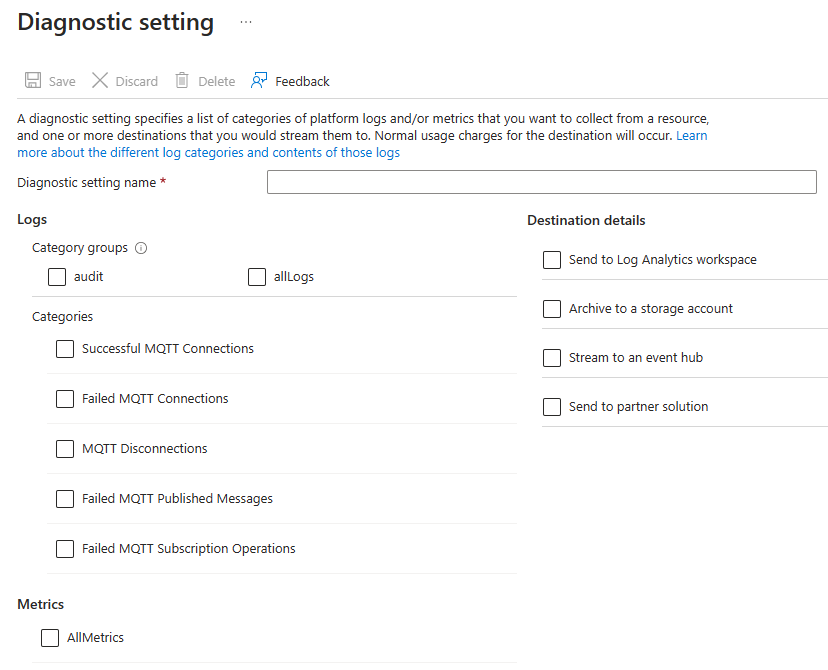
You can enable diagnostic logs by selecting Diagnostic settings from the Monitoring section on the Event Grid namespace page in Azure portal. Select Add diagnostic setting as shown in the following screenshot.
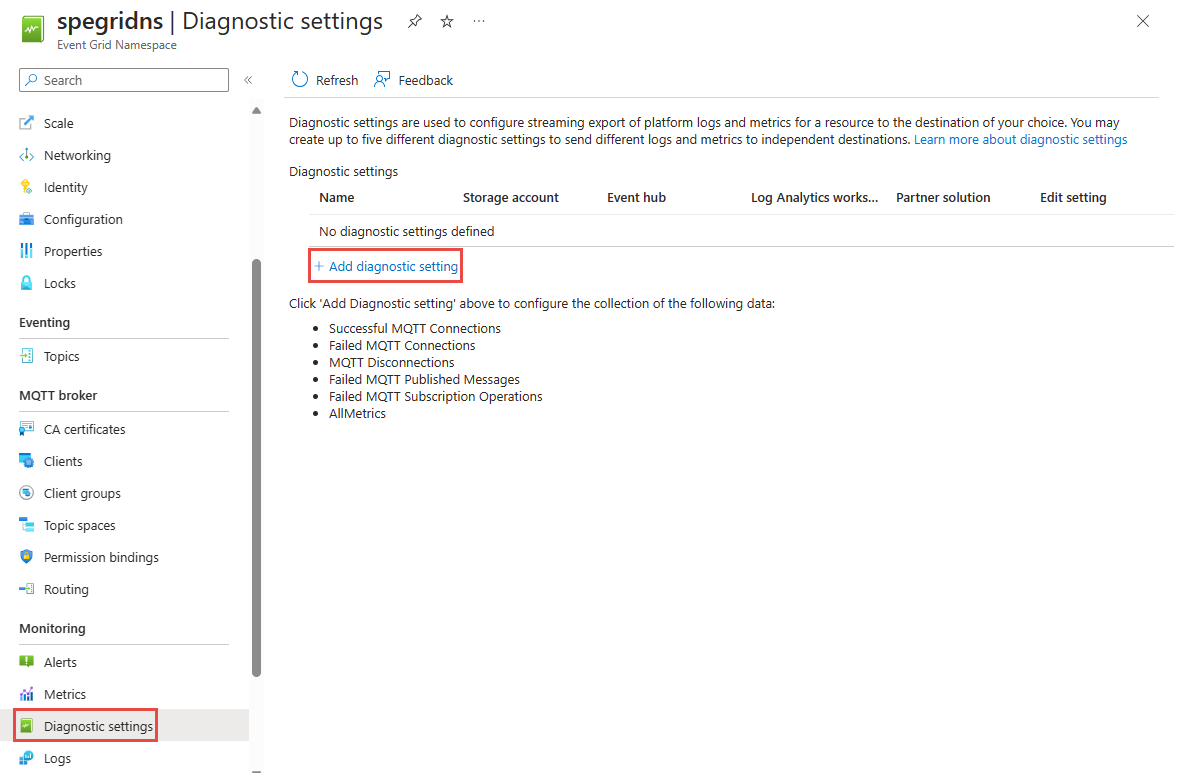
On the Diagnostic setting page, you can enable log categories as needed.
Once runtime logs are enabled, Event Grid starts collecting and storing them according to the diagnostic setting configuration.
Publish and consume sample data
To collect sample runtime audit logs in your Event Grid namespace, you can publish and consume sample data using client applications. See the following quickstarts:
- MQTT
- Pull model
- Push model
Analyze runtime audit logs
You can analyze the collected runtime audit logs using the following sample query.
Connections report by session names
EGNSuccessfulMqttConnections
| summarize count() by SessionName
Authentication errors report by session name
EGNFailedMqttConnections
| where ResultSignature == "AuthenticationError"
| summarize count() by SessionName
Alerts
You can access alerts for Azure Event Grid by selecting Alerts from the Azure Monitor section on the home page for your Event Grid namespace. See Create, view, and manage metric alerts using Azure Monitor for details on creating alerts.
Next steps
See the following monitoring data reference articles for a detailed reference of the logs and metrics created by Azure Event Grid.