Note
Access to this page requires authorization. You can try signing in or changing directories.
Access to this page requires authorization. You can try changing directories.
To see the activity, health, and cost of the agents and models across an Azure subscription in one place, go to Manage > Fleet in the Microsoft Foundry portal. The Fleet overview page summarizes the scope and date range that you select. It shows how much your agents run, how many tokens they use, what they cost, and where errors, slow runs, and policy violations are.
Platform admins and operators use Fleet as a starting point. Each card links to the page with more detail: Operations for usage, errors, and latency, Cost for spending, and Govern for policy violations. To monitor a single project's agents in detail, see Monitor agents with the Agent Monitoring Dashboard.
Important
Items marked preview in this article are currently in preview. This preview is provided without a service-level agreement, and Microsoft doesn't recommend it for production workloads. Certain features might not be supported or might have constrained capabilities. For more information, see Supplemental Terms of Use for Microsoft Azure Previews.
Prerequisites
An Azure subscription with at least one Foundry resource and project that has agent or model usage.
To see activity, token use, errors, and latency, permission to read usage metrics (
Microsoft.Insights/metrics/read). All Foundry roles, Monitoring Reader, and Reader include it.To see cost, a role with Cost Management read access at the scope that you view, such as Cost Management Reader or Reader. Owner and Contributor also include it. Foundry roles don't.
To see policy violations, permission to read Azure Policy compliance data (
Microsoft.PolicyInsights/*/read). All Foundry roles and Reader include it.For the permission behind each card, see Permissions for cost data and cost controls. To assign roles, see Assign Azure roles using the Azure portal.
Important
The Foundry RBAC roles were recently renamed. Foundry User, Foundry Owner, Foundry Account Owner, and Foundry Project Manager were previously named Azure AI User, Azure AI Owner, Azure AI Account Owner, and Azure AI Project Manager. You might still see the previous names in some places while the rename rolls out. The role IDs and core permissions are unchanged by the rename.
Open the Fleet page
-
Sign in to Microsoft Foundry. Make sure the New Foundry toggle is on. These steps refer to Foundry (new).

Select Manage in the upper-right navigation.
In the left pane, select Fleet. The Fleet overview page opens.
In Subscription, select the subscription that you want to view. Optionally, to focus on part of it, select resource groups in Resource group and projects in Project.
Select a date range: Last Day, 7D, 1M, or 3M. To set custom dates, select the date range picker. A custom range can cover up to three months.
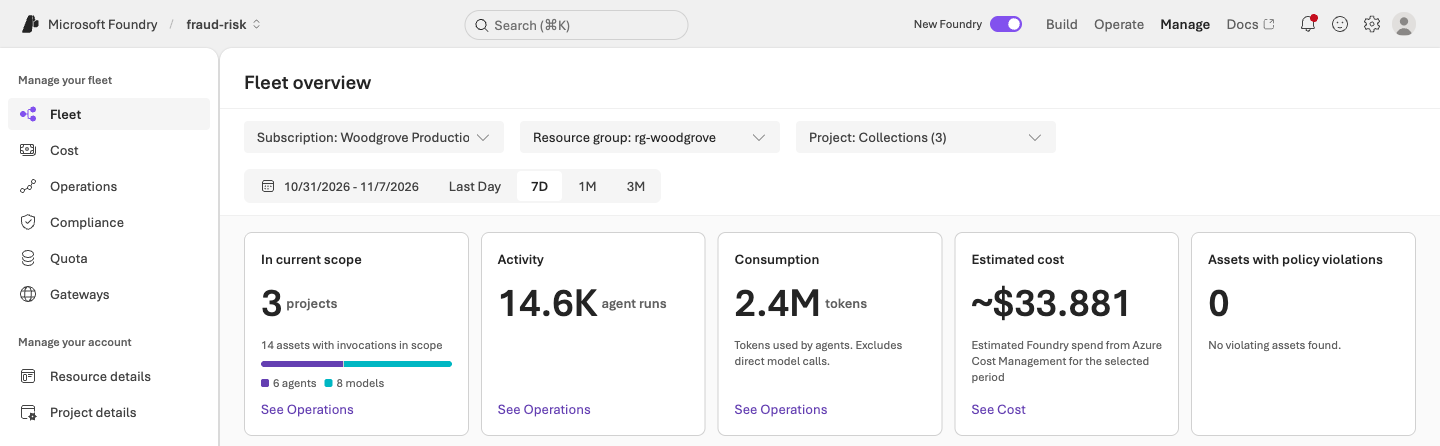
Note
The costs shown in this image are examples only and don't reflect actual prices. For current prices, see Microsoft Foundry pricing.
Cards that show a change compare the selected range with the previous period of the same length, for example the previous 7 days for 7D. Custom ranges don't show a comparison.
Read the summary cards
Five cards at the top of the page summarize the selected scope and date range.
| Card | What it shows | Link to more detail |
|---|---|---|
| In current scope | The number of projects, and how many agents and models had invocations in the selected period. | See Operations |
| Activity | Agent runs, and the change from the previous period. | See Operations |
| Consumption | Tokens that agents used, and the change from the previous period. Direct model calls aren't counted. | See Operations |
| Estimated cost | Cost for the selected period from Azure Cost Management, and the change from the previous period. | See Cost |
| Assets with policy violations | The number of agents and models that are non-compliant with a policy assigned in the scope. | See Govern |
See Operations keeps the date range that you selected.
The Estimated cost card comes from Azure Cost Management, like the totals on the Cost page, so it appears 8 to 24 hours after usage. Activity and tokens appear within minutes, so a new spike in usage can show up on Fleet before its cost does. For more about the cost data, see Understand the cost data.
Find assets that need attention
The four lists below the cards rank the agents and models to review first.
| List | What it ranks | Link to more detail |
|---|---|---|
| Highest error incidents | Agents and models with the most error incidents. Each row shows the error rate and the number of incidents. | See Operations |
| Highest agent run latency | Agents whose runs take the longest, in seconds. | See Operations |
| Top cost increases | Agents and models whose cost grew the most from the previous period, as an amount and a percentage. | See Cost |
| Most policy violations | Agents and models with the most policy violations. | See Govern |
To investigate an agent or model, select its name.
Browse the assets in scope
Assets in this scope lists the projects, agents, and models in the selected scope, with usage and cost for each.
- Scroll to Assets in this scope.
- Select Projects, Agents, or Models. Each tab shows how many items it has.
- To find an item, enter part of its name in Search by name. To sort the table, select a column heading.
- Review the columns. On Projects, each row shows the project's Assets (agents and models), Invocations, Error incidents, Token usage, Cost, Cost trend, and Created by. To see which period a trend compares with, hover over its Cost trend value.
The Cost column shows each asset's cost for the selected period, and Cost trend shows the change from the previous period. New means that the asset had no cost in the previous period.
Troubleshoot
| Symptom | Cause | Fix |
|---|---|---|
| A card or list says that it couldn't be loaded, for example "Agent run latency could not be loaded. Check your access to the selected projects and monitoring metrics, then try again." | You don't have permission for that card, or the data couldn't be loaded. | Find the card in Permissions for each page, and ask an admin for a role that includes it. If you already have it, try again later. |
| The policy cards say "Policy violations couldn't be loaded." | You can't read Azure Policy compliance data for the scope, or the policy service didn't respond. | Ask an admin for a Foundry role or Reader on the subscription, or try again later. To review policies, open Govern. |
| Estimated cost is empty, or lower than the activity suggests. | Cost appears 8 to 24 hours after usage, so the most recent usage might not have a cost yet. | Check again later, or select a longer date range. |
| Cards and lists are empty. | There was no agent or model usage in the scope and date range. | Select a longer date range or a different scope. |
Related content
- To see the usage, errors, and latency behind the cards, see Monitor agent and model operations.
- To analyze spending across the subscription, see View subscription costs in the Foundry portal.
- To find the role for each card, see Permissions for cost data and cost controls.
- To review and fix policy violations, see Manage compliance and security.
- To monitor one project's agents in detail, see Monitor agents with the Agent Monitoring Dashboard.