Note
Access to this page requires authorization. You can try signing in or changing directories.
Access to this page requires authorization. You can try changing directories.
To see what Microsoft Foundry costs across an Azure subscription, go to Manage > Cost > Overview in the Foundry portal. The page shows spending for a date range, a month-end forecast, and the projects, agents, and models that cost the most. Platform admins and FinOps practitioners use it to spot cost changes and find what drives them.
All costs on this page come from Azure Cost Management, including the costs of projects, agents, and models. It's the same data that you see in the Azure portal, at the prices you pay, and it appears 8 to 24 hours after usage. Two other pages in Manage help explain a change: Fleet shows cost next to activity and health, and Operations shows the runs, requests, and tokens behind spending within minutes. To see costs for a single project, see View project, agent, and model costs.
Important
Items marked preview in this article are currently in preview. This preview is provided without a service-level agreement, and Microsoft doesn't recommend it for production workloads. Certain features might not be supported or might have constrained capabilities. For more information, see Supplemental Terms of Use for Microsoft Azure Previews.
Prerequisites
An Azure subscription with at least one Foundry resource and project that has model or agent usage.
Read access to the subscription that you want to view, through Reader or another role that includes it, such as Owner or Contributor. Without it, the page shows No access.
To see cost and the forecast, a role with Cost Management read access on the subscription that you view, such as Cost Management Reader or Reader. Owner and Contributor also include it. Foundry roles don't.
To see the Cost controls card, the permission to read cost controls, which all Foundry roles and Reader include.
For the permission behind each card, see Permissions for cost data and cost controls. To assign roles, see Assign Azure roles using the Azure portal.
Important
The Foundry RBAC roles were recently renamed. Foundry User, Foundry Owner, Foundry Account Owner, and Foundry Project Manager were previously named Azure AI User, Azure AI Owner, Azure AI Account Owner, and Azure AI Project Manager. You might still see the previous names in some places while the rename rolls out. The role IDs and core permissions are unchanged by the rename.
Open the Cost page
The Cost page has two tabs. Overview shows spending, and Cost Control lists the cost controls that alert on or block spending. This article covers the Overview tab. For cost controls, see Create and manage cost controls.
- Sign in to Microsoft Foundry. Make sure the New Foundry toggle is on. These steps refer to Foundry (new).

- Select Manage in the upper-right navigation.
- In the left pane, select Cost. The Overview tab opens.
- In Subscription, select the subscription that you want to view. The page shows one subscription at a time. To see costs across subscriptions, use cost analysis at a management group or billing scope in Azure Cost Management. For more information, see Understand and work with scopes.
- Optionally, to focus on part of the subscription, select resource groups in Resource group and projects in Project.
- Select a date range: Last Day, 7D, 1M, or 3M. To set custom dates, select the date range picker. A custom range can cover up to three months.
Read the summary cards
Four cards at the top of the Overview tab summarize spending for the scope and date range that you selected.
| Card | What it shows |
|---|---|
| Estimated cost | Cost for the selected range, and the change from the previous period of the same length. The title includes the range, for example Estimated cost · Last 7 days, compared with the previous 7 days. |
| Month-end forecast | The projected total for the current month, for example "Projected total for November." |
| Spend breakdown | How model cost splits between Agent cost, the model cost of agent requests, and Direct model cost, the rest of the model cost, such as direct calls to a model deployment. It shows amounts and percentages. Select the info icon next to each row for details. |
| Cost controls | How many of the cost controls that apply to the selected projects need attention. Each budget is checked over its current reset period, not the selected date range. To see them, select View cost controls. |
The Estimated cost card shows cost from Azure Cost Management. It's labeled estimated because current-month cost can still change until your invoice is final.
Analyze spend over time
Spend over time charts cost across the selected range and compares it with an earlier period. Use it to find the days when spend changed.
Below the summary cards, find Spend over time. The text under the title describes the comparison for the selected range.
Read the chart:
- With 7D, the chart compares each day this week with the same weekday last week. The legend labels this week with its dates, and it shows Same weekdays last week and Extra spend, which highlights spend above last week's level.
- With 1M, the chart shows cumulative month-to-date spend against the previous month.
To see the numbers, select Table. With 7D, the table shows Date, This week, Last week, and Difference for each day, plus a Week total.
Because cost arrives 8 to 24 hours after usage, the most recent day can look lower than it will be. Compare full days when you look for a change.
Find your highest-spend assets
The Highest spend assets list ranks the agents and model deployments that cost the most in the selected scope and date range. Start here to decide what to investigate first.
- Next to Spend over time, find Highest spend assets.
- Review each row: the Asset name and the project or Foundry resource that it belongs to, the Type, Agent or Model, and the Cost.
- To investigate an asset, select its name. The asset opens in its project, where you can see its cost over time and the model deployments it uses. For more information, see View project, agent, and model costs.
Break down costs by project, agent, or model
The cost table at the bottom of the page breaks down spending for the selected scope and period. Group it by project for chargeback or showback, or by agent or model to find what drives cost. You can also download the table.
Scroll to Cost by project.
In Group by, select Project, Agent, or Model. Each option shows its number of rows, and the table title changes to match, for example Cost by agent.
Review the table. Each row shows the item, its Share of the total, its change from the previous period, and its cost in your billing currency, for example Cost (USD). With 7D, the change column is Change vs last week. The Total row sums the table.
To download the table, select the download button (arrow icon) next to Group by, and then select Download CSV. The file uses the current filters, date range, and grouping.
The file includes up to 5,000 rows with the highest cost, plus a Total row that includes all costs for the grouping, even rows that aren't in the file.
Each grouping includes only the cost that's tagged with one of its items, and only for the projects, agents, and model deployments that still exist in the scope. For example, Cost by agent doesn't include direct model calls, and Cost by project doesn't include costs without a project tag. So a grouping's total can be lower than the Estimated cost card. For more information, see Understand the cost data.
Spot cost changes on Fleet
The Fleet overview page shows cost next to activity and health, so you can connect a cost change to the assets behind it. Its Estimated cost card also comes from Azure Cost Management.
In Manage, select Fleet in the left pane. The Fleet overview page opens.
Select the Subscription, and optionally the Resource group and Project. Then select a date range: Last Day, 7D, 1M, or 3M.
Review the Estimated cost card. It shows cost for the selected period and the change from the previous period. To open the Cost page, select See Cost.
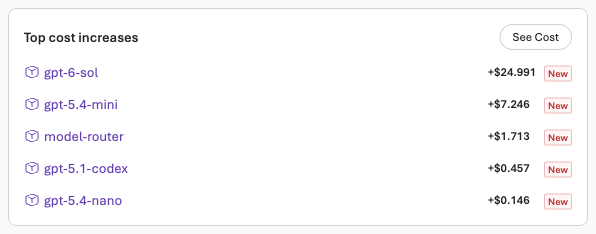
Review Top cost increases. Each row shows an asset, its cost increase, and its percent change, or New if the asset had no cost in the previous period.
Note
The costs shown in this image are examples only and don't reflect actual prices. For current prices, see Microsoft Foundry pricing.
In Assets in this scope, select Projects, Agents, or Models, and compare the Cost and Cost trend columns. To see which period a trend compares with, hover over its Cost trend value.
For the whole page, including activity, errors, latency, and policy violations, see Monitor your agent fleet.
Find the usage behind a cost change on Operations
The Operations page shows the usage behind spending: agent runs, model requests, tool calls, and tokens. It doesn't show cost. Usage appears within minutes, so Operations can show a change before its cost reaches the Cost page.
- In Manage, select Operations in the left pane. Select the same scope and date range that you used on the Cost page.
- In the chart, select Tokens to see token use over time for each asset. To see agent runs or model requests instead, select Invocations.
- Review Top invocations and Assets with invocations to find the agents and models whose usage changed.
For the whole page, including errors, latency, and agent quality, see Monitor agent and model operations.
Understand the cost data
Every cost on the Cost and Fleet pages comes from Azure Cost Management, including the costs of projects, agents, and model deployments. Keep these points in mind when you read them:
- Prices: Cost uses the prices you pay, including negotiated prices, before credits and taxes. It's the same data as cost analysis in the Azure portal.
- Timing: Cost appears 8 to 24 hours after usage. Current-month amounts are estimates, and they can change until your invoice is final.
- Project attribution: Cost reaches a project through the
projecttag, which Foundry adds to the usage of supported models. Costs without the tag, for example from models that don't support project-level cost attribution, aren't assigned to any project. For the supported models, see Allocate costs by project. - Agent and model attribution: Foundry tags model usage with its model deployment (
deployment) and, when an agent makes the call, the agent's name (agent.name). Billing data includes agent names starting in November 2026, so earlier agent usage counts as Direct model cost. Breakdowns by agent and model cover model cost only, and they list only the assets that still exist, so they can add up to less than the total. - Agents that use other Foundry resources: If an agent calls a model deployment in a different Foundry resource, those calls are billed to the other Foundry resource, and they aren't included in the agent's cost. To check their cost, view the model deployment's cost in the other Foundry resource.
- Provisioned throughput: The cost pages don't show reserved costs, such as Azure Reservations for provisioned throughput (PTU), and agent costs don't include model calls to provisioned deployments. To analyze provisioned throughput costs, use Azure Cost Management.
- Cost controls: Cost controls keep their own running total in real time, priced with a snapshot of your negotiated prices, and retail prices for models without one. During public preview, they aren't reconciled with your bill, so a cost control's spending can differ from the cost on this page. For details, see How cost controls price usage.
- Coverage: If you can't access cost data for some of the Foundry resources in the scope, the page says "Some project cost data is unavailable." Values then cover only the resources that you can access.
The filters at the top of the page apply to the data as follows:
| Filter | What it includes |
|---|---|
| Subscription | Foundry resources in the selected subscription. |
| Resource group | Foundry resources in the selected resource groups. |
| Project | Cost tagged with the selected projects, including their agent and model costs. Costs without a project tag are included only when all projects are selected. |
The Cost controls card follows the Project filter, but a shared budget counts usage across its full scope, including projects that you didn't select.
Troubleshoot
| Symptom | Cause | Fix |
|---|---|---|
| The page shows No access: "You don't have permission to view this cost overview. Ask your administrator for the Reader role on the selected subscription, or equivalent access." | You don't have read access to the selected subscription. | Ask an admin to assign Reader on the subscription, or another role in Prerequisites. After the assignment, select Refresh. |
| A card says "Card name could not be loaded. Check your access to the selected projects and monitoring metrics, then try again." | You don't have the permission that this card needs. Other cards still load. | Ask an admin for a role that includes the card's permission. See Permissions for each page. |
| A card or table says "Some project cost data is unavailable." | You don't have cost data access for some of the Foundry resources in the scope. | Treat the values as partial, not as zero. Ask an admin for a role with cost data, such as Cost Management Reader, that covers those resources. |
| Cost cards stay empty, even though you have the right role. | Your organization's billing account hides charges from people with Azure roles. | Ask your billing administrator to turn on cost visibility. See Check that your billing account shows charges. |
| A chart or table is empty, or recent spend looks lower than expected. | There was no usage in the range, or cost for the most recent usage hasn't arrived yet. Cost appears 8 to 24 hours after usage. | Check again later, or select a longer range. To see recent usage now, open Operations. |
| The page says "Cost control data is unavailable for N resources. Scan limit reached. Select fewer projects." | The Cost controls card stops checking after about 25 seconds, and it doesn't count the projects that it didn't reach. | Select fewer projects or resource groups. To see each cost control, open the Cost Control tab. |
| The page says "Total cost controls couldn't be loaded." | The cost control service didn't respond for some resources. | Try again later. To see each cost control, open the Cost Control tab. |
| A selected project shows less cost than expected, or none. | Cost reaches a project through the project tag. Costs without the tag aren't assigned to any project. |
Clear the Project filter to see all Foundry cost in the subscription, or analyze cost by resource. See Analyze Foundry costs in Azure Cost Management. |
| An agent's cost looks too low, or it's missing. | The agent calls a model deployment in a different Foundry resource, or the usage happened before billing data included agent names, in November 2026. | Check the cost of the model deployment that the agent calls. If it's in another Foundry resource, check it there. |
| Operations says "You need the Monitoring Reader permission to view these metrics." | You don't have permission to read usage metrics. | Ask an admin for a Foundry role or Monitoring Reader on the subscription, and then refresh the page. |
Related content
- To drill into one project's agents and model deployments, see View project, agent, and model costs.
- To alert on or block spending, see Create and manage cost controls.
- To reconcile cost, set Azure Cost Management budgets, or export data, see Analyze Foundry costs in Azure Cost Management.
- To find the role for each card, see Permissions for cost data and cost controls.
- To see every cost capability in one place, see Cost and FinOps in Microsoft Foundry.