Note
Access to this page requires authorization. You can try signing in or changing directories.
Access to this page requires authorization. You can try changing directories.
Important
Azure API for FHIR will be retired on September 30, 2026. Follow the migration strategies to transition to Azure Health Data Services FHIR® service by that date. Due to the retirement of Azure API for FHIR, new customer deployments won't be allowed beginning April 1, 2025. Azure Health Data Services FHIR service is the evolved version of Azure API for FHIR that enables customers to manage FHIR, DICOM, and MedTech services with integrations into other Azure services.
In this article, you learn how to enable diagnostic logging in Azure API for FHIR® and be able to review sample queries for these logs. Access to diagnostic logs is essential for any healthcare service where compliance with regulatory requirements (such as HIPAA) is a must. The feature in Azure API for FHIR that enables diagnostic logs is the Diagnostic settings in the Azure portal.
View and Download FHIR Metrics Data
You can view the metrics under Monitoring | Metrics from the portal. The metrics include Number of Requests, Average Latency, Number of Errors, Data Size, request units (RUs) Used, Number of requests that exceeded capacity, and Availability (in %). The Total Request Metrics provides the number of requests reaching the FHIR service. This means requests such as FHIR bundles are considered as single request for logging.
The following screenshot shows RUs used for a sample environment with few activities in the last seven days. You can download the data in JSON format.

Enable audit logs
To enable diagnostic logging in Azure API for FHIR, select your Azure API for FHIR service in the Azure portal
Navigate to Diagnostic settings
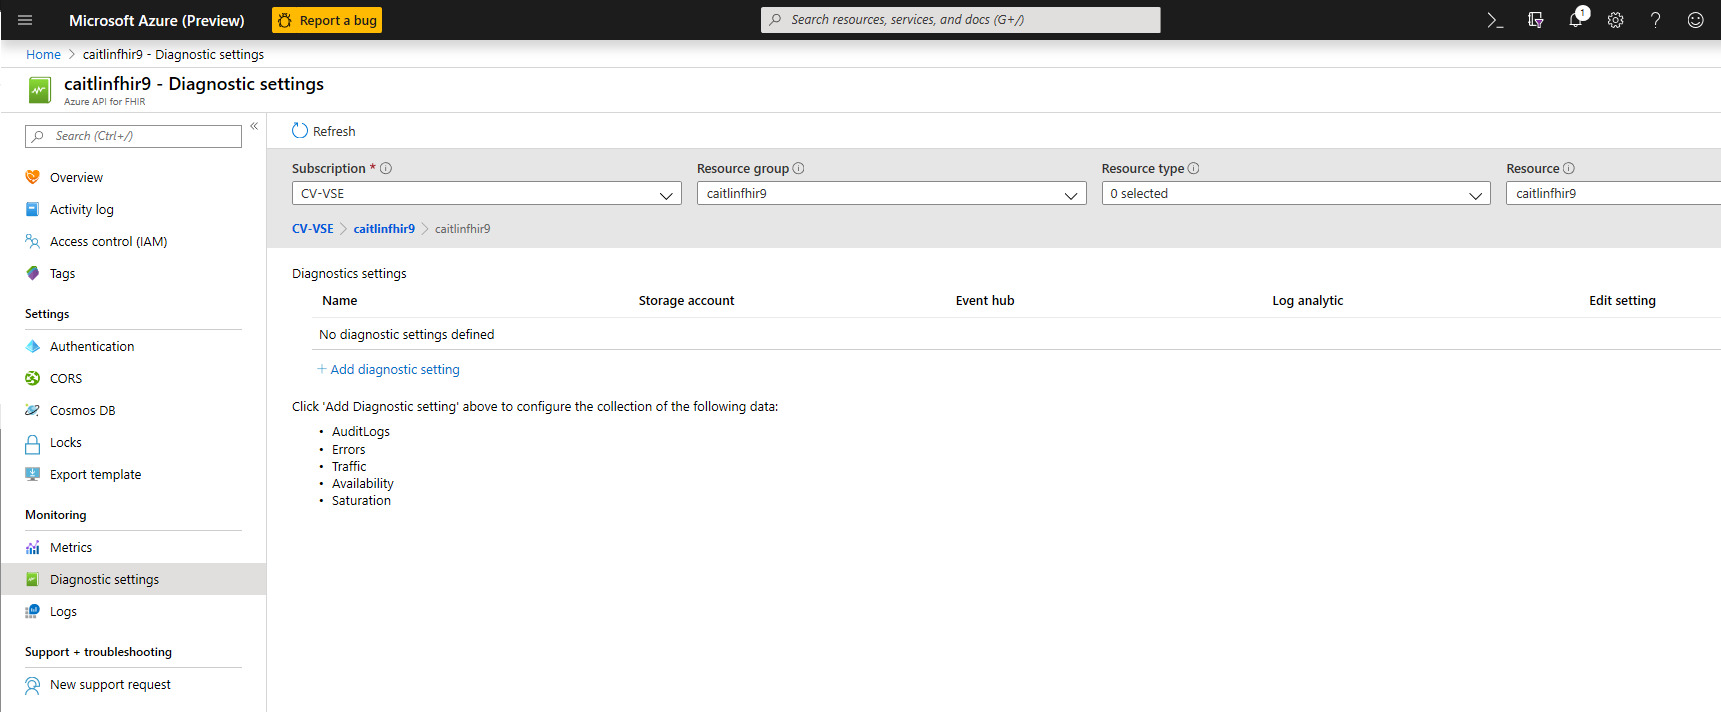
Select + Add diagnostic setting
Enter a name for the setting
Select the method you want to use to access your diagnostic logs:
- Archive to a storage account for auditing or manual inspection. The storage account you want to use needs to already be created.
- Stream to event hub for ingestion by a third-party service or custom analytic solution. You'll need to create an event hub namespace and event hub policy before you can configure this step.
- Stream to the Log Analytics workspace in Azure Monitor. You need to create your Logs Analytics Workspace before you can select this option.
Select AuditLogs and/or AllMetrics. The metrics include service name, availability, data size, total latency, total requests, total errors, and timestamp. Find more detail on supported metrics.
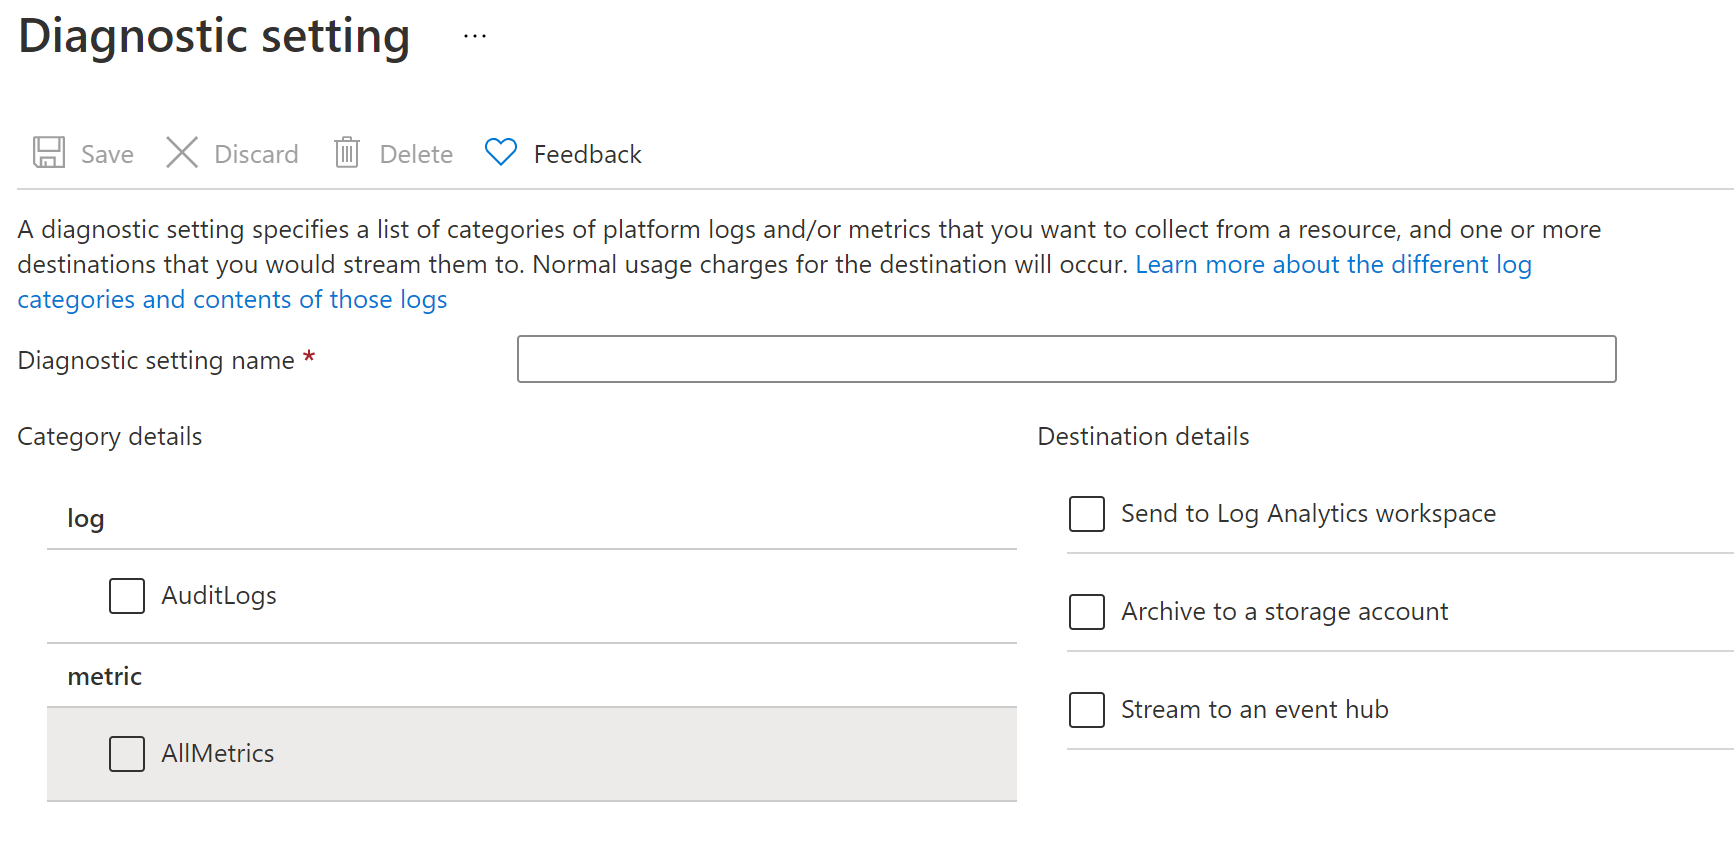
Select Save


Note
It might take up to 15 minutes for the first Logs to show in Log Analytics. Also, if Azure API for FHIR is moved from one resource group or subscription to another, update the setting once the move is complete.
For more information on how to work with diagnostic logs, refer to the Azure Resource Log documentation.
Audit log details
At this time, the Azure API for FHIR service returns the following fields in the audit log.
| Field Name | Type | Notes |
|---|---|---|
| CallerIdentity | Dynamic | A generic property bag containing identity information |
| CallerIdentityIssuer | String | Issuer |
| CallerIdentityObjectId | String | Object_Id |
| CallerIPAddress | String | The caller’s IP address |
| CorrelationId | String | Correlation ID |
| FhirResourceType | String | The resource type for which the operation was executed |
| LogCategory | String | The log category (currently returning ‘AuditLogs’ LogCategory) |
| Location | String | The location of the server that processed the request (for example, South Central US) |
| OperationDuration | Int | The time it took to complete this request in seconds. Note : This value is always set to 0, due to a known issue |
| OperationName | String | Describes the type of operation (for example, update, search-type) |
| RequestUri | String | The request URI |
| ResultType | String | The available values currently are Started, Succeeded, or Failed |
| StatusCode | Int | The HTTP status code. (for example, 200) |
| TimeGenerated | DateTime | Date and time of the event |
| Properties | String | Describes the properties of the fhirResourceType |
| SourceSystem | String | Source System (always Azure in this case) |
| TenantId | String | Tenant ID |
| Type | String | Type of log (always MicrosoftHealthcareApisAuditLog in this case) |
| _ResourceId | String | Details about the resource |
Sample queries
Here are a few basic Application Insights queries you can use to explore your log data.
Run the following query to see the 100 most recent logs.
MicrosoftHealthcareApisAuditLogs
| limit 100
Run the following query to group operations by FHIR Resource Type.
MicrosoftHealthcareApisAuditLogs
| summarize count() by FhirResourceType
Run the following query to get all the failed results.
MicrosoftHealthcareApisAuditLogs
| where ResultType == "Failed"
Conclusion
Having access to diagnostic logs is essential for monitoring a service and providing compliance reports. Azure API for FHIR allows you to take these actions through diagnostic logs.
Next steps
In this article, you learned how to enable Audit Logs for Azure API for FHIR. For information about Azure API for FHIR configuration settings, see
Note
FHIR® is a registered trademark of HL7 and is used with the permission of HL7.