Monitor performance metrics for the MedTech service
Gain insights into the health, availability, latency, traffic, and errors of your organization's MedTech services by monitoring MedTech service metrics in the Azure portal. To help you identify patterns or trends, pin tiles for the metrics to an Azure portal dashboard for easy access and visualization.
Configure service metrics
In the Azure portal, go to the Azure Health Data Services workspace. Go to Services > MedTech service.
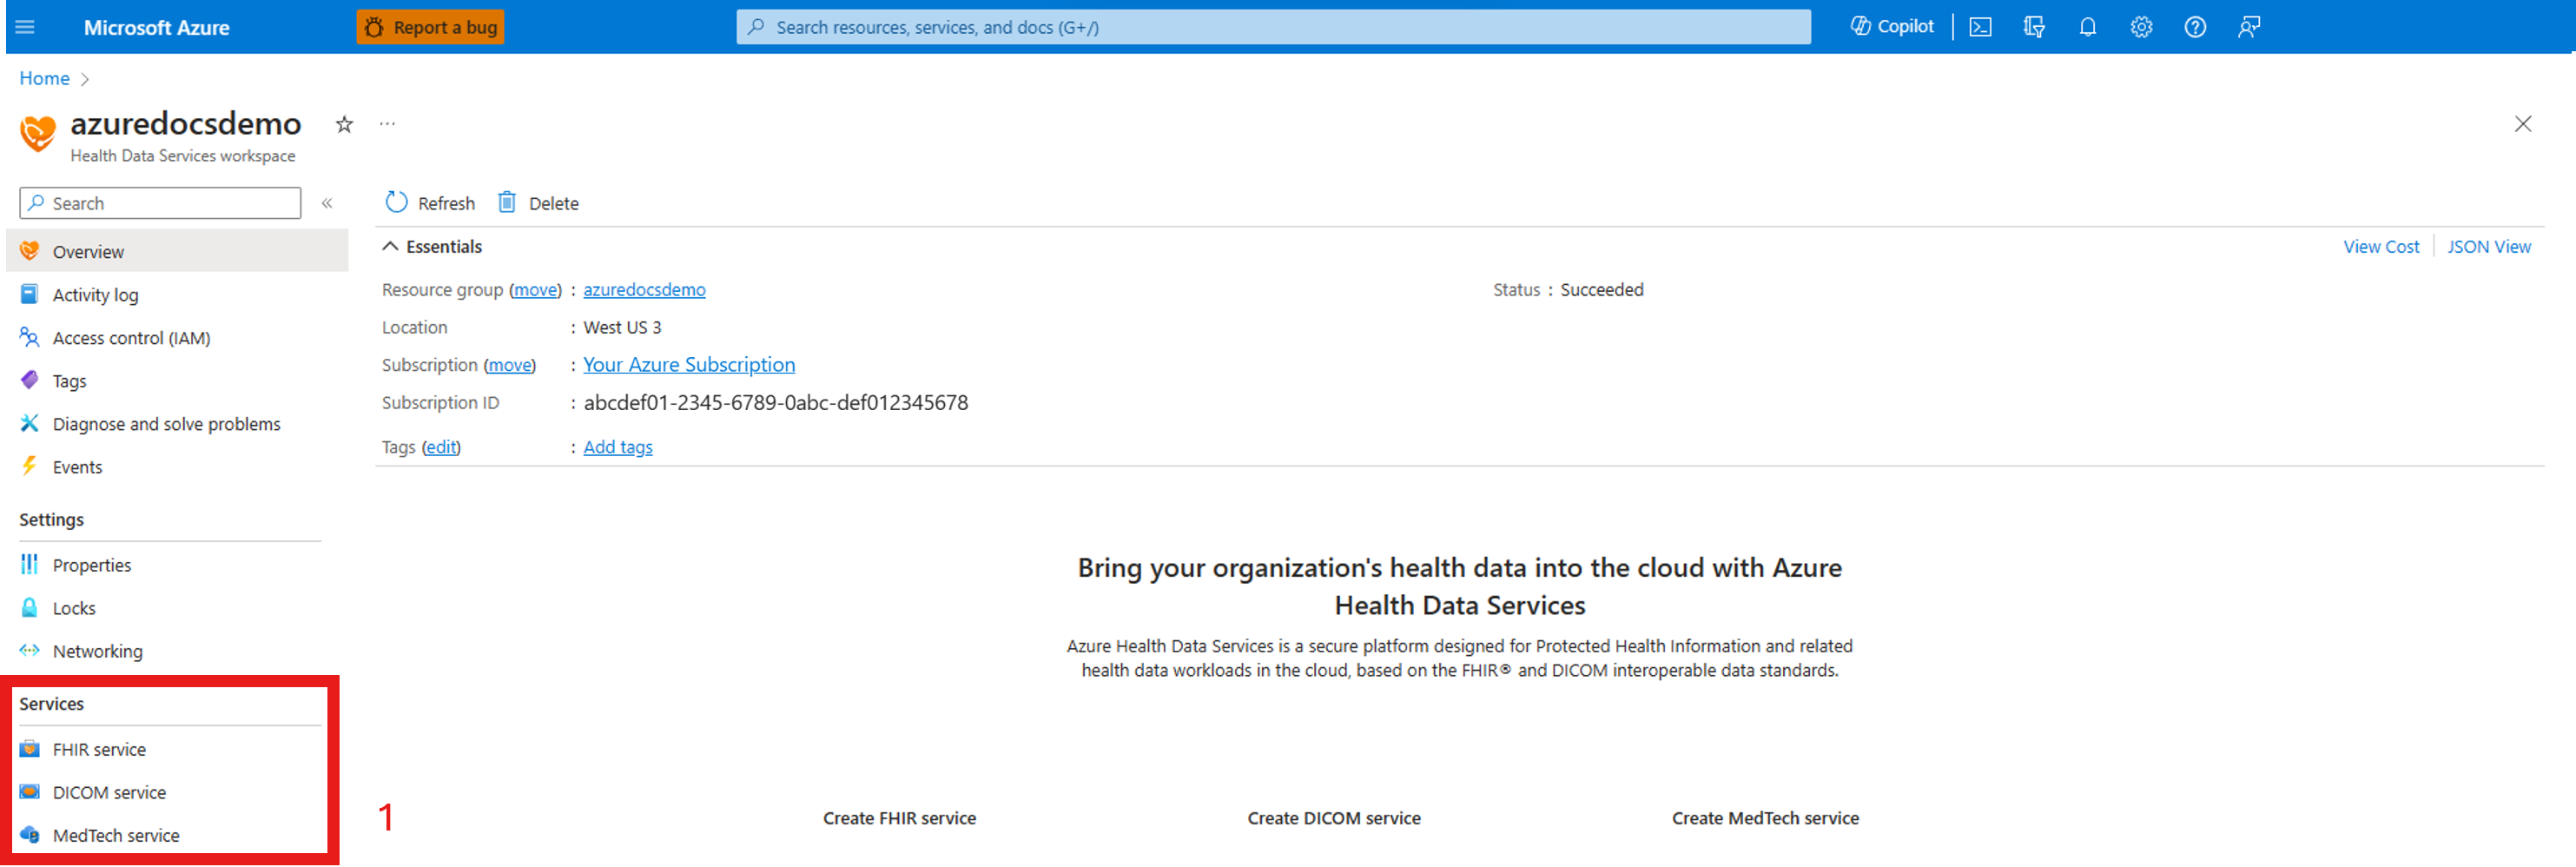
Select the MedTech service that you want to monitor metrics for. In this example, the MedTech service is named mt-azuredocsdemo.

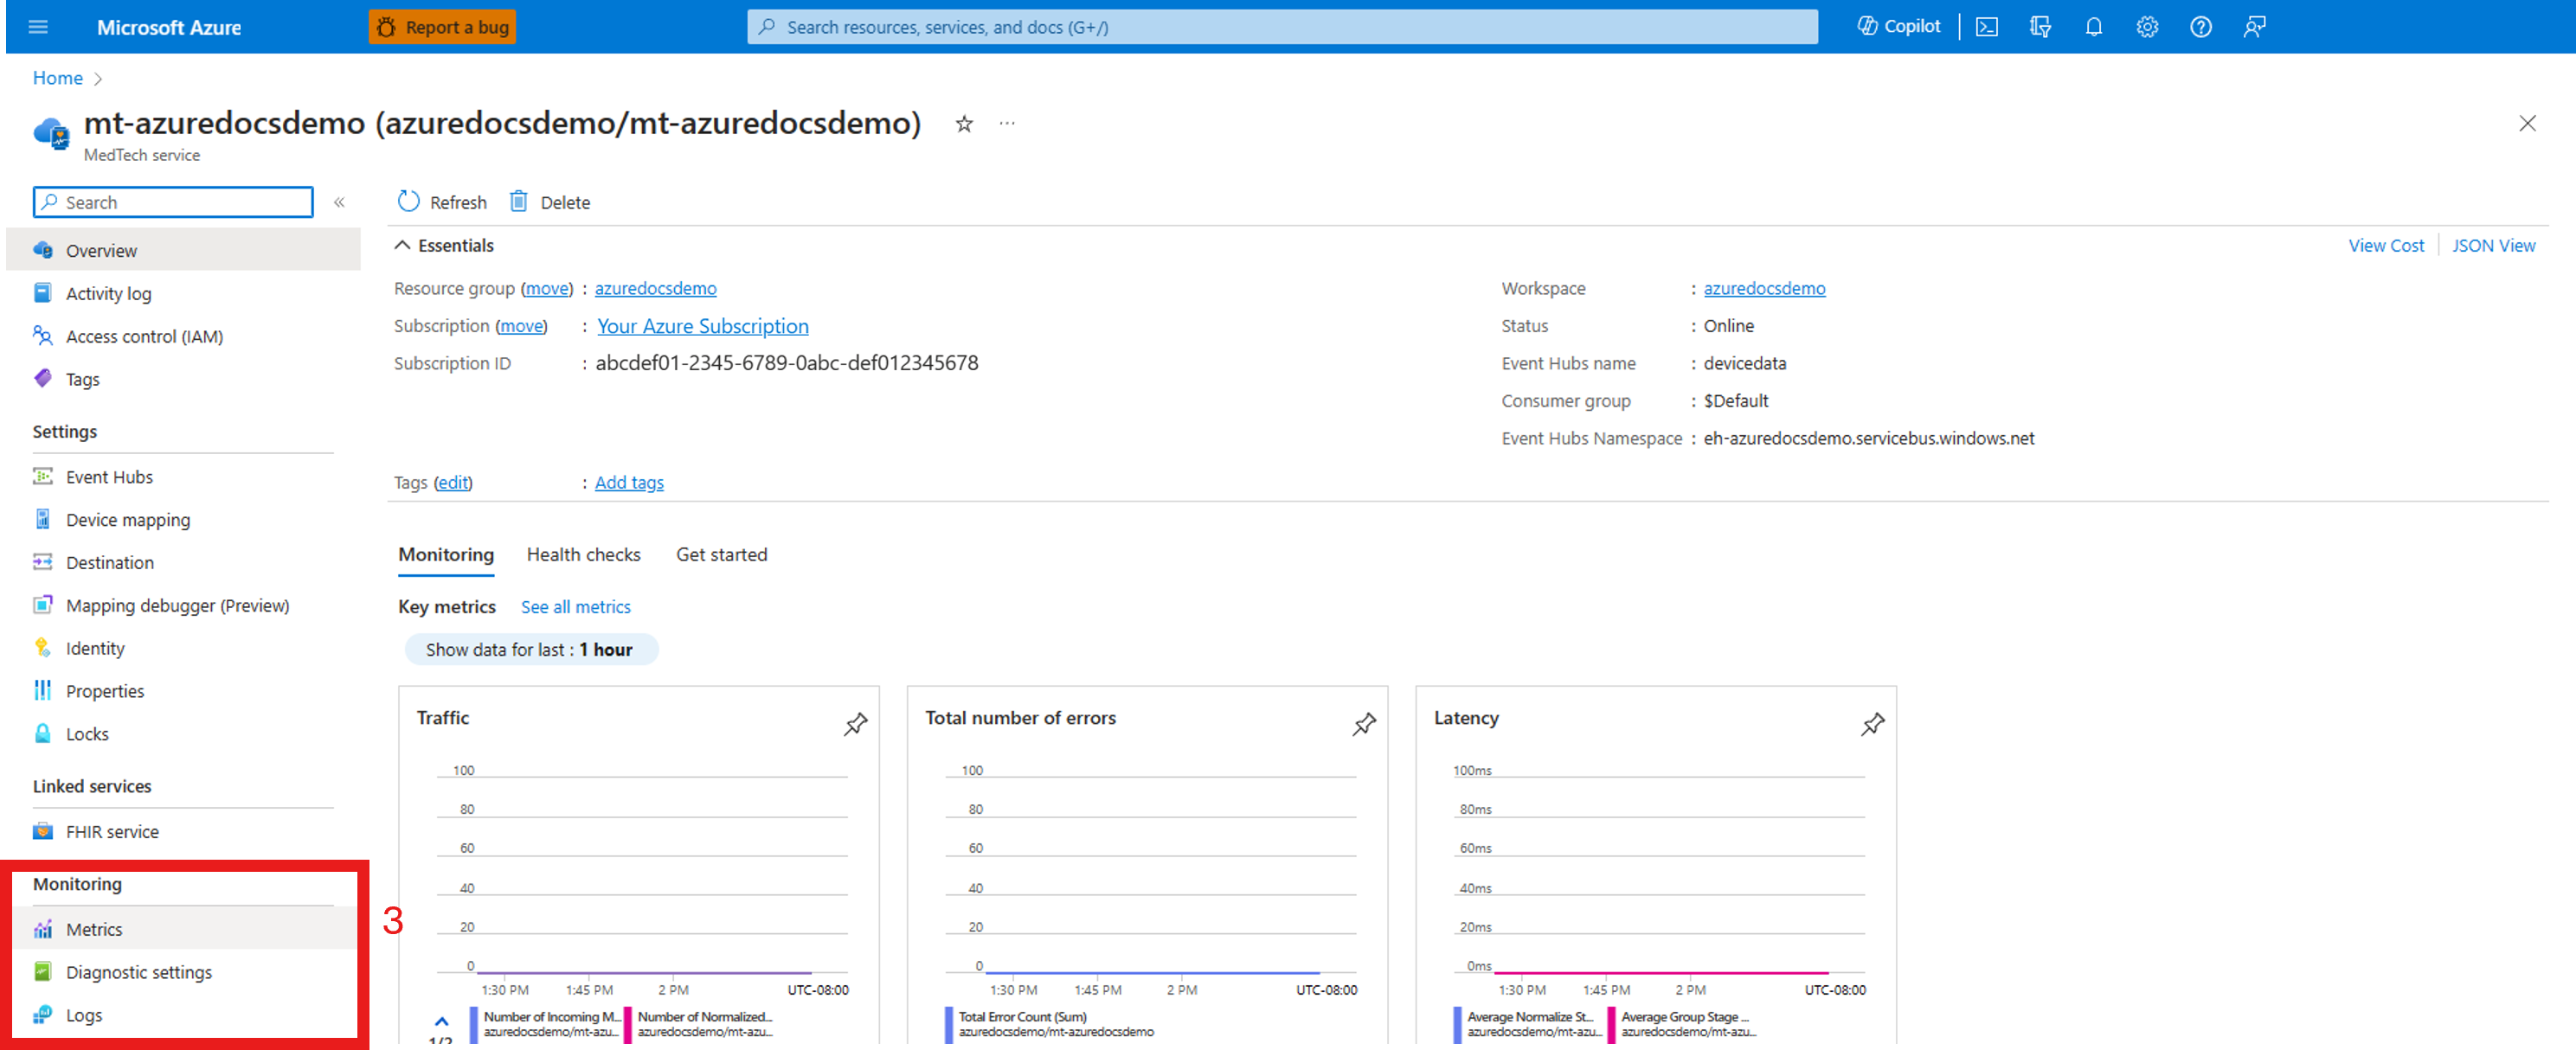
In the left pane, select Monitoring > Metrics.
Choose Add metric.
Select a metric from the drop-down list.
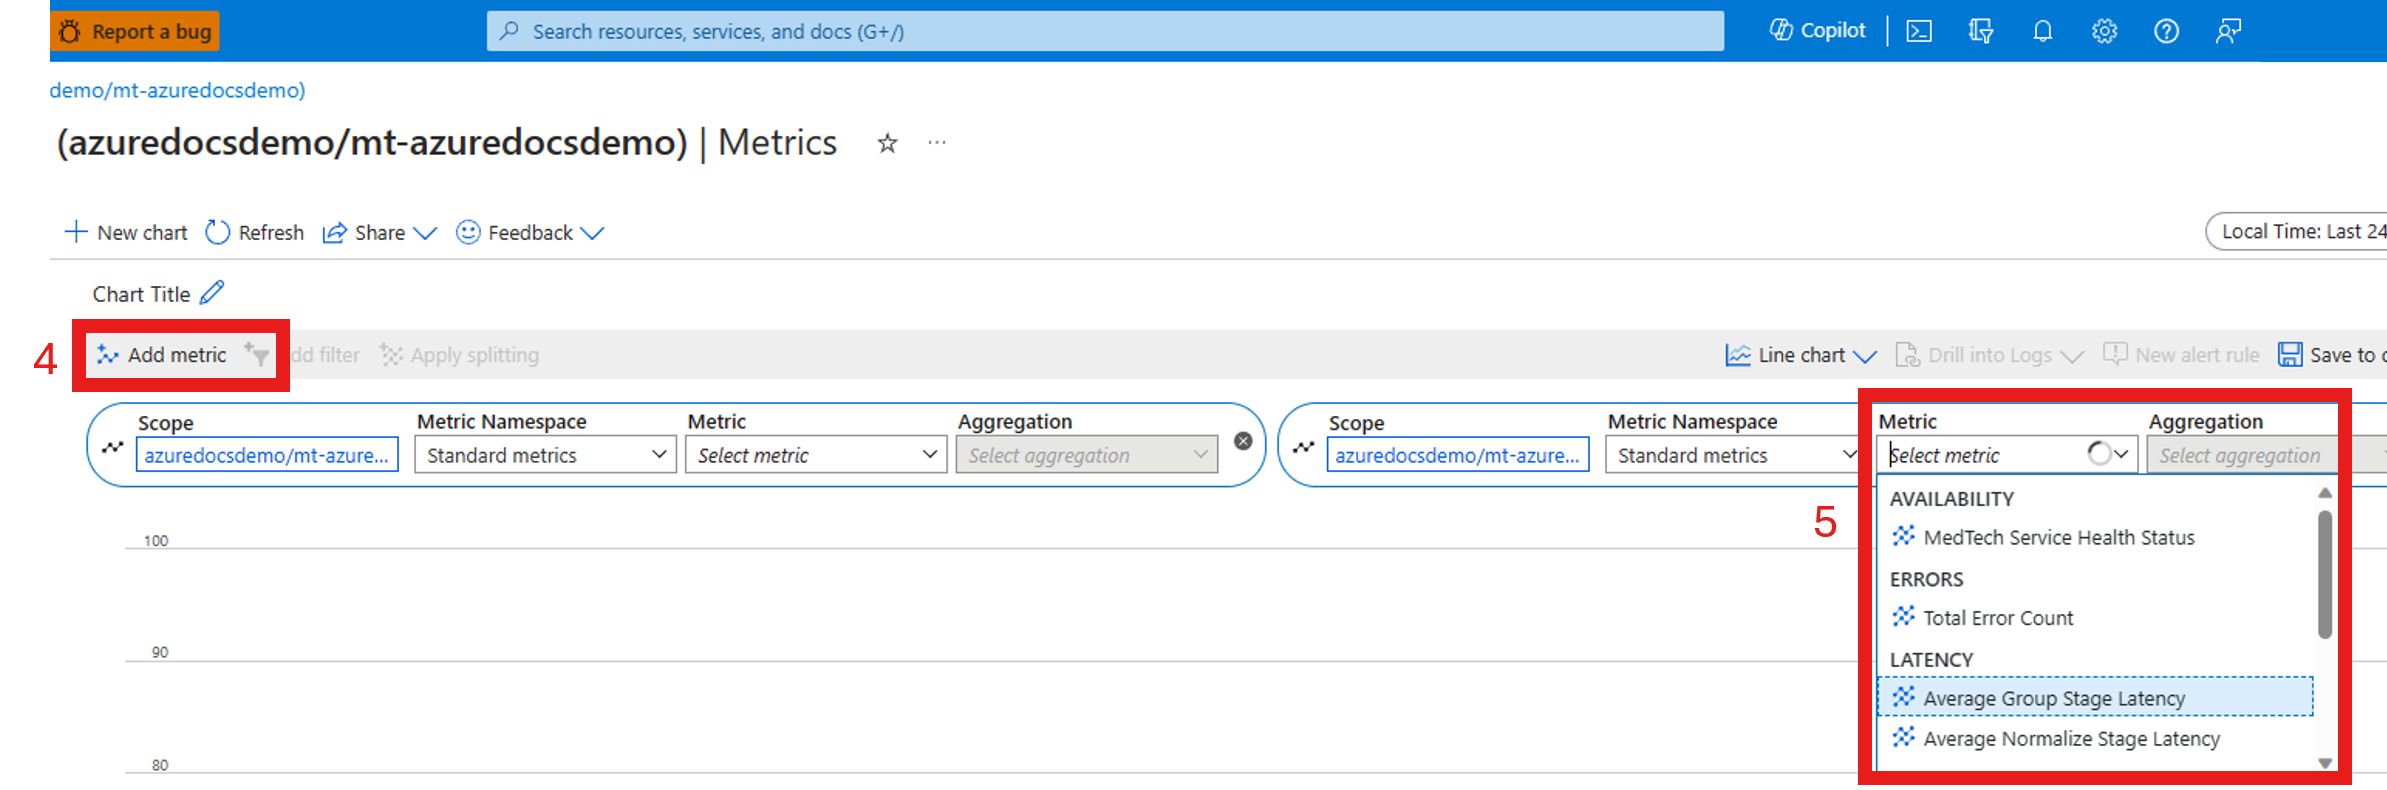


The service performance metrics you can monitor are:
| Metric category | Metric name | Metric description |
|---|---|---|
| Availability | IotConnector Health Status | The overall health of the MedTech service. |
| Errors | Total Error Count | The total number of errors. |
| Latency | Average Group Stage Latency | The average latency of the group stage. The group stage performs buffering, aggregating, and grouping on normalized messages. |
| Latency | Average Normalize Stage Latency | The average latency of the normalized stage. The normalized stage performs normalization on raw incoming messages. |
| Traffic | Number of FHIR resources saved | The total number of FHIR® resources updated or persisted by the MedTech service. |
| Traffic | Number of Incoming Messages | The number of received raw incoming messages (for example, the device events) from the configured source event hub. |
| Traffic | Number of Measurements | The number of normalized value readings received by the FHIR transformation stage of the MedTech service. |
| Traffic | Number of Message Groups | The number of groups that have messages aggregated in the designated time window. |
| Traffic | Number of Normalized Messages | The number of normalized messages. |
The screenshot shows an example of a line chart that monitors the Number of Incoming Messages.

Save metrics as a tile on an Azure dashboard
To keep your MedTech service metrics settings and view the metrics again later, pin them as a tile on an Azure dashboard. For steps, see Create a dashboard in the Azure portal.
To learn more about advanced metrics display and sharing options, see Analyze metrics with Azure Monitor metrics explorer.
Next steps
Enable diagnostic settings for the MedTech service
Note
FHIR® is a registered trademark of HL7 and is used with the permission of HL7.
Feedback
Coming soon: Throughout 2024 we will be phasing out GitHub Issues as the feedback mechanism for content and replacing it with a new feedback system. For more information see: https://aka.ms/ContentUserFeedback.
Submit and view feedback for