Note
Access to this page requires authorization. You can try signing in or changing directories.
Access to this page requires authorization. You can try changing directories.
Important
The deprecation of the MedTech service was initiated 3 May 2025. If using a MedTech service is no longer a priority, deprovision your instance, which can be found here. Support for active instances in the following regions will end 3 May 2028: West US2, UK South, West Europe, East US, Australia East, East US 2, Central India, North Europe. The Open Source version of the MedTech service can be found here.
Important
This capability is currently available for Public Preview and is subject to change. For more information, see Supplemental Terms of Use for Microsoft Azure Previews.
In this article, learn how to use the MedTech service Mapping debugger. The Mapping debugger is a self-service tool that is used for creating, updating, and troubleshooting the MedTech service device and FHIR® destination mappings. The Mapping debugger enables you to easily view and make inline adjustments in real-time, without ever having to leave the Azure portal. The Mapping debugger can also be used for uploading test device messages to see how they'll look after being processed into normalized messages and transformed into FHIR Observations.
Tip
To learn about how the MedTech service transforms and persists device message data into the FHIR service see, Overview of the MedTech service device data processing stages.
The following video presents an overview of the Mapping debugger:
Overview of the Mapping debugger
To access the MedTech service's Mapping debugger, select Mapping debugger within your MedTech service on the Azure portal. For this article, we're using a MedTech service named mt-azuredocsdemo. Select your own MedTech service. From this screen, we can see the Mapping debugger is presenting the device and FHIR destination mappings associated with this MedTech service and provides a Validation of those mappings.
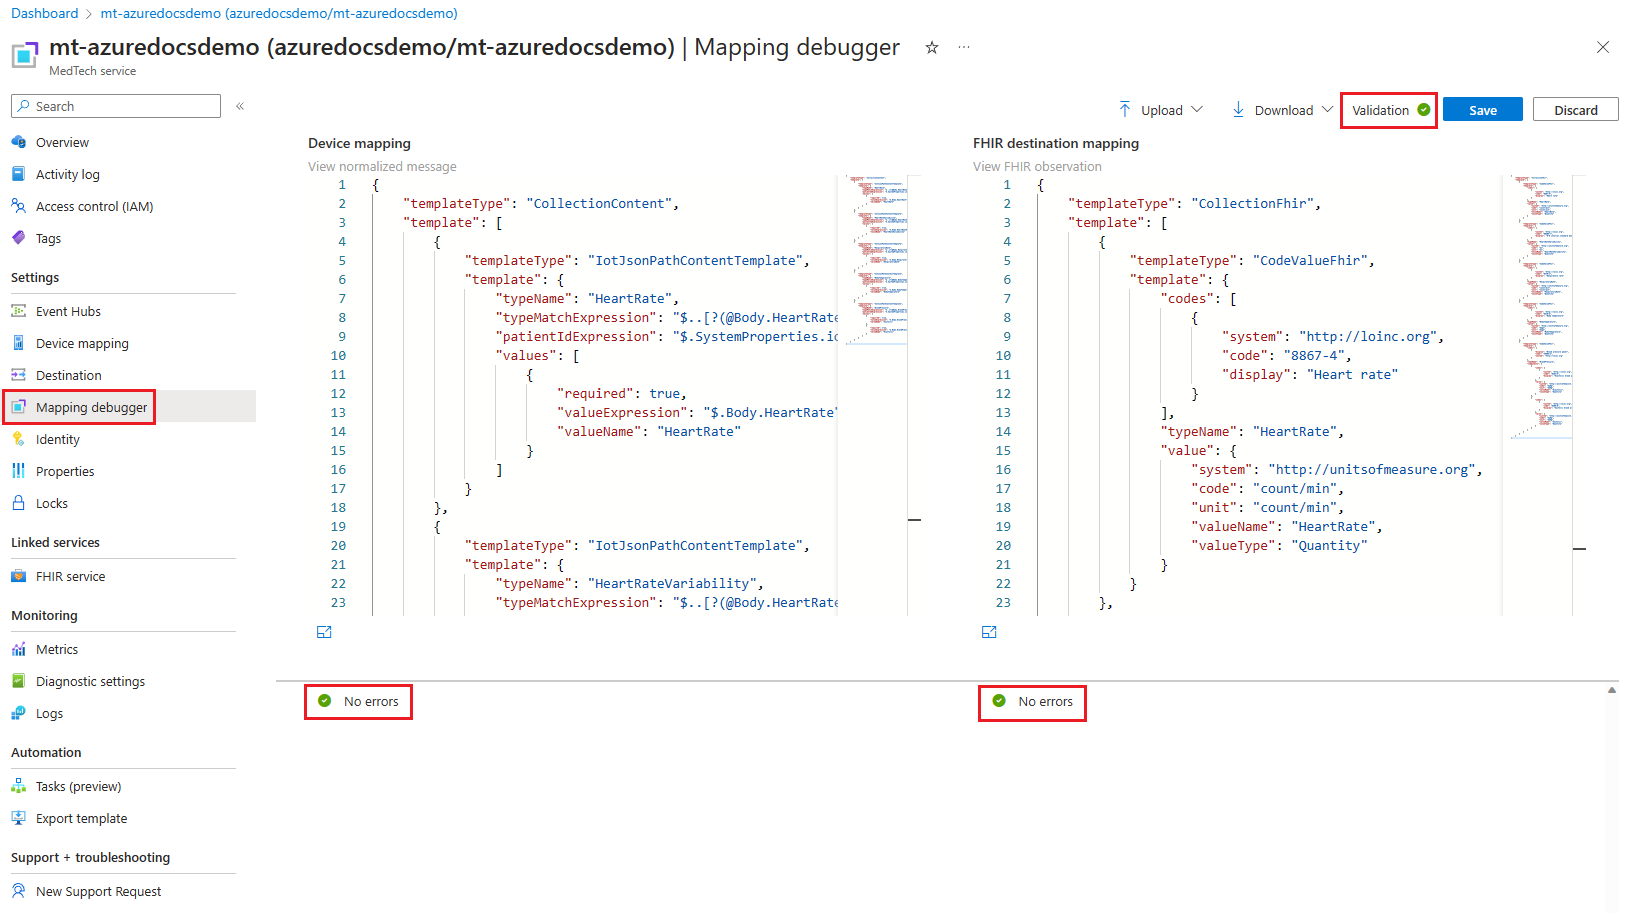
The Mapping debugger provides convenient features to help make the management, editing, and troubleshooting of device and FHIR destination mappings easier.
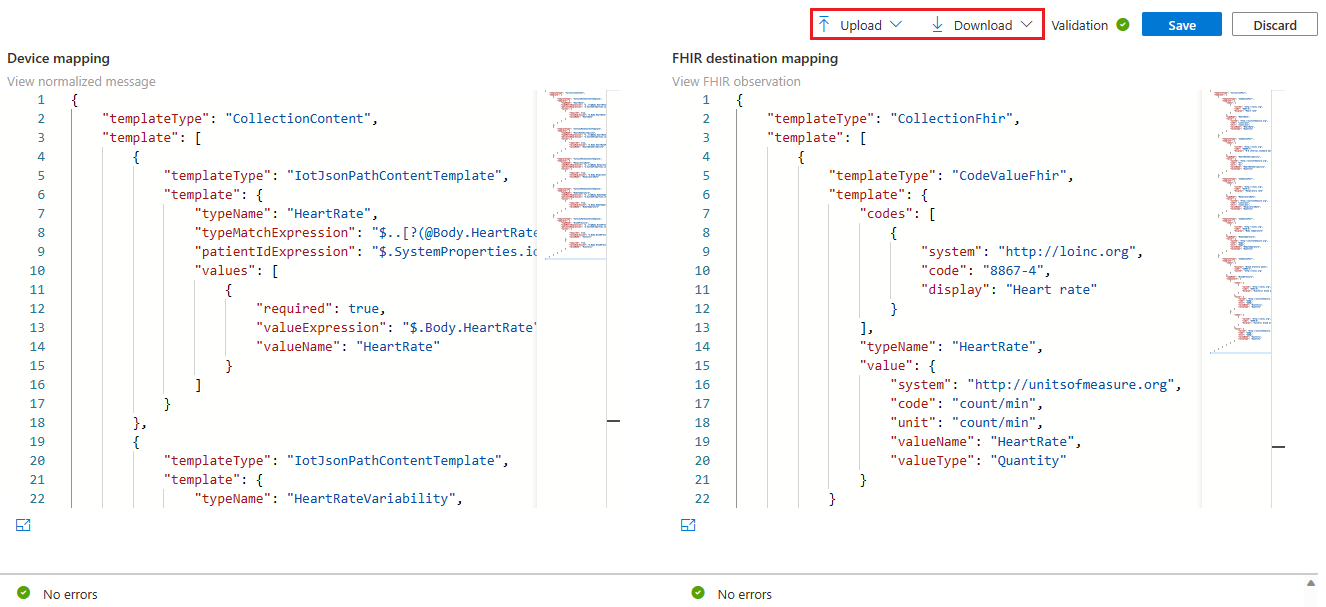
Upload - With this selection, you can upload:
- Device mapping: Can be edited and saved (optional) to the MedTech service.
- FHIR destination mapping: Can be edited and saved (optional) to the MedTech service.
- Test device message: Used by the validation service to produce a sample normalized measurement and FHIR Observation based on the supplied mappings.
Download - With this selection you can download copies of:
- Device mapping: The device mapping currently used by your MedTech service.
- FHIR destination mapping: The FHIR destination mapping currently used by your MedTech service.
- Mappings: Both mappings currently used by your MedTech service


How to troubleshoot the device and FHIR destination mappings using the Mapping debugger
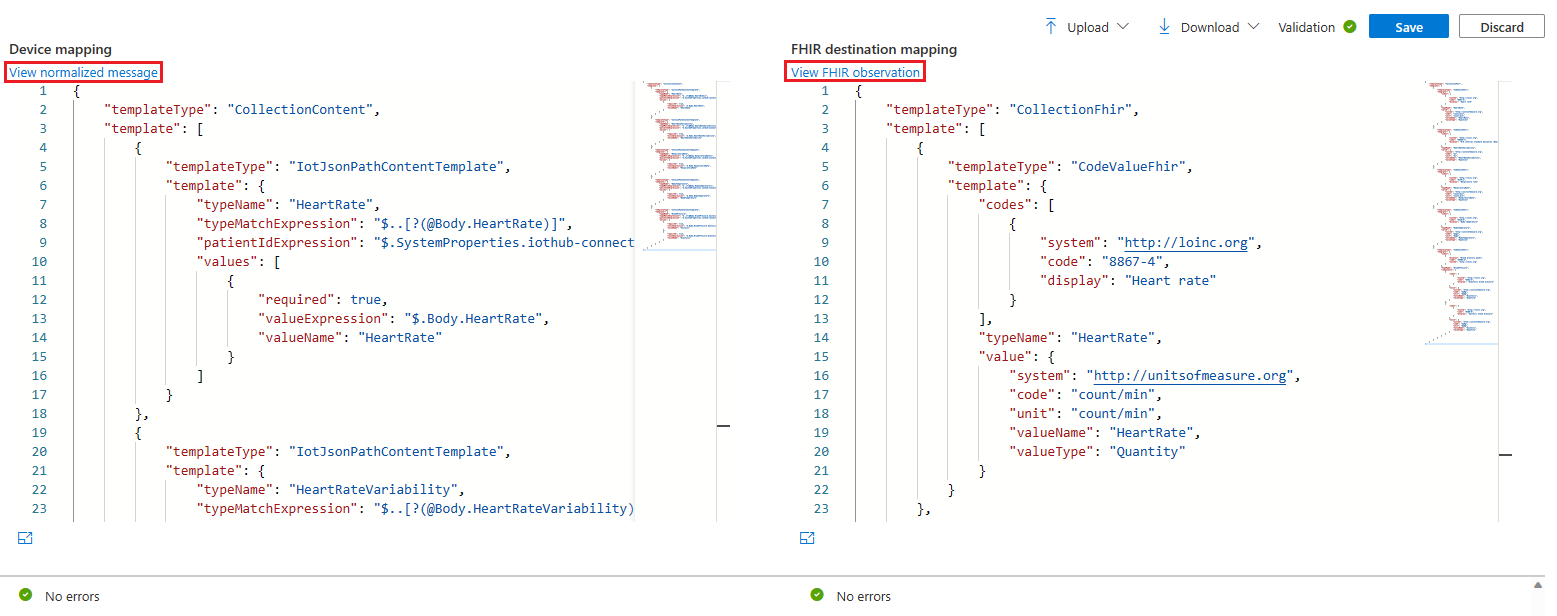
For this troubleshooting example, we're using a test device message that is message routed through an Azure IoT Hub and a device mapping that uses IotJsonPathContent templates.
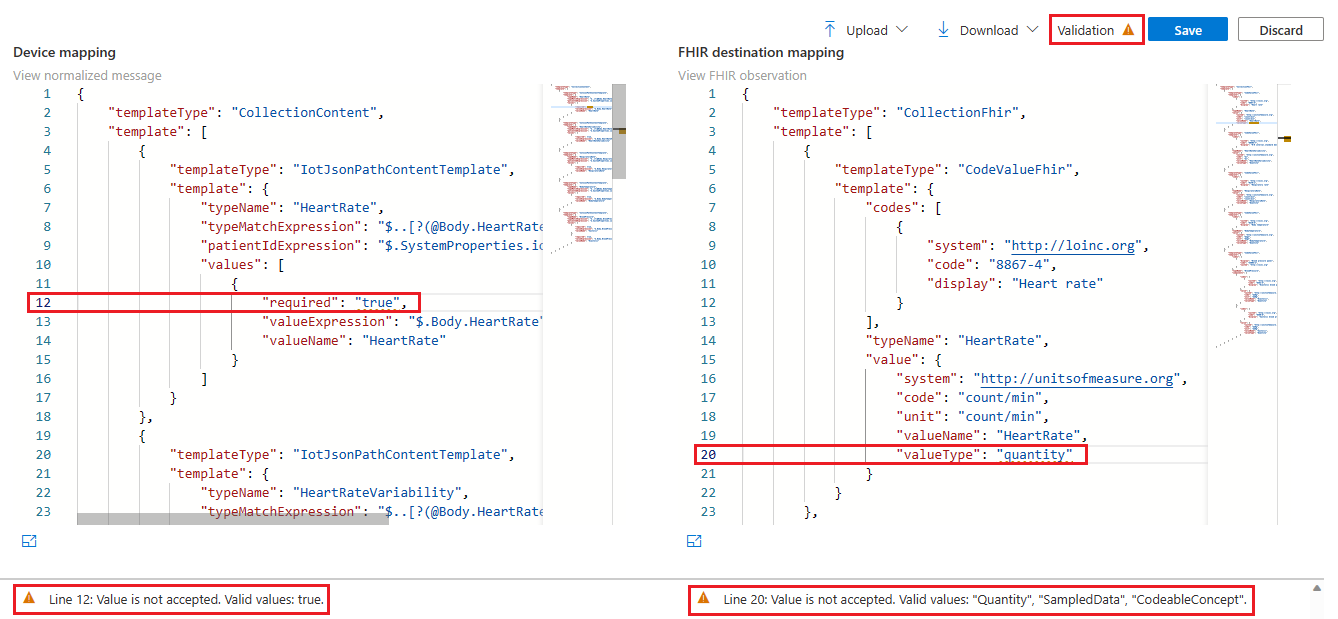
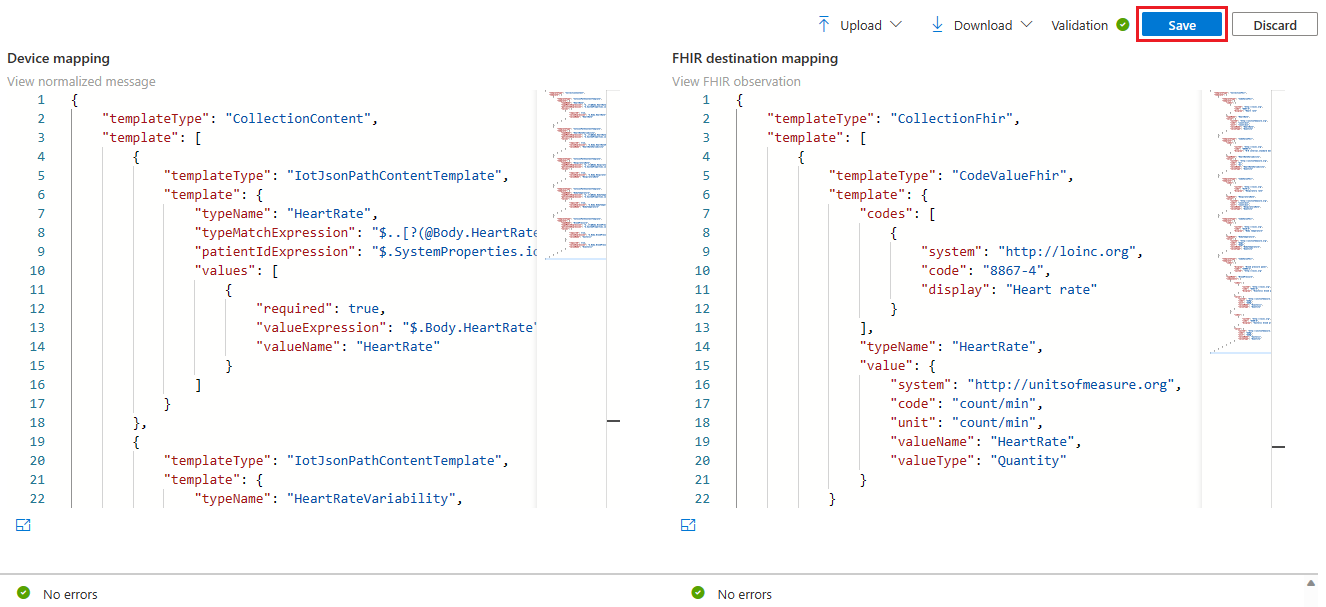
If there are errors with the device or FHIR destination mappings, the Mapping debugger displays the issues. In this example, we can see that there are error warnings at Line 12 in the Device mapping and at Line 20 in the FHIR destination mapping.
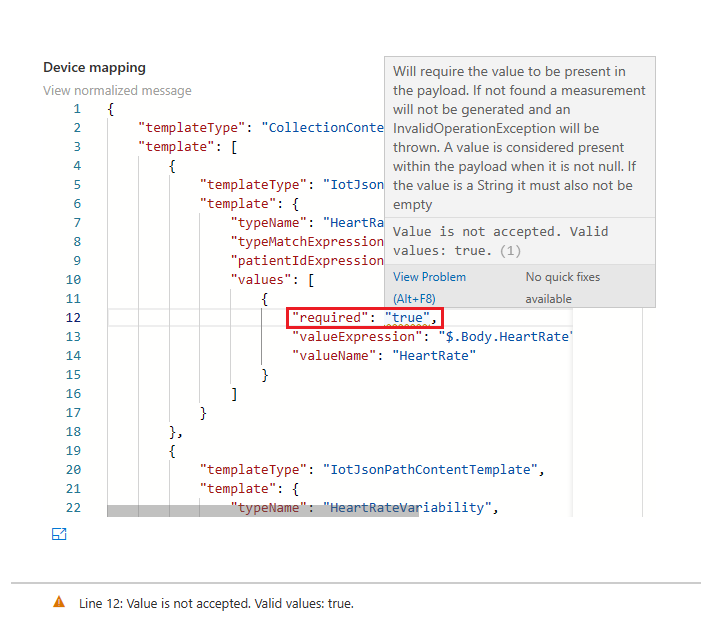
If you place your mouse cursor over an error warning, the Mapping debugger provides you with more error information.
We use the suggestions provided by the Mapping debugger, and the error warnings are now fixed. We're ready to select Save to commit our updated device and FHIR destination mappings to the MedTech service.
Note
The MedTech service only saves the mappings that have been changed/updated. For example: If you only made a change to the device mapping, only those changes are saved to your MedTech service and no changes would be saved to the FHIR destination mapping. This is by design and to help with performance of the MedTech service.
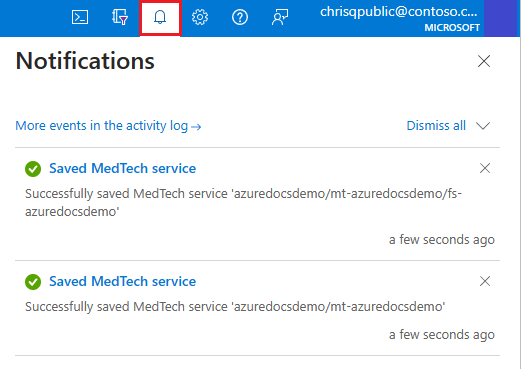
Once the device and FHIR destination mappings are successfully saved, a confirmation from Notifications is created within the Azure portal.


View a normalized message and FHIR Observation
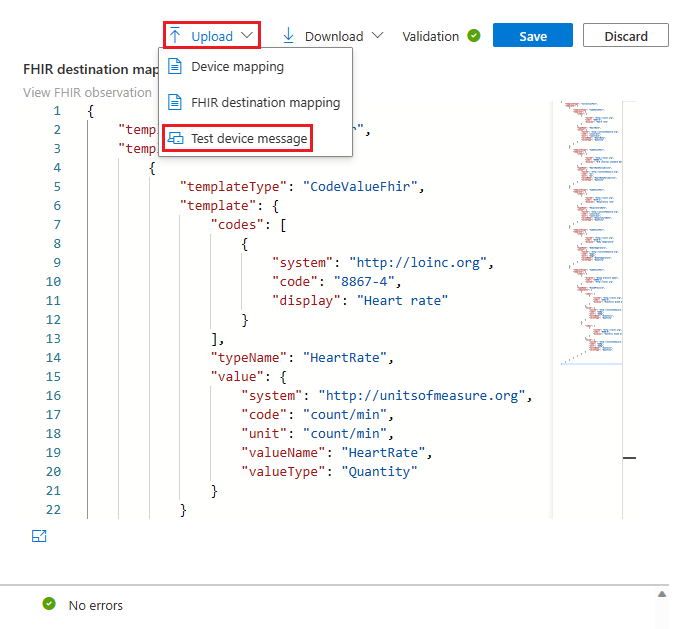
The Mapping debugger gives you the ability to view sample outputs of the normalization and FHIR transformation stages by supplying a test device message. Select Upload and Test device message.
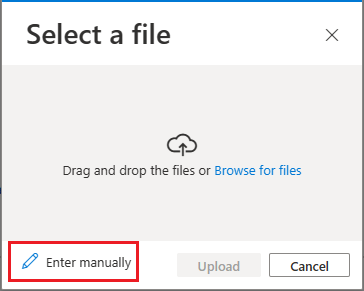
The Select a file box opens. For this example, select Enter manually.
Copy/paste or type the test device message into the Upload test device message box. The Validation box can still be red if the either of the mappings has an error/warning. As long as No errors is green, the test device message is valid with the provided device and FHIR destination mappings.
Note
The Mapping debugger also displays enrichments performed on the test device message if it has been messaged routed from an Azure IoT Hub (for example: the addition of the Body, Properties, and SystemProperties elements).
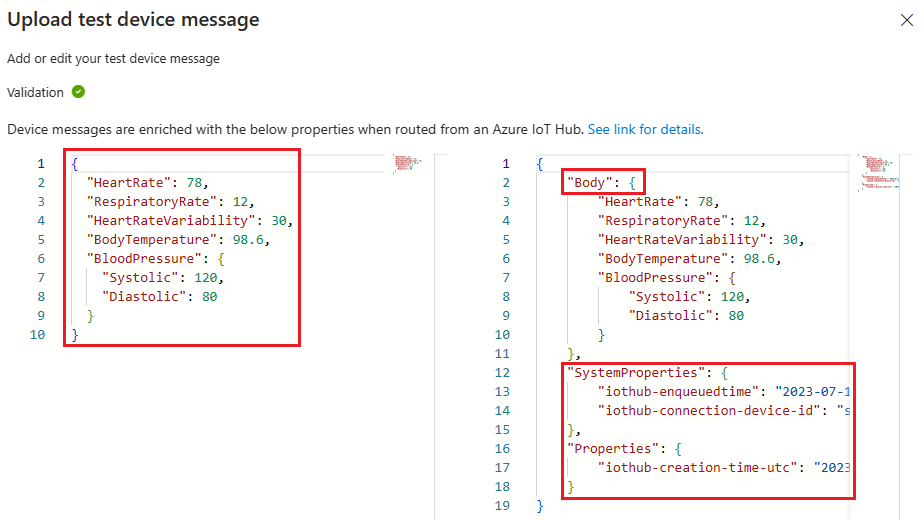
Select the X in the right corner to close the Upload test device message box.
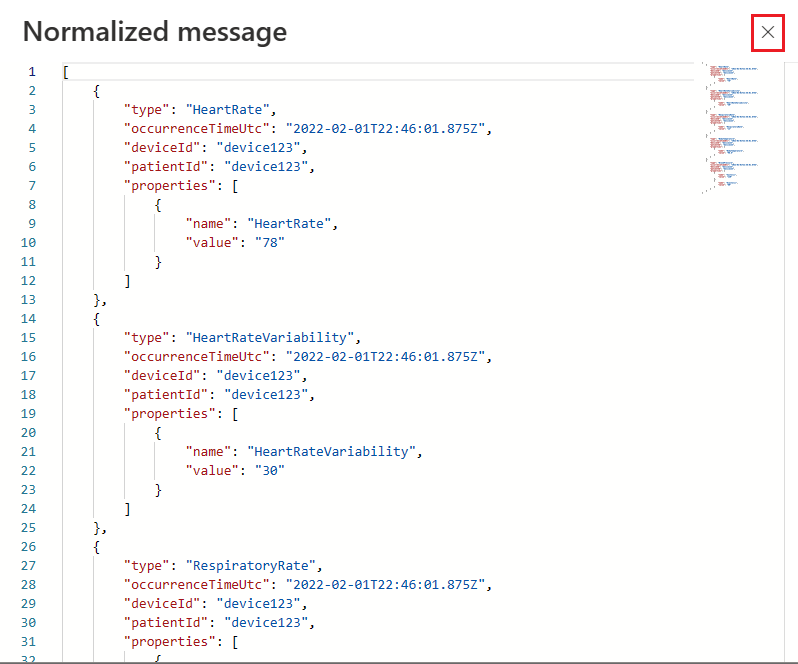
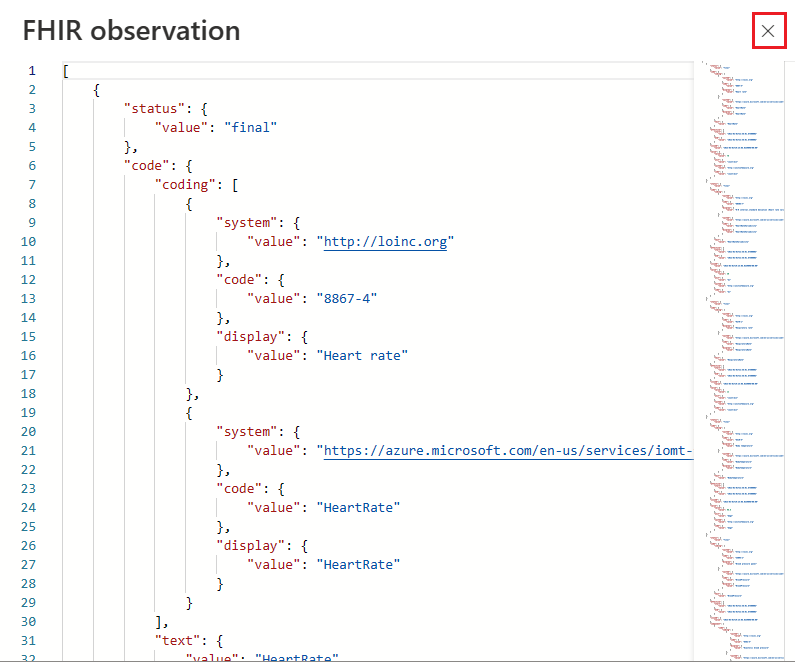
Once a valid test device message is uploaded, the View normalized message and View FHIR observation buttons become available so that you can view the sample outputs of the normalization and FHIR transformation stages. These sample outputs can be used to validate your device and FHIR destination mappings are properly configured for processing device messages according to your requirements.
Use the X in the corner to close the Normalized message and FHIR observation boxes.


Next steps
Overview of the MedTech service device mapping
Overview of the MedTech service FHIR destination mapping
Overview of the MedTech service scenario-based mappings samples
Note
FHIR® is a registered trademark of HL7 and is used with the permission of HL7.