Troubleshoot Azure FarmBeats
This article provides solutions to common Azure FarmBeats issues. For extra help, contact our Q&A Support Forum.
Important
Azure FarmBeats is retired. You can see the public announcement here.
We have built a new agriculture focused service, it's name is Azure Data Manager for Agriculture and it's now available as a preview service. For more information, see public documentation here or write to us at madma@microsoft.com.
Install issues
If you're restarting the install because of an error, ensure to delete the Resource Group or delete all resources from the Resource Group before retriggering the installation.
Invalid Sentinel credentials
The Sentinel credentials provided during install are incorrect. Restart the installation with the correct credentials.
The regional account quota of Batch Accounts for the specified subscription is reached
Increase the quota, or delete the unused batch accounts and restart the installation.
Invalid resource group location
Ensure the Resource Group is in the same location as the Region specified during installation.
Other install issues
Contact us with the following details:
Your Subscription ID
Resource Group name
Follow the below steps to attach the log file for the Deployment failure:
Navigate to the Resource Group in the Azure portal.
Select Deployments under Settings section on the left hand side.
For every deployment that shows Failed, select through to the details and download the deployment details. Attach this file to the mail.
Sensor telemetry
Can't view telemetry data
Symptom: Devices or sensors are deployed, and device partner is linked to FarmBeats, but you can't get or view telemetry data on FarmBeats.
Corrective action
Go to your FarmBeats resource group.
Select the Event Hub namespace ("sensor-partner-eh-namespace-xxxx"), select on "Event Hubs" and then check for the number of incoming messages in the event hub that is assigned to the partner
Do either of the following steps:
- If there are no incoming messages, contact your device partner.
- If there are incoming messages, contact us with your Datahub and Accelerator logs and captured telemetry.
To understand how to download logs, go to the "Collect logs manually" section.
Can't view telemetry data after ingesting historical/streaming data from your sensors
Symptom: Devices or sensors are deployed, created on FarmBeats and ingested telemetry to the EventHub, but you can't get or view telemetry data on FarmBeats.
Corrective action
Ensure partner registration is done correctly - you can check this by going to your datahub swagger, navigate to /Partner API, Do a Get and check if the partner is registered. If not, follow these steps to add partner.
Ensure that you used the correct Telemetry message format:
{
"deviceid": "<id of the Device created>",
"timestamp": "<timestamp in ISO 8601 format>",
"version" : "1",
"sensors": [
    {
      "id": "<id of the sensor created>",
      "sensordata": [
        {
          "timestamp": "< timestamp in ISO 8601 format >",
          "<sensor measure name (as defined in the Sensor Model)>":<value>
        },
        {
          "timestamp": "<timestamp in ISO 8601 format>",
          "<sensor measure name (as defined in the Sensor Model)>": <value>
        }
      ]
    }
 ]
}
Don't have the Azure Event Hubs connection string
Corrective action
- In Datahub Swagger, go to the Partner API.
- Select Get > Try it out > Execute.
Note
The partner ID of the sensor partner you're interested in.
Go back to the Partner API, and select Get/<ID>.
Specify the partner ID from step 3, and then select Execute.
The API response should have the Event Hubs connection string.
Device appears offline
Symptoms: Devices are installed, and FarmBeats is linked with your device partner. The devices are online and sending telemetry data, but they appear offline.
Corrective action The reporting interval isn't configured for this device. To set the reporting interval, contact your device manufacturer.
Error deleting a device
While you're deleting a device, you might encounter one of the following common error scenarios:
Message: "Device is referenced in sensors: There are one or more sensors associated with the device. Delete the sensors and then delete the device."
Meaning: The device is associated with multiple sensors that are deployed in the farm.
Corrective action
- Delete the sensors that are associated with the device through Accelerator.
- If you want to associate the sensors with a different device, ask your device partner to do the same.
- Delete the device by using a
DELETE APIcall, and set the force parameter as true.
Message: "Device is referenced in devices as ParentDeviceId: There are one or more devices that are associated with this device as child devices. Delete them, and then delete this device."
Meaning: Your device has other devices associated with it.
Corrective action
Delete the devices that are associated with this specific device.
Delete the specific device.
Note
You can't delete a device if sensors are associated with it. For more information about how to delete associated sensors, see the Delete sensor section in Get sensor data from sensor partners. Partners do not have permission to delete a device or sensor. Only Admins have permission to delete.
Issues with jobs
FarmBeats internal error
Message: "FarmBeats internal error, see troubleshooting guide for more details."
Corrective action This issue might result from a temporary failure in the data pipeline. Create the job again. If the error persists, contact us with the error message/logs.
Accelerator troubleshooting
Access control
Issue: You receive an error while you're adding a role assignment.
Message: "No matching users found."
Corrective action Check the email ID for which you're trying to add a role assignment. The email ID must be an exact match of the ID, which is registered for that user in the Active Directory. If the error persists, contact us with the error message/logs.
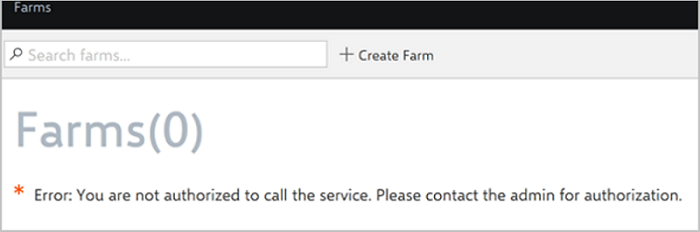
Unable to sign-in to Accelerator
Message: "Error: You aren't authorized to call the service. Contact the administrator for authorization."
Corrective action Ask the administrator to authorize you to access the FarmBeats deployment by doing a POST of the RoleAssignment APIs or through the Access Control in the Settings pane in Accelerator.
If you have access and facing this error, try again by refreshing the page. If the error persists, contact us with the error message/logs.
Accelerator issues
Issue: You get an Accelerator error of undetermined cause.
Message: "Error: An unknown error occurred."
Corrective action This error occurs if you leave the page idle for too long. Refresh the page. If the error persists, contact us with the error message/logs.
Issue: FarmBeats Accelerator isn't showing the latest version, even after you upgraded FarmBeatsDeployment.
Corrective action This error occurs because of service worker persistence in the browser. Do the following steps:
- Close all browser tabs that have Accelerator open, and close the browser window.
- Start a new instance of the browser, and reload the Accelerator URI. This action loads the new version of Accelerator.
Sentinel: Imagery-related issues
Wrong username or password
Job failure message: "Full authentication is required to access this resource."
Corrective action: Do one of the following steps:
Update FarmBeats with the correct username/password using the below steps and retry the job.
Update Sentinel username
- Sign in to Azure portal.
- In the Search box, search for the FarmBeats Datahub resource group.
- Select Storage account storage***** > Containers > batch-prep-files > to_vm > config.ini
- Select Edit
- Update the username in the sentinel_account section
Update Sentinel password
- Sign in to Azure portal.
- In the Search box, search for the FarmBeats Datahub resource group.
- Select keyvault-*****
- Select Access Policies under Settings
- Select Add Access Policy
- Use Secret management for Configure from Template and add yourself to Principal
- Select Add, and then select Save on the Access Policies page
- Select Secrets under Settings
- Select Sentinel-password
- Create a new version of the value and enable it.
Rerun the failed job, or run a satellite indices job for a date range of 5 to 7 days, and then check to see whether the job is successful.
Sentinel hub: Wrong URL or site not accessible
Job failure message: "Oops, something went wrong. The page you were trying to access is (temporarily) unavailable."
Corrective action:
- Open Sentinel in your browser to see whether the website is accessible.
- If the website isn't accessible, check whether any firewall, company network, or other blocking software is preventing access to the website. After checking, take the necessary steps to allow the Sentinel URL.
- Rerun the failed job, or run a satellite indices job for a date range of 5 to 7 days, and then check whether the job is successful.
Sentinel server: Down for maintenance
Job failure message: "The Copernicus Open Access Hub is back soon! Sorry for the inconvenience, we're performing some maintenance at the moment. We will be back online shortly!"
Corrective action:
This issue can occur if any maintenance activities are being done on the Sentinel server.
If any job or pipeline fails because maintenance is being performed, resubmit the job after some time.
For information about any planned or unplanned Sentinel maintenance activities, go to the Copernicus Open Access Hub News site.
Rerun the failed job, or run a satellite indices job for a date range of 5 to 7 days, and then check whether the job is successful.
Sentinel: Maximum number of connections reached
Job failure message: "Maximum number of two concurrent flows achieved by the user '<username>'."
Meaning: If a job fails because the maximum number of connections are reached, the same Sentinel account is being used in multiple jobs.
Corrective action: Try either of the following options:
- Wait for the other jobs to finish before rerunning the failed job.
- Create a new Sentinel account, and then update the Sentinel username and password in FarmBeats.
Sentinel server: Refused connection
Job failure message: "Server refused connection at: http://172.30.175.69:8983/solr/dhus."
Corrective action: This issue can occur if any maintenance activities are being done on the Sentinel server.
If any job or pipeline fails because maintenance is being performed, resubmit the job after some time.
For information about any planned or unplanned Sentinel maintenance activities, go to the Copernicus Open Access Hub News site.
Rerun the failed job, or run a satellite indices job for a date range of 5 to 7 days, and then check whether the job is successful.
Soil Moisture map has white areas
Issue: The Soil Moisture map was generated, but the map has mostly white areas.
Corrective action: This issue can occur if the satellite indices generated for the time for which the map was requested has NDVI values that are less than 0.3. For more information, visit Technical Guide from Sentinel.
- Rerun the job for a different date range and check if the NDVI values in the satellite indices are more than 0.3.
Collect logs manually
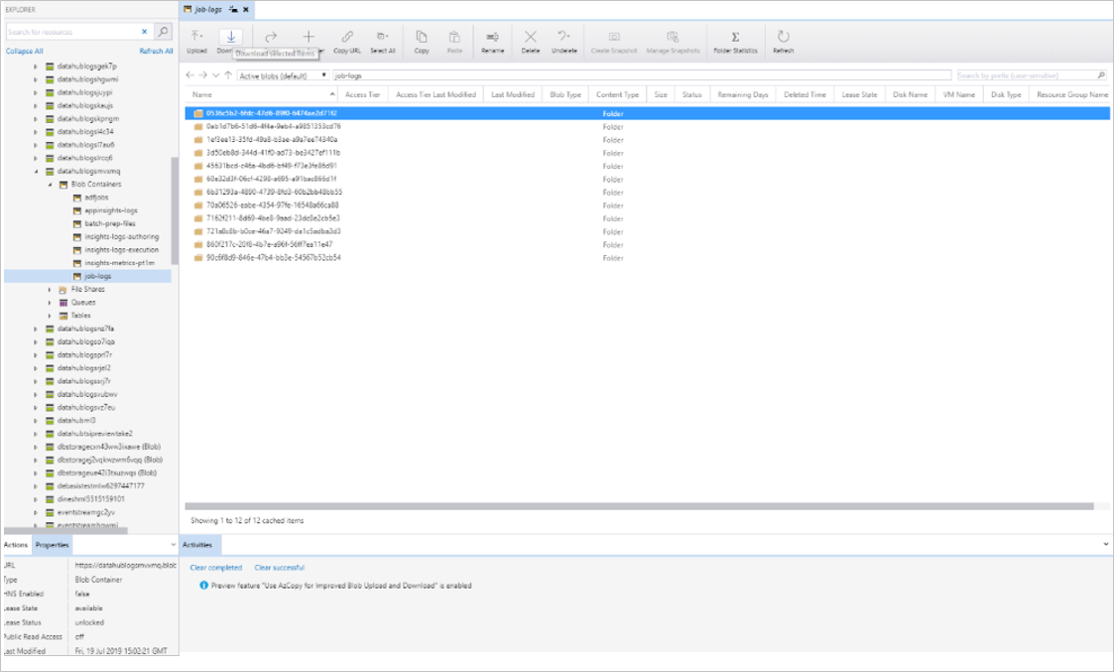
Install and deploy Azure Storage Explorer.
Collect Azure Data Factory job logs or App Service logs in Datahub
Sign in to the Azure portal.
In the Search box, search for the FarmBeats Datahub resource group.
On the Resource Group dashboard, search for the datahublogs* storage account. For example, datahublogsmvxmq.
In the Name column, select the storage account to view the Storage Account dashboard.
In the datahubblogs* pane, select Open in Explorer to view the Open Azure Storage Explorer application.
In the left pane, select Blob Containers, and then select job-logs for Azure Data Factory logs or appinsights-logs for App Service logs.
Select Download and download the logs to a local folder on your machine.
Collect Azure Data Factory job logs or App Service logs for Accelerator
- Sign in to the Azure portal.
- In the Search box, search for the FarmBeats Accelerator resource group.
- On the Resource Group dashboard, search for the storage* storage account. For example, storagedop4k*.
- Select the storage account in the Name column to view the Storage Account dashboard.
- In the storage* pane, select Open in Explorer to open the Azure Storage Explorer application.
- In the left pane, select Blob Containers, and then select job-logs for Azure Data Factory logs or appinsights-logs for App Service logs.
- Select Download and download the logs to a local folder on your machine.
High CPU usage
Error: You get an email alert that refers to a High CPU Usage Alert.
Corrective action:
- Go to your FarmBeats Datahub resource group.
- Select the App service.
- Go to the scale up App Service pricing page, and then select an appropriate pricing tier.
Weather data job failures
Error: You run Jobs to get weather data but the job fails
Collect logs to troubleshoot weather data job failures
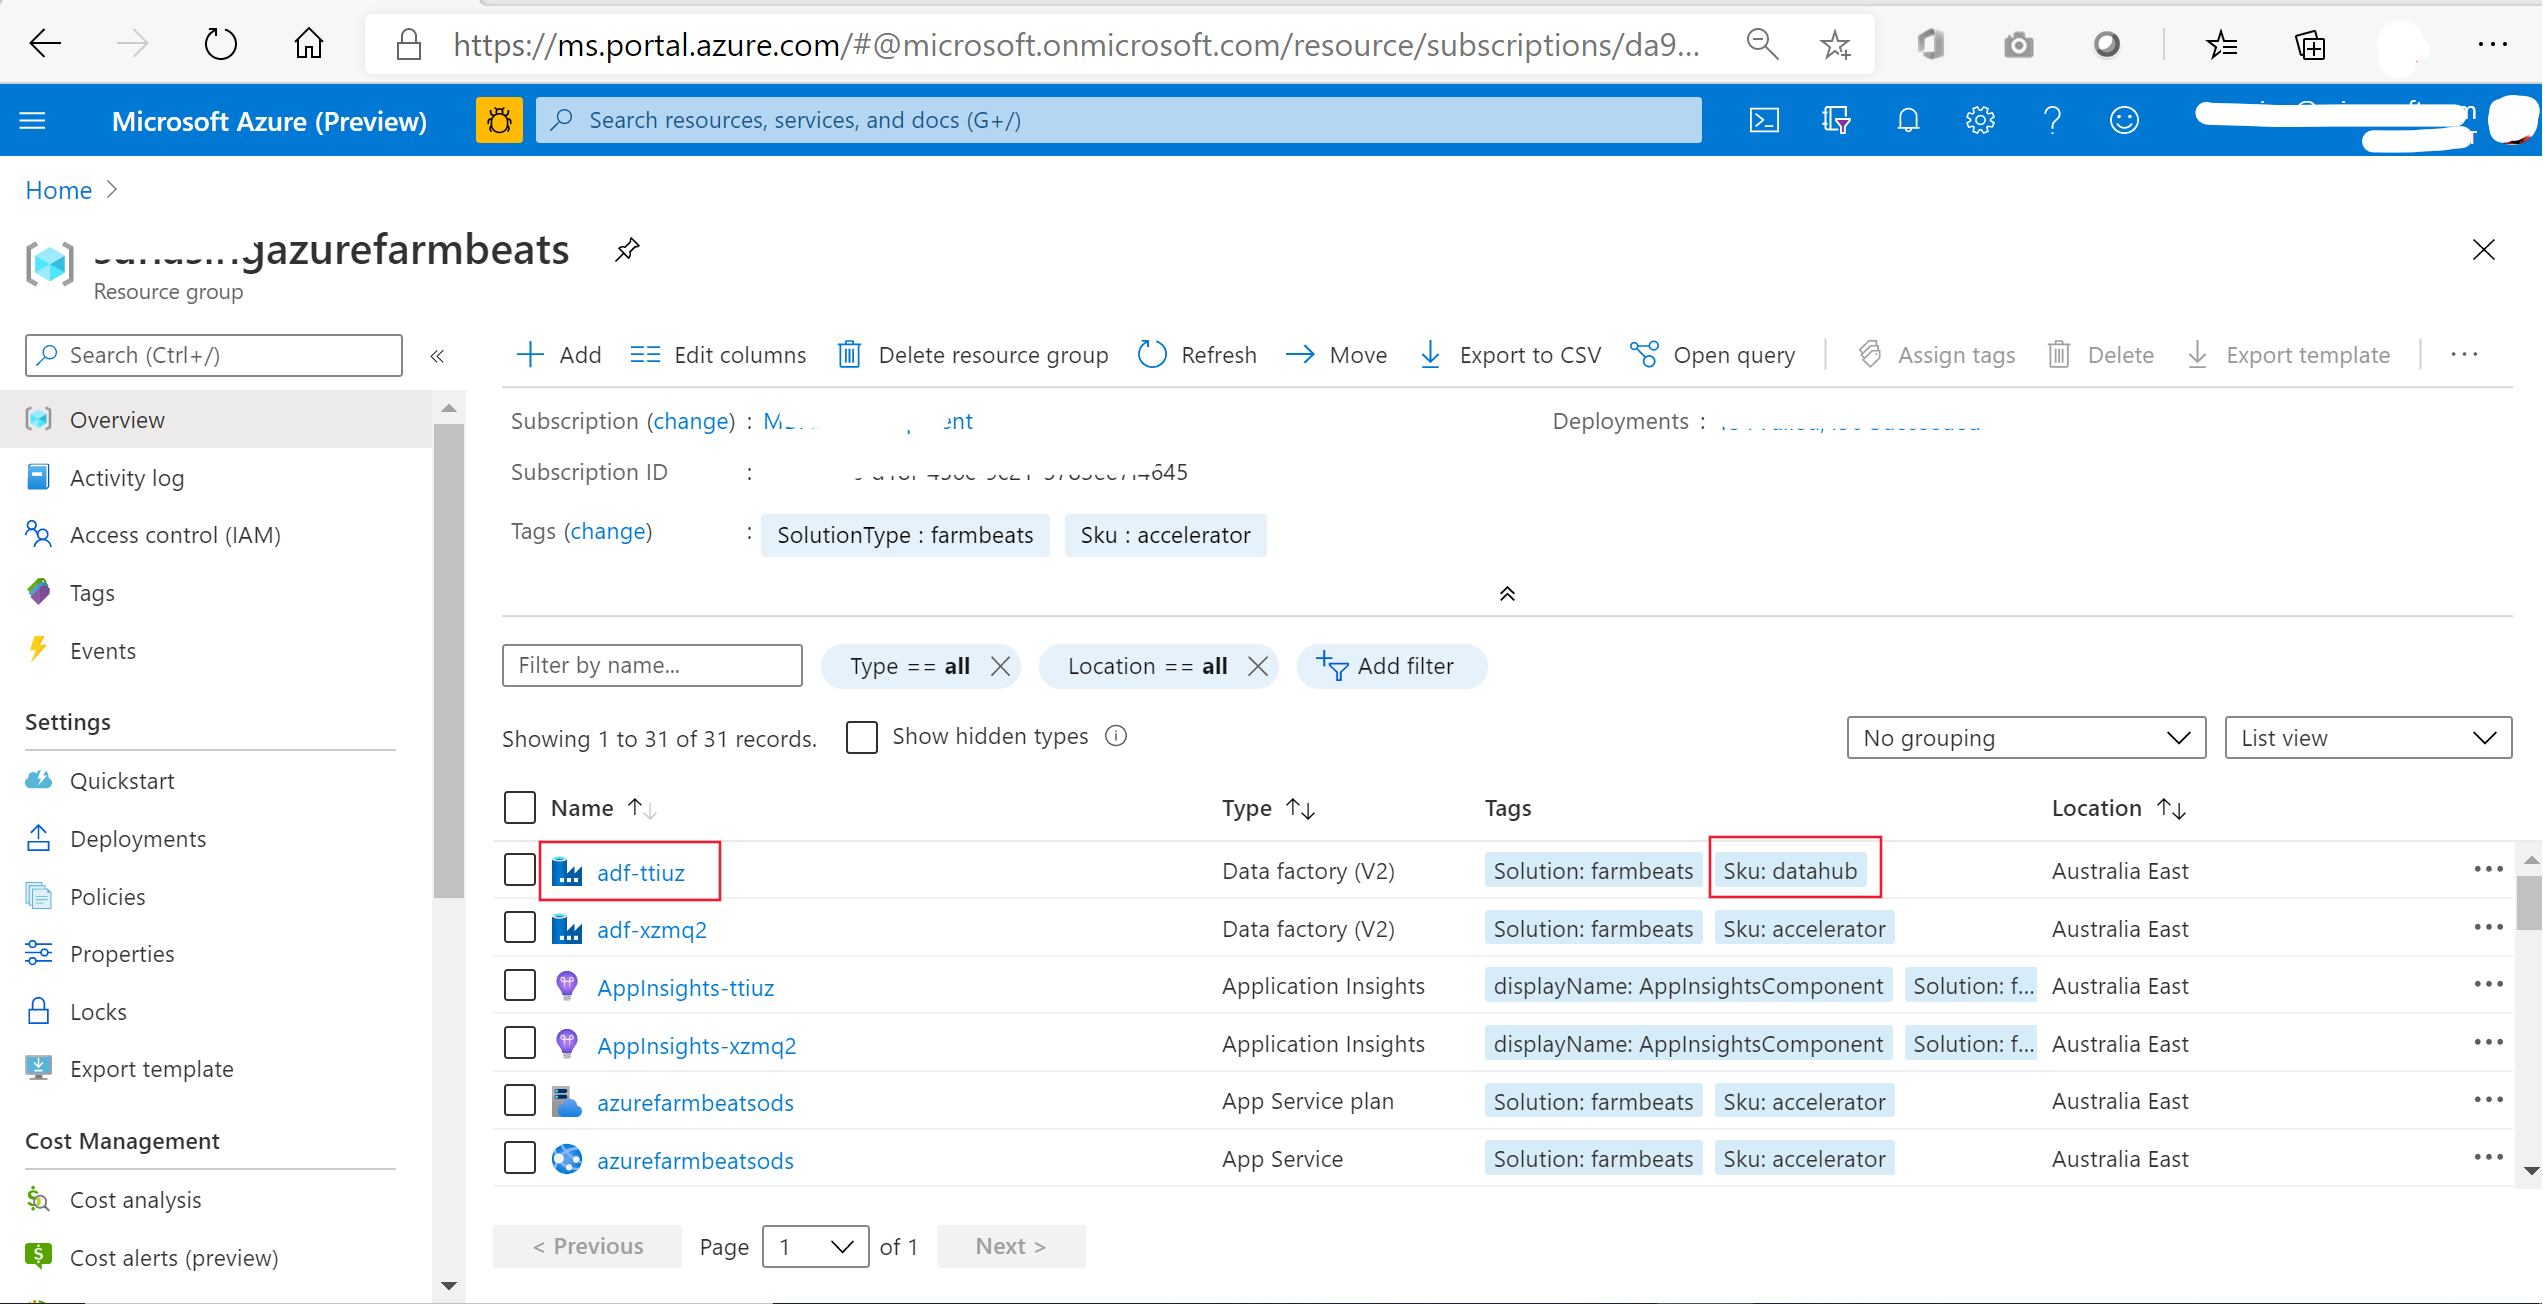
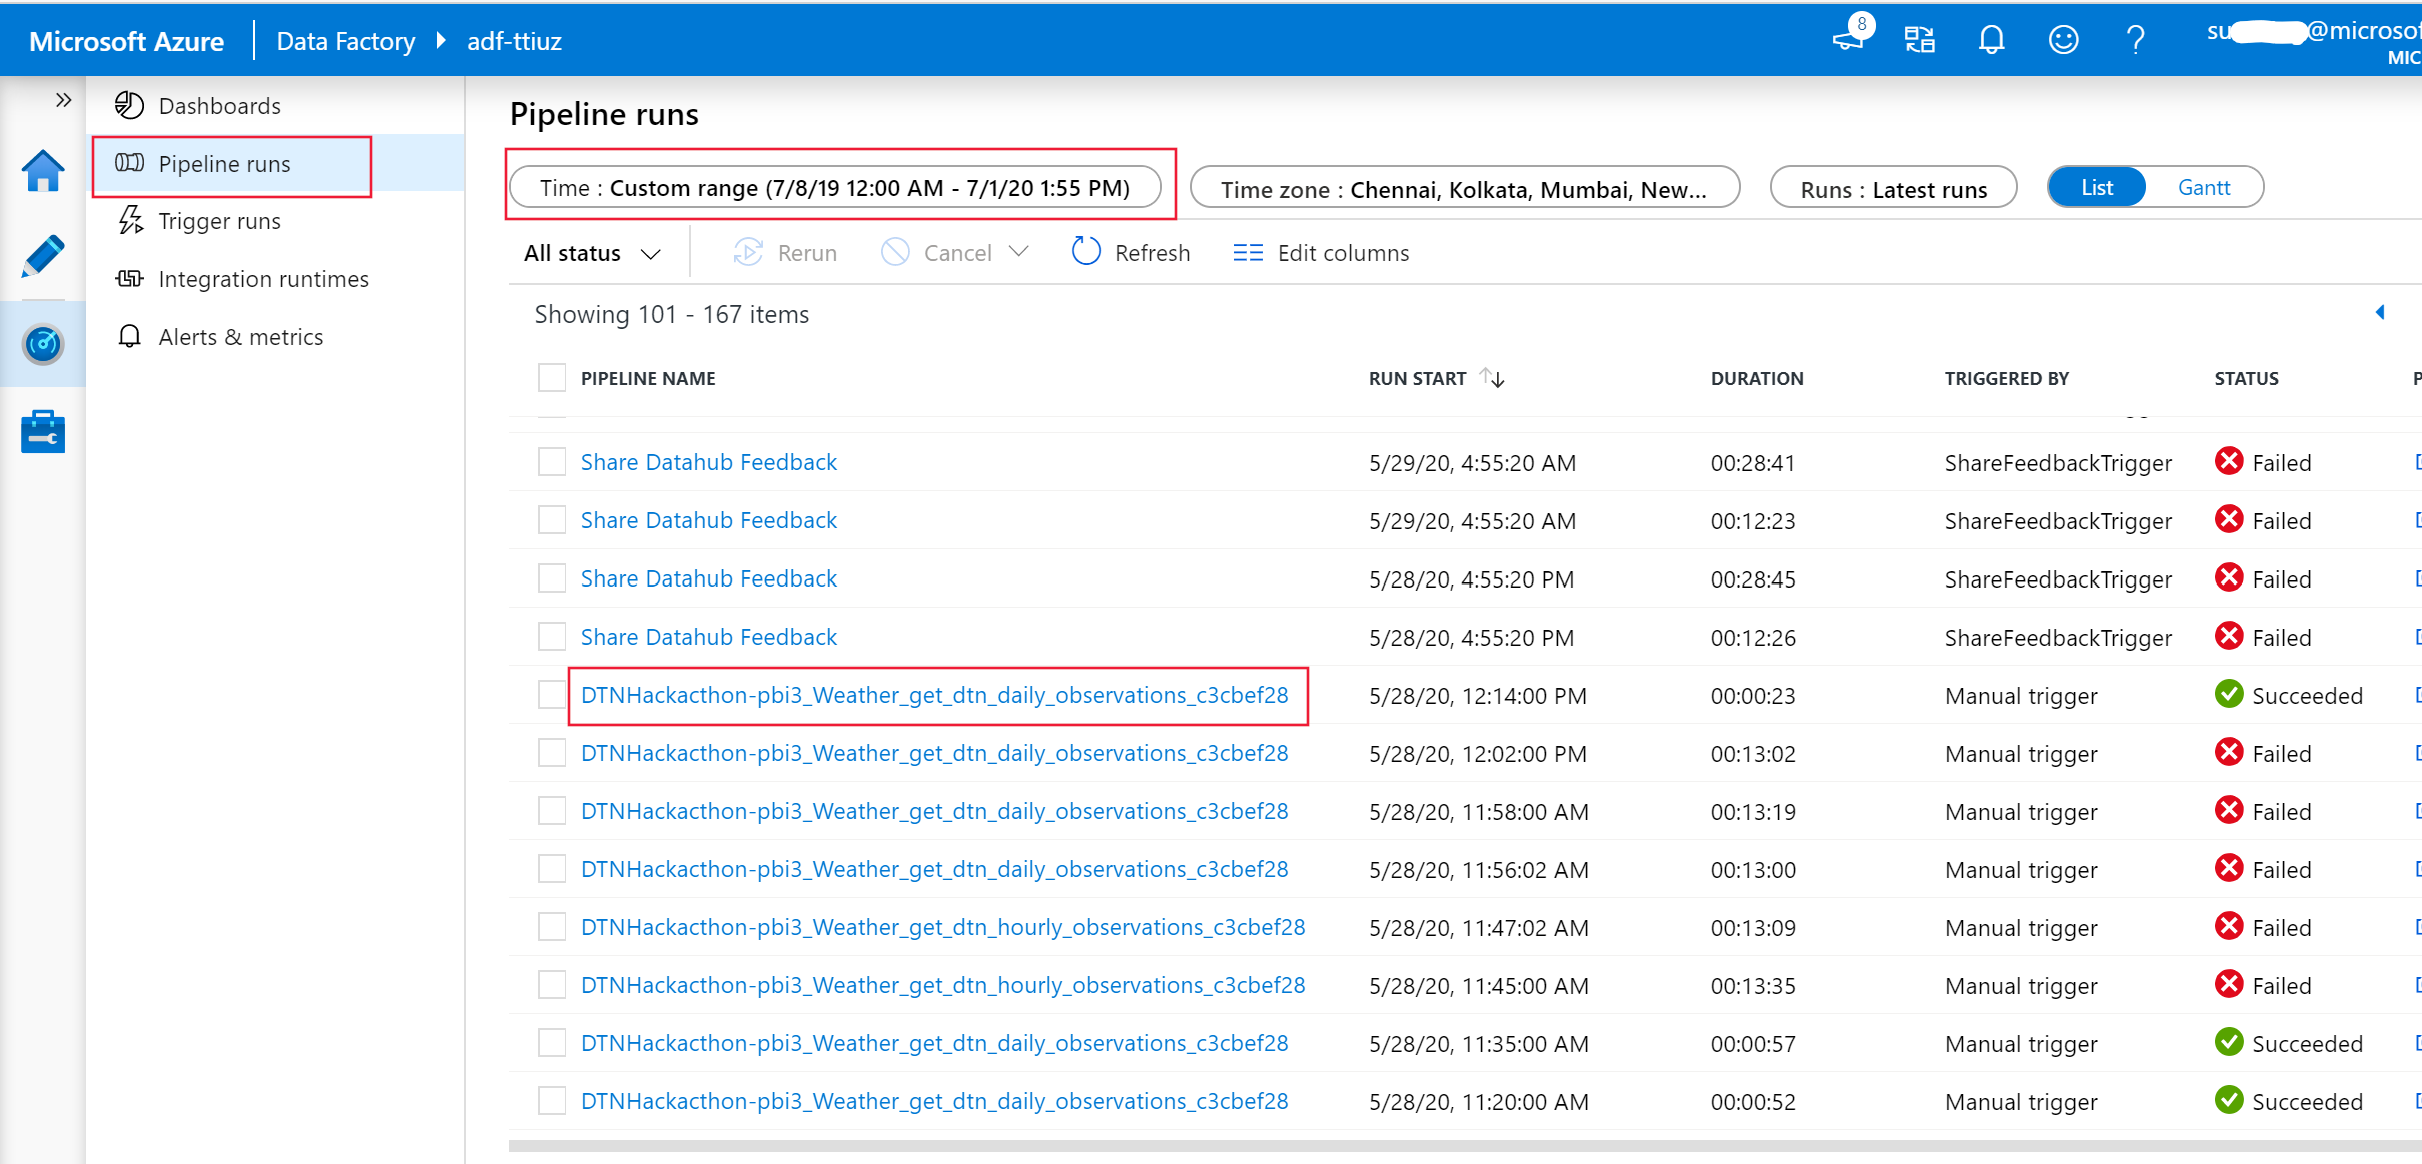
- Go to your FarmBeats resource group in the Azure portal.
- Select on the Data Factory service that is part of the resource group. The service has a tag "sku: Datahub"
Note
To view the tags of the services within the resource group, click on "Edit Columns" and add "Tags" to the resource group view
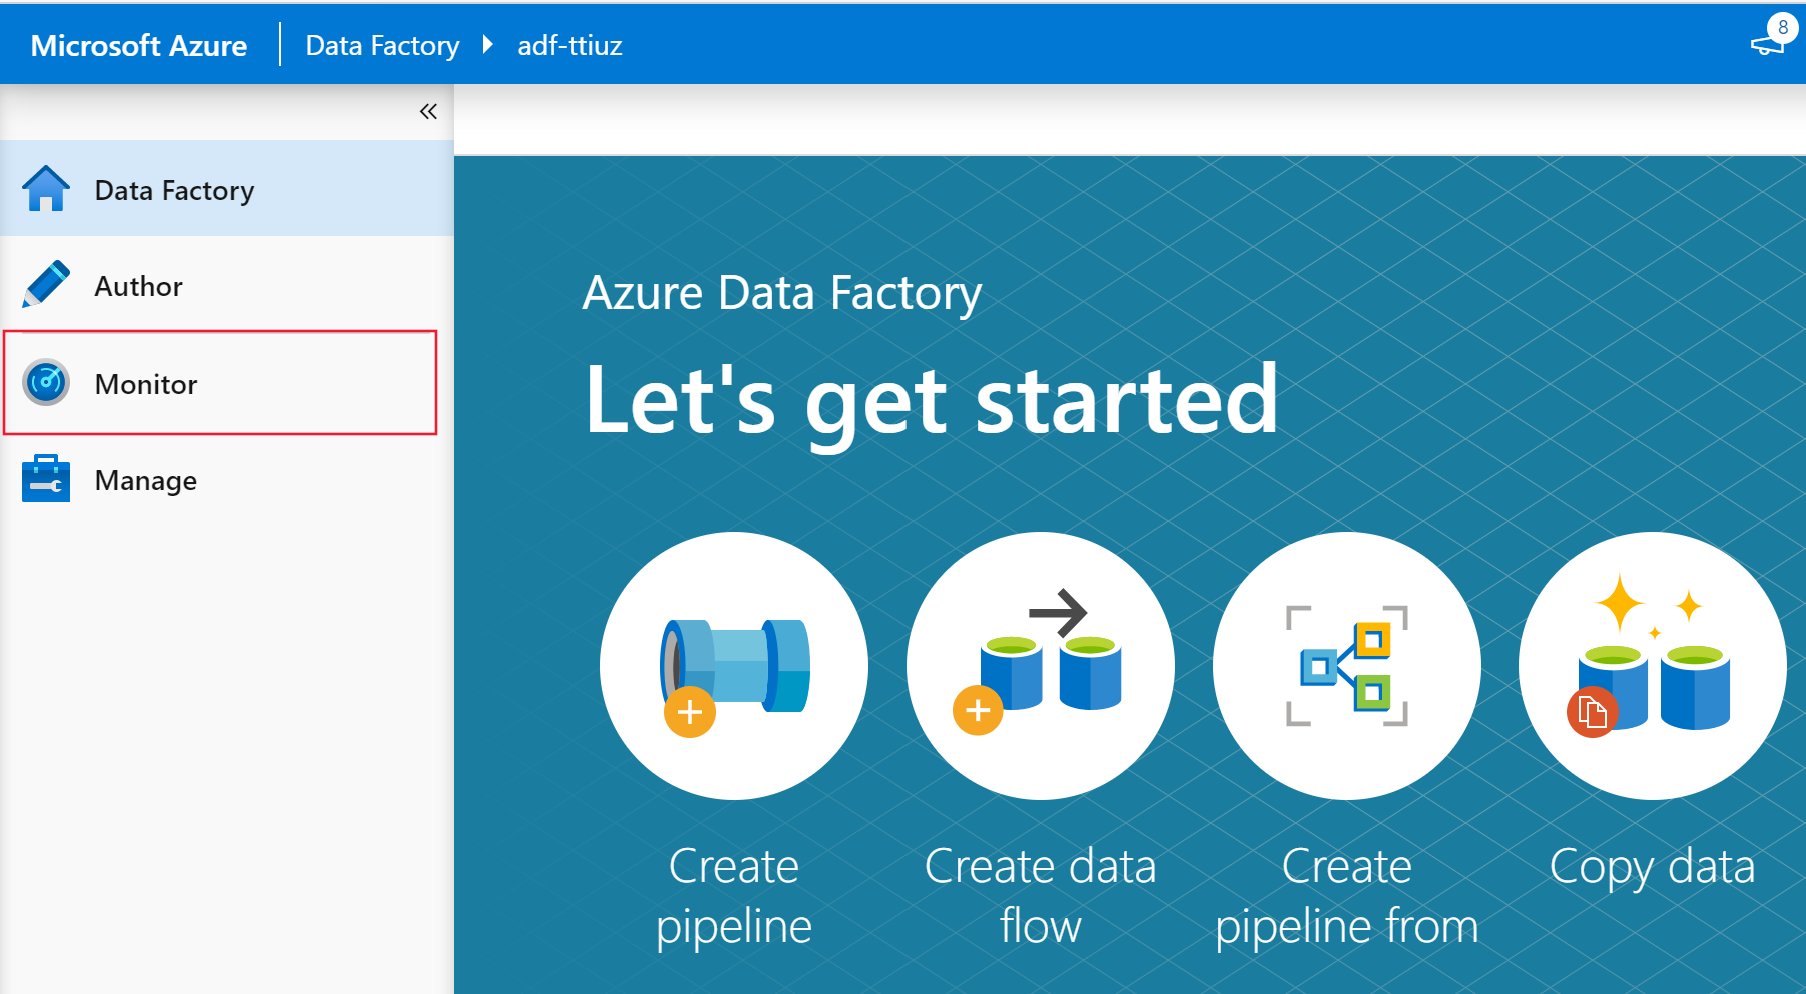
- On the Overview page of the Data factory, select on Author and Monitor. A new tab opens on your browser. Select on Monitor
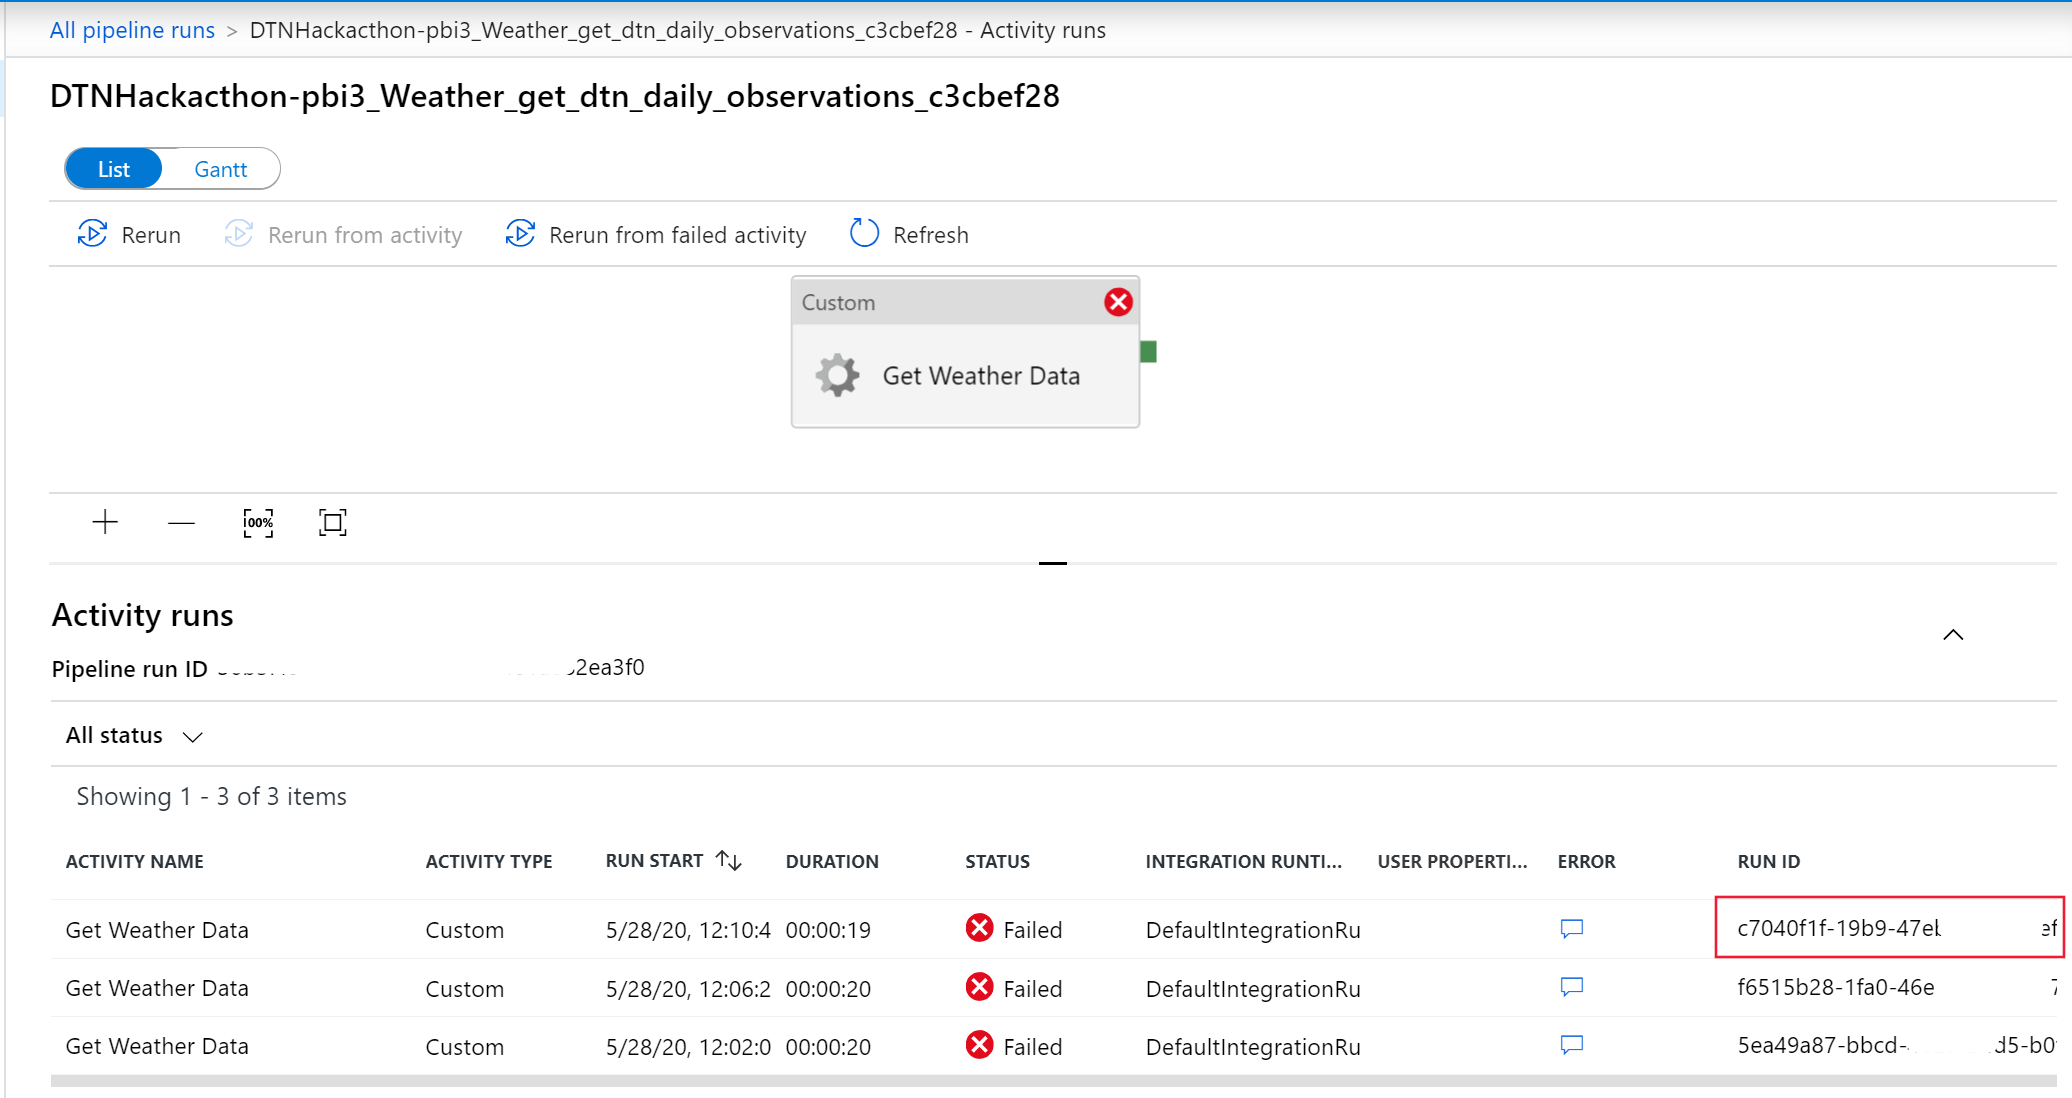
- You see a list of pipeline runs that are part of the weather job execution. Select on the Job that you want to collect logs for
- On the pipeline overview page, you see the list of activity runs. Make a note of the Run IDs of the activities that you want to collect logs for
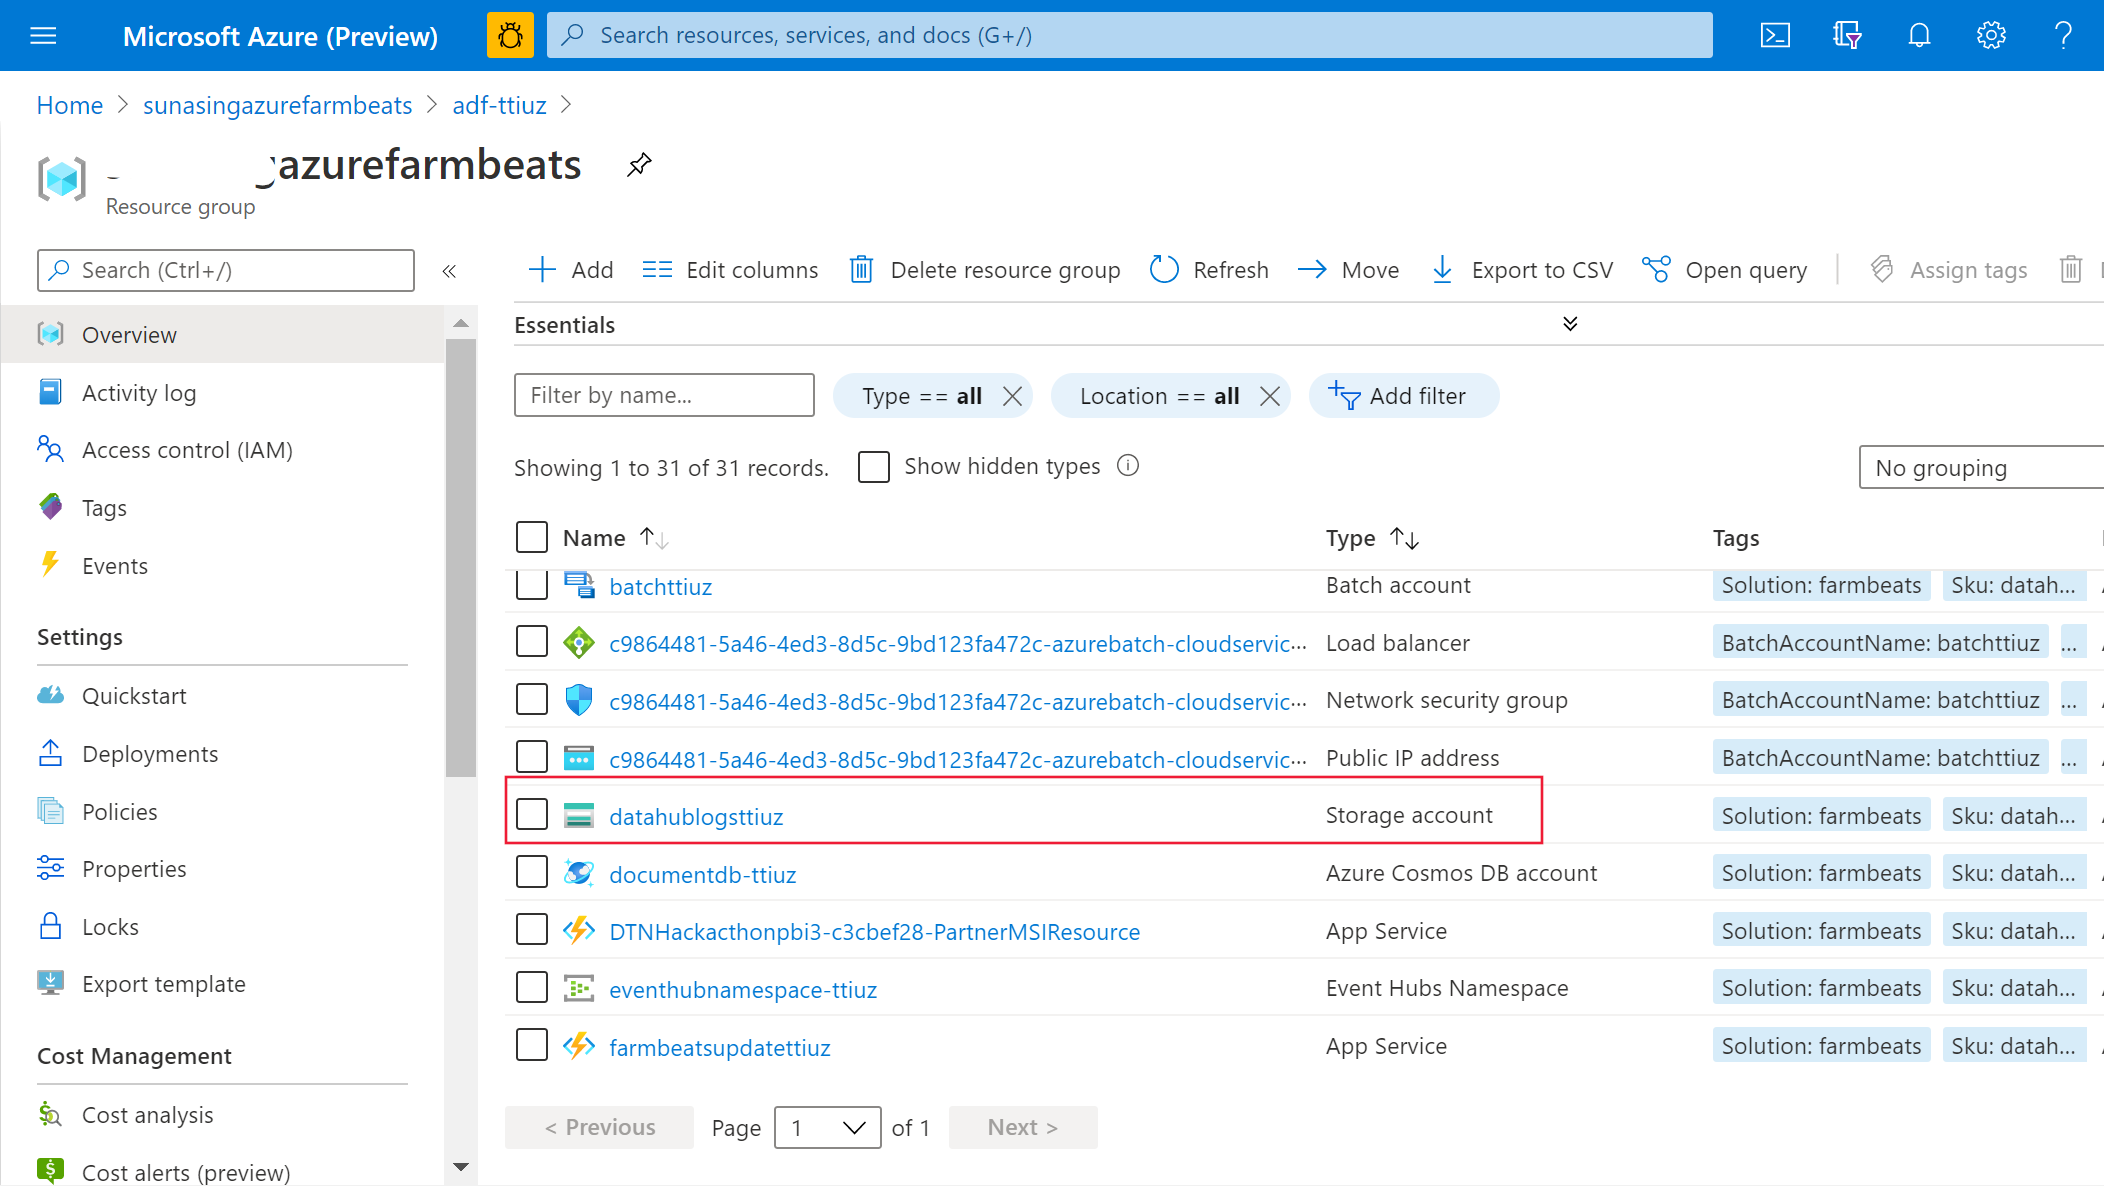
- Go back to your FarmBeats resource group in Azure portal and select on the Storage Account with the name datahublogs-XXXX
- Select on Containers -> adfjobs. In the Search box, enter the job Run ID that you noted in step 5 above.
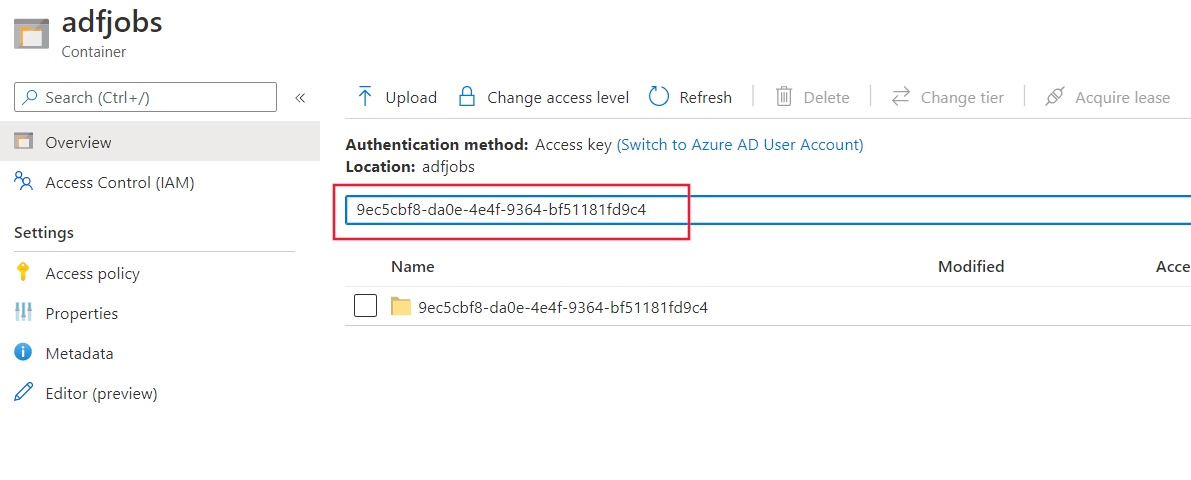
- The search result contains the folder that has the logs pertaining to the job. Download the logs and send it to farmbeatssupport@microsoft.com for assistance in debugging the issue.