Note
Access to this page requires authorization. You can try signing in or changing directories.
Access to this page requires authorization. You can try changing directories.
Use distributed tracing (preview) in IoT Hub to monitor IoT messages as they pass through Azure services. IoT Hub is one of the first Azure services to support distributed tracing. As more Azure services support distributed tracing, you're able to trace Internet of Things (IoT) messages throughout the Azure services involved in your solution. For more information about the feature, see What is distributed tracing?.
When you enable distributed tracing for IoT Hub, you can:
- Monitor the flow of each message through IoT Hub by using trace context. Trace context includes correlation IDs that allow you to correlate events from one component with events from another component. You can apply it for a subset or all IoT device messages by using a device twin.
- Log the trace context to Azure Monitor Logs.
- Measure and understand message flow and latency from devices to IoT Hub and routing endpoints.
Important
Distributed tracing an Azure IoT Hub is currently in PREVIEW. See the Supplemental Terms of Use for Microsoft Azure Previews for legal terms that apply to Azure features that are in beta, preview, or otherwise not yet released into general availability.
Prerequisites
An Azure IoT hub created in one of the following regions.
- North Europe
- Southeast Asia
- West US 2
A device registered in your IoT hub. If you don't have a device in your IoT hub, follow the steps in Register a device and save the device connection string to use in this article.
This article assumes that you're familiar with sending telemetry messages to your IoT hub.
The latest version of Git.
Public preview limits and considerations
Consider the following limitations to determine if this preview feature is right for your scenarios:
The proposal for the W3C Trace Context standard is currently a working draft.
The only development language that the client SDK currently supports is C, in the public preview branch of the Azure IoT device SDK for C
Cloud-to-device twin capability isn't available for the IoT Hub basic tier. However, IoT Hub still logs to Azure Monitor if it sees a properly composed trace context header.
To ensure efficient operation, IoT Hub imposes a throttle on the rate of logging that can occur as part of distributed tracing.
The distributed tracing feature is supported only for IoT hubs created in the following regions:
- North Europe
- Southeast Asia
- West US 2
Understand Azure IoT distributed tracing
Many IoT solutions, including the Azure IoT reference architecture, generally follow a variant of the microservice architecture. As an IoT solution grows more complex, you end up using a dozen or more microservices. These microservices might or might not be from Azure.
Pinpointing where IoT messages are dropping or slowing down can be challenging. For example, imagine that you have an IoT solution that uses five different Azure services and 1,500 active devices. Each device sends 10 device-to-cloud messages per second, for a total of 15,000 messages per second. But you notice that your web app sees only 10,000 messages per second. How do you find the culprit?
For you to reconstruct the flow of an IoT message across services, each service should propagate a correlation ID that uniquely identifies the message. After Azure Monitor collects correlation IDs in a centralized system, you can use those IDs to see message flow. This method is called the distributed tracing pattern.
To support wider adoption for distributed tracing, Microsoft is contributing to W3C standard proposal for distributed tracing. When distributed tracing support for IoT Hub is enabled, it follows this flow for each generated message:
- A message is generated on the IoT device.
- The IoT device decides (with help from the cloud) that this message should be assigned with a trace context.
- The SDK adds a
tracestatevalue to the message property, which contains the time stamp for message creation. - The IoT device sends the message to IoT Hub.
- The message arrives at the IoT Hub gateway.
- IoT Hub looks for the
tracestatevalue in the message properties and checks whether it's in the correct format. If so, IoT Hub generates a globally uniquetrace-idvalue for the message and aspan-idvalue for the "hop." IoT Hub records these values in the IoT Hub distributed tracing logs under theDiagnosticIoTHubD2Coperation. - When the message processing is finished, IoT Hub generates another
span-idvalue and logs it, along with the existingtrace-idvalue, under theDiagnosticIoTHubIngressoperation. - If routing is enabled for the message, IoT Hub writes it to the custom endpoint. IoT Hub logs another
span-idvalue with the sametrace-idvalue under theDiagnosticIoTHubEgresscategory.
Configure distributed tracing in an IoT hub
In this section, you configure an IoT hub to log distributed tracing attributes (correlation IDs and time stamps).
Go to your IoT hub in the Azure portal.
On the left pane for your IoT hub, scroll down to the Monitoring section and select Diagnostics settings.
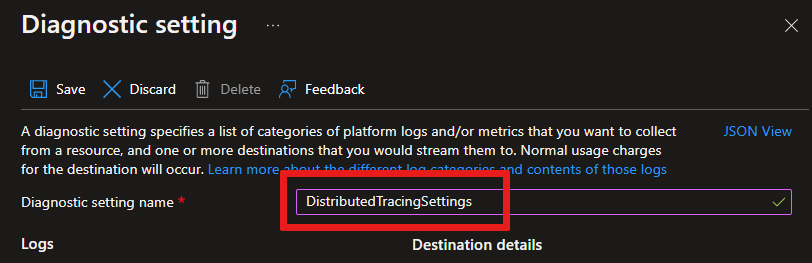
Select Add diagnostic setting.
In the Diagnostic setting name box, enter a name for a new diagnostic setting. For example, enter DistributedTracingSettings.
Choose one or more of the following options under Destination details to determine where to send logging information:
- Archive to a storage account: Configure a storage account to contain the logging information.
- Stream to an event hub: Configure an event hub to contain the logging information.
- Send to Log Analytics: Configure a Log Analytics workspace to contain the logging information.
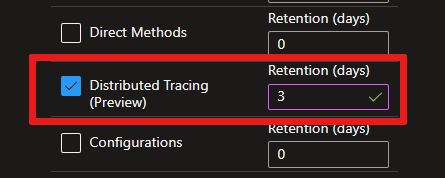
In the Logs section, select the operations that you want to log.
Include Distributed Tracing and configure a Retention period for how many days you want the logging retained. Log retention affects storage costs.
Select Save.
(Optional) To see the messages flow to different places, set up routing rules to at least two different endpoints.

After the logging is turned on, IoT Hub records a log when a message that contains valid trace properties is encountered in any of the following situations:
- The message arrives at the IoT hub's gateway.
- The IoT hub processes the message.
- The message is routed to custom endpoints. Routing must be enabled.
To learn more about these logs and their schemas, see Monitor IoT Hub and Distributed tracing in IoT Hub resource logs.
Update sampling options
To change the percentage of messages to be traced from the cloud, you must update the device twin. You can make updates by using the JSON editor in the Azure portal or the IoT Hub service SDK. The following subsections provide examples.
Update a single device
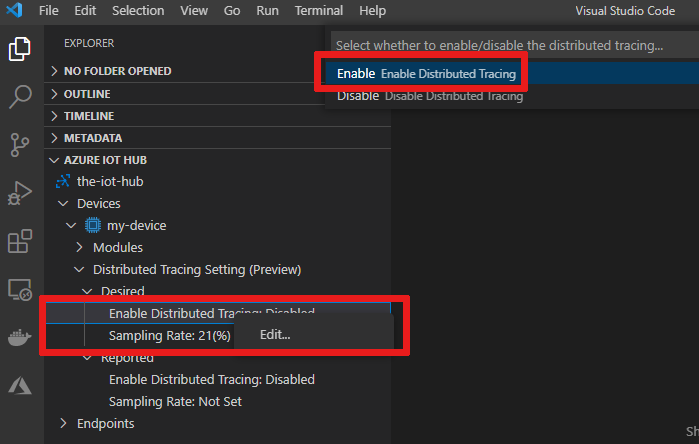
You can use the Azure portal or the Azure IoT Hub extension for Visual Studio Code (VS Code) to update the sampling rate of a single device.
Go to your IoT hub in the Azure portal, and then select Devices from the Device management section of the menu.
Choose your device.
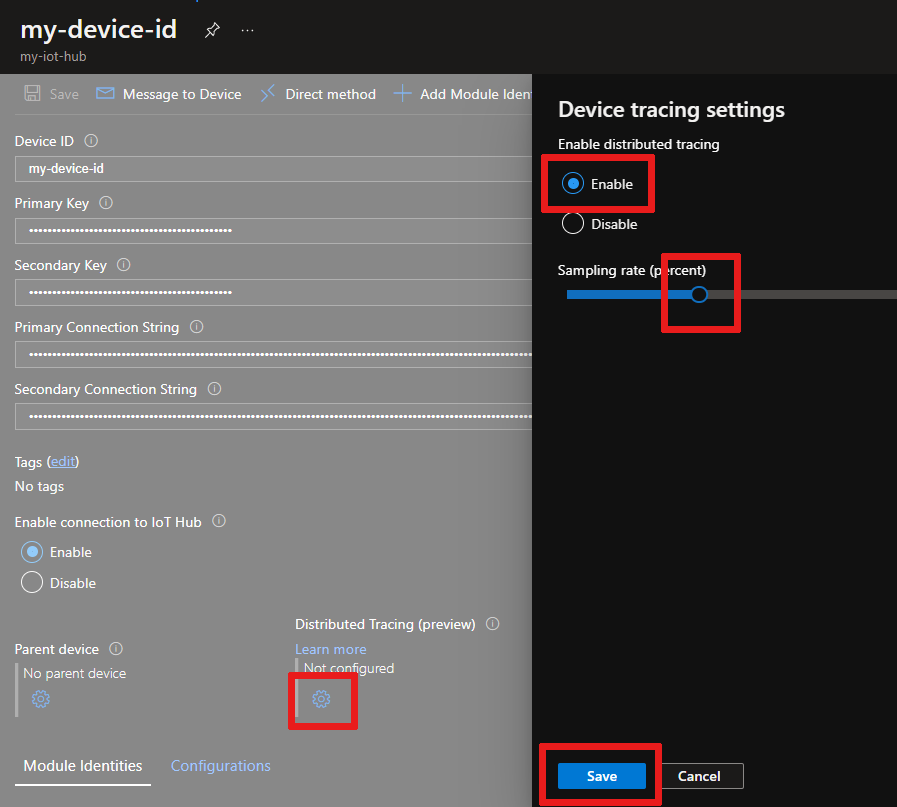
Select the gear icon under Distributed Tracing (preview). In the panel that opens:
- Select the Enable option.
- For Sampling rate, choose a percentage between 0 and 100.
- Select Save.
Wait a few seconds, and then select Refresh. If the device successfully acknowledges your changes, a sync icon with a check mark appears.

Bulk update multiple devices
To update the distributed tracing sampling configuration for multiple devices, use automatic device configuration. Follow this twin schema:
{
    "properties": {
        "desired": {
            "azureiot*com^dtracing^1": {
                "sampling_mode": 1,
                "sampling_rate": 100
            }
        }
    }
}
| Element name | Required | Type | Description |
|---|---|---|---|
sampling_mode |
Yes | Integer | Two mode values are currently supported to turn sampling on and off. 1 is on, and 2 is off. |
sampling_rate |
Yes | Integer | This value is a percentage. Only values from 0 to 100 (inclusive) are permitted. |
Query and visualize traces
To see all the traces logged by an IoT hub, query the log store that you selected in diagnostic settings. This section shows how to query by using Log Analytics.
If you set up Log Analytics with resource logs, query by looking for logs in the DistributedTracing category. For example, this query shows all the logged traces:
// All distributed traces
AzureDiagnostics
| where Category == "DistributedTracing"
| project TimeGenerated, Category, OperationName, Level, CorrelationId, DurationMs, properties_s
| order by TimeGenerated asc
Here are a few example logs in Log Analytics:
| Time generated | Operation name | Category | Level | Correlation ID | Duration in milliseconds | Properties |
|---|---|---|---|---|---|---|
| 2018-02-22T03:28:28.633Z | DiagnosticIoTHubD2C | DistributedTracing | Informational | 00-8cd869a412459a25f5b4f31311223344-0144d2590aacd909-01 | {"deviceId":"AZ3166","messageSize":"96","callerLocalTimeUtc":"2018-02-22T03:27:28.633Z","calleeLocalTimeUtc":"2018-02-22T03:27:28.687Z"} |
|
| 2018-02-22T03:28:38.633Z | DiagnosticIoTHubIngress | DistributedTracing | Informational | 00-8cd869a412459a25f5b4f31311223344-349810a9bbd28730-01 | 20 | {"isRoutingEnabled":"false","parentSpanId":"0144d2590aacd909"} |
| 2018-02-22T03:28:48.633Z | DiagnosticIoTHubEgress | DistributedTracing | Informational | 00-8cd869a412459a25f5b4f31311223344-349810a9bbd28730-01 | 23 | {"endpointType":"EventHub","endpointName":"myEventHub", "parentSpanId":"0144d2590aacd909"} |
To understand the types of logs, see Azure IoT Hub distributed tracing logs.
Run a sample application
In this section, you prepare a development environment for use with the Azure IoT C SDK. Then, you modify one of the samples to enable distributed tracing on your device's telemetry messages.
These instructions are for building the sample on Windows. For other environments, see Compile the C SDK or Prepackaged C SDK for Platform Specific Development.
Clone the source code and initialize
Install the Desktop development with C++ workload for Visual Studio 2022. Visual Studio 2019 is also supported.
Install CMake. Ensure that it's in your
PATHby enteringcmake -versionfrom a command prompt.Open a command prompt or Git Bash shell. Run the following commands to clone the latest release of the public-preview branch of the Azure IoT C SDK GitHub repository:
git clone -b public-preview https://github.com/Azure/azure-iot-sdk-c.git
cd azure-iot-sdk-c
git submodule update --init
Expect this operation to take several minutes to finish.
Run the following commands from the
azure-iot-sdk-cdirectory to create acmakesubdirectory and go to thecmakefolder:mkdir cmake cd cmake cmake ..If CMake can't find your C++ compiler, you might encounter build errors while running the preceding command. If that happens, try running the command in the Visual Studio command prompt.
After the build succeeds, the last few output lines will look similar to the following output:
$ cmake ..
-- Building for: Visual Studio 15 2017
-- Selecting Windows SDK version 10.0.16299.0 to target Windows 10.0.17134.
-- The C compiler identification is MSVC 19.12.25835.0
-- The CXX compiler identification is MSVC 19.12.25835.0

...

-- Configuring done
-- Generating done
-- Build files have been written to: E:/IoT Testing/azure-iot-sdk-c/cmake
Edit the telemetry sample to enable distributed tracing
In this section, you edit the iothub_ll_telemetry_sample.c sample in the SDK repository to enable distributed tracing. Or, you can copy an already edited version of the sample from the azure-iot-distributed-tracing-sample repository.
Use an editor to open the
azure-iot-sdk-c/iothub_client/samples/iothub_ll_telemetry_sample/iothub_ll_telemetry_sample.csource file.Find the declaration of the
connectionStringconstant:/* Paste in the your iothub connection string */ static const char* connectionString = "[device connection string]"; #define MESSAGE_COUNT 5000 static bool g_continueRunning = true; static size_t g_message_count_send_confirmations = 0;Replace the value of the
connectionStringconstant with the device connection string that you saved in the Register a device section of the quickstart for sending telemetry.Find the line of code that calls
IoTHubDeviceClient_LL_SetConnectionStatusCallbackto register a connection status callback function before the send message loop. Add code under that line to callIoTHubDeviceClient_LL_EnablePolicyConfigurationand enable distributed tracing for the device:// Setting connection status callback to get indication of connection to iothub (void)IoTHubDeviceClient_LL_SetConnectionStatusCallback(device_ll_handle, connection_status_callback, NULL); // Enabled the distrubted tracing policy for the device (void)IoTHubDeviceClient_LL_EnablePolicyConfiguration(device_ll_handle, POLICY_CONFIGURATION_DISTRIBUTED_TRACING, true); do { if (messages_sent < MESSAGE_COUNT)The
IoTHubDeviceClient_LL_EnablePolicyConfigurationfunction enables policies for specific IoT Hub features that are configured via device twins. After you enablePOLICY_CONFIGURATION_DISTRIBUTED_TRACINGby using the extra line of code, the tracing behavior of the device will reflect distributed tracing changes made on the device twin.To keep the sample app running without using up all your quota, add a one-second delay at the end of the send message loop:
    else if (g_message_count_send_confirmations >= MESSAGE_COUNT)
    {
        // After all messages are all received stop running
        g_continueRunning = false;
    }

    IoTHubDeviceClient_LL_DoWork(device_ll_handle);
    ThreadAPI_Sleep(1000);

} while (g_continueRunning);
Compile and run
Go to the
iothub_ll_telemetry_sampleproject directory from the CMake directory (azure-iot-sdk-c/cmake) that you created earlier, and compile the sample:cd iothub_client/samples/iothub_ll_telemetry_sample cmake --build . --target iothub_ll_telemetry_sample --config DebugRun the application. The device sends telemetry that supports distributed tracing.
Debug/iothub_ll_telemetry_sample.exeKeep the app running. You can observe the messages being sent to IoT Hub in the console window.
For a client app that can receive sampling decisions from the cloud, try the iothub_devicetwin_sample.c sample in the distributed tracing sample repo.
Workaround for non-Microsoft clients
Implementing the distributed tracing feature without using the C SDK is more complex. We don't recommend it.
First, you must implement all the IoT Hub protocol primitives in your messages by following the developer guide Create and read IoT Hub messages. Then, edit the protocol properties in the MQTT and AMQP messages to add tracestate as a system property.
Specifically:
- For MQTT, add
%24.tracestate=timestamp%3d1539243209to the message topic. Replace1539243209with the creation time of the message in Unix time-stamp format. As an example, refer to the implementation in the C SDK. - For AMQP, add
key("tracestate")andvalue("timestamp=1539243209")as message annotation. For a reference implementation, see the uamqp_messaging.c file.
To control the percentage of messages that contain this property, implement logic to listen to cloud-initiated events such as twin updates.
Next steps
- To learn more about the general distributed tracing pattern in microservices, see Microservice architecture pattern: distributed tracing.