Note
Access to this page requires authorization. You can try signing in or changing directories.
Access to this page requires authorization. You can try changing directories.
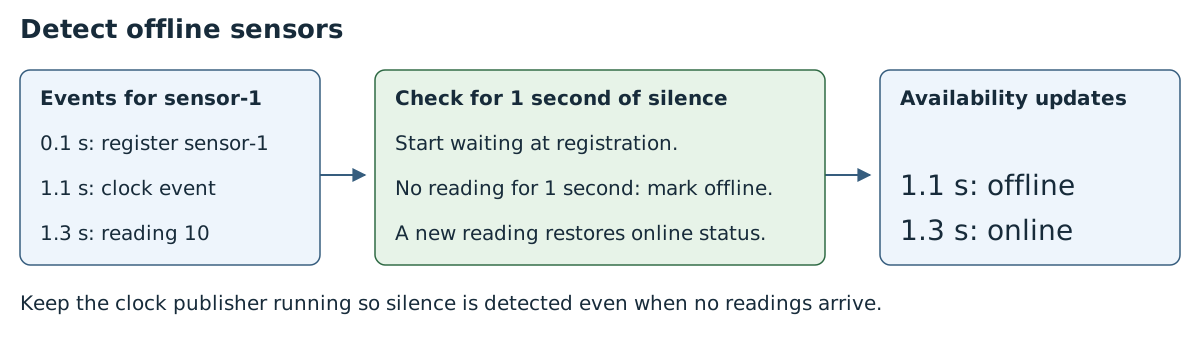
Find out when a sensor stops reporting. In this example, sensor-1 is marked offline after 1 second without a reading. When it sends a new reading, the graph reports it online again.
Register sensors you expect to hear from so you can also detect one that never sends its first reading. A clock publisher sends periodic events so the graph can check for silence even when no readings arrive. All examples are synthetic.
Prerequisites
Start with an existing Azure IoT Operations deployment and MQTT broker access. Follow Create a data flow graph to configure a data flow profile and MQTT endpoint.
Complete the Azure Samples deployment instructions for registry setup and single-instance deployment, then use the standalone sample setup. The examples use namespace azure-iot-operations. Configure the clock publisher.
The default data flow profile must already exist with one instance. The examples reuse the existing factory-mqtt MQTT endpoint and factory-artifacts registry endpoint for ghcr.io; they don't create profiles or endpoints.
The Azure CLI installed on your development machine. Check Available Azure CLI extensions for the minimum required version to use the azure-iot-ops extension. Use
az --versionto check your version andaz upgradeto update if necessary. For more information, see Install the Azure CLI.The Azure IoT Operations extension for the Azure CLI. Use the following command to add the extension or update it to the latest version:
az extension add --upgrade --name azure-iot-ops
The Azure CLI examples in this article use environment variables so that you can set each value once and then copy and paste the commands as-is. If you're using the Azure IoT Operations Codespaces environment from the quickstart, these variables are already set for you and you can skip this step. Otherwise, set the following environment variables in your shell before you run the commands.
The following scripts set the most commonly used environment variables:
| Environment variable | Description |
|---|---|
SUBSCRIPTION_ID |
The ID of the subscription that contains your Azure IoT Operations instance. |
RESOURCE_GROUP |
The name of the resource group that contains your Azure IoT Operations instance. |
AIO_INSTANCE_NAME |
The name of your Azure IoT Operations instance. To list your instances, run az iot ops list -o table. |
CLUSTER_NAME |
The name of the Azure Arc-enabled Kubernetes cluster that hosts your instance. |
LOCATION |
The Azure region to use for new resources, for example eastus. |
SUBSCRIPTION_ID=<subscription-id>
RESOURCE_GROUP=<resource-group-name>
AIO_INSTANCE_NAME=<instance-name>
CLUSTER_NAME=<cluster-name>
LOCATION=<region>
You only need to set the variables that this article uses. This article might use additional environment variables for resource names that you choose. The article explains how to set them where they're introduced.
Deploy the complete graph
This sample uses a custom artifact from ghcr.io. The operations experience supports custom artifacts from Azure Container Registry (ACR), not GHCR. Use the Azure CLI or Bicep tab to deploy this example unchanged.
To use the operations experience, first copy the graph and its referenced WASM modules to ACR and configure a registry endpoint. Then follow Deploy custom WASM transforms for the supported UI workflow. The graph configuration in the Azure CLI tab shows the required topics and settings.
The source subscribes to factory/availability-readings, factory/availability-registers, and factory/availability-ticks. The destination is factory/availability. Allow sensor publishers to publish only readings. Reserve registration and clock topics for authorized publishers; sensor identities must not have permission to publish on them.
The example marks a watched sensor offline when a reading or clock event detects at least 1 second of silence.
Register an expected sensor
Using an identity authorized to register sensors, publish this message on factory/availability-registers:
{"kind":"register","assetId":"sensor-1"}
Registration starts the timeout when it arrives. Repeating it doesn't restart the timeout. Clock events alone don't register an unknown sensor.
The clock publisher can register configured assets and send events on factory/availability-ticks during silence:
{"kind":"tick","assetId":"sensor-1"}
A complete telemetry reading on factory/availability-readings is:
{"kind":"reading","assetId":"sensor-1","messageId":"r0","sequence":0,"value":10}
Keep messageId unique per asset, including across restarts, and sequence strictly increasing. Retry a message only with its original ID, sequence, and unchanged content. Accepted readings refresh last-seen time; retries and rejected readings don't.
Check timeout and recovery
Example timeline:
| Elapsed time | Input | Result |
|---|---|---|
0.1 s |
Register sensor-1 |
Start waiting for its first reading |
0.5 s |
Repeat registration | Preserve the original start time |
1.1 s |
Clock event | Offline after 1 second of silence |
1.2 s |
Clock event | Stay offline; no repeated transition |
1.3 s |
First reading, r0, sequence 0, value 10 |
Online with reason: "recovered" |
1.4 s |
r1, sequence 1, value 11 |
Refresh last-seen time |
2 s |
Identical retry of r1 |
Preserve last-seen time |
2.4 s |
r2, sequence 2, value 12, with no intervening clock event |
Batch: offline, then online recovered |
The first offline output is:
{"kind":"availability","assetId":"sensor-1","state":"offline","reason":"timeout","emittedAtMs":1100,"lastSeenAtMs":null,"elapsedMs":1000}
The processor computes time fields automatically; the example shows milliseconds relative to the timeline's start, while live timestamps use processing-clock epoch milliseconds. lastSeenAtMs is null until a reading arrives. Recovery at 1.3 seconds sets it to 1300; elapsedMs: 1200 records the silence since registration.
If a valid reading arrives at or after timeout before a clock event detects the silence, both transitions are delivered together:
{"kind":"batch","records":[{"kind":"availability","assetId":"sensor-1","state":"offline","reason":"timeout","emittedAtMs":2400,"lastSeenAtMs":1400,"elapsedMs":1000},{"kind":"availability","assetId":"sensor-1","state":"online","reason":"recovered","emittedAtMs":2400,"lastSeenAtMs":2400,"elapsedMs":1000}]}
Consumers must handle both individual availability records and this batch of records. For a new sensor, a first accepted reading before timeout produces state: "online", reason: "firstReading", and elapsedMs: 0, with or without prior registration.
Advanced: timing and restart
The graph checks elapsed processing time when a clock event or reading arrives. Detection latency includes clock-event frequency, delivery, and processing delay. Monitor the clock publisher and its route. The optional sampledAt property records measurement time; the timeout uses processing time.
A restart clears registrations, last-seen times, availability state, and retry tracking. The sample clock publisher repeats registration to restore monitoring for configured sensors without postponing existing timeouts. If you use another publisher, register the expected sensors again after restart. To stop monitoring a retired sensor, remove it from the registration list and coordinate a restart.