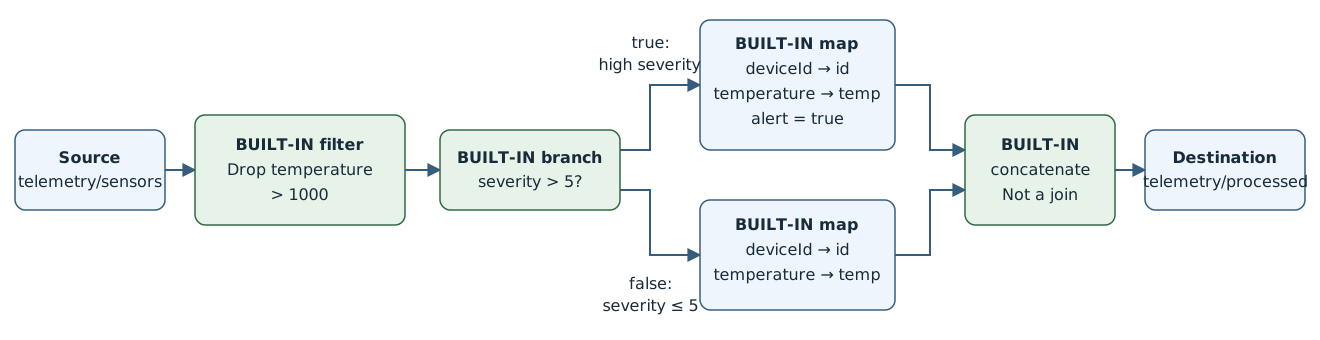
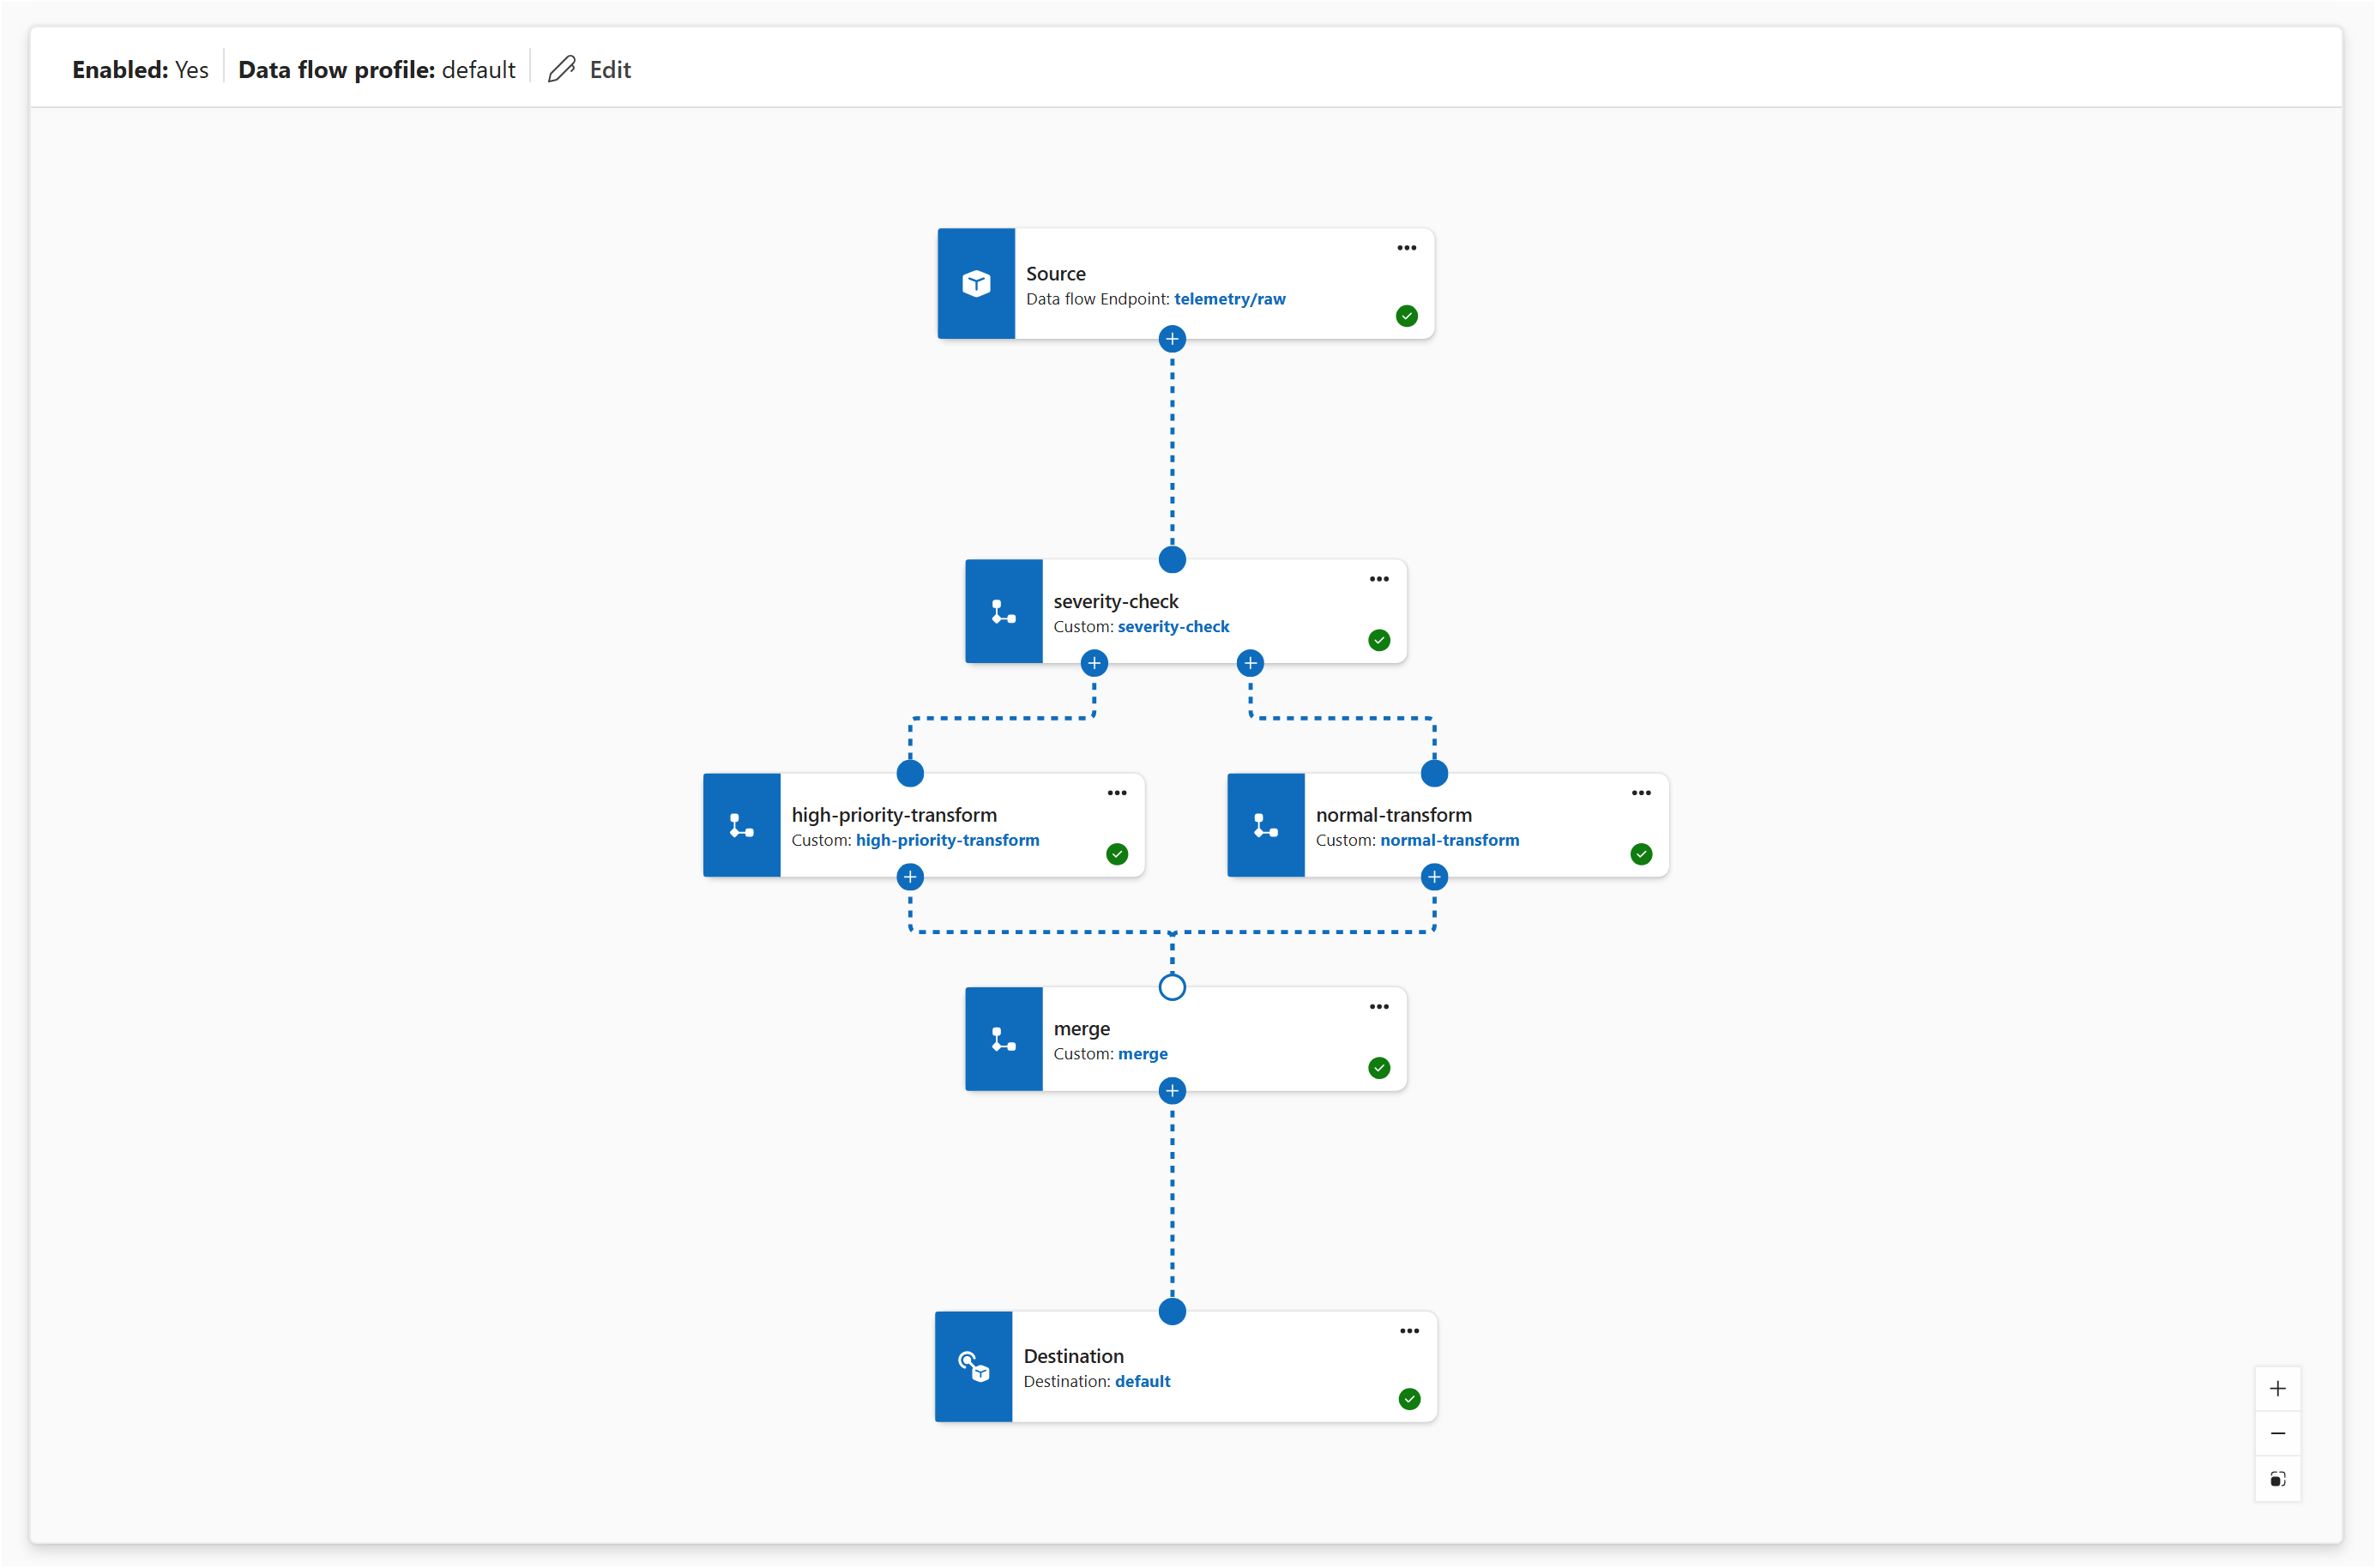
Save the following graph properties as graph.json. Transform rules are escaped JSON strings. The Kubernetes tab shows the same rules in a readable form.
{
  "mode": "Enabled",
  "nodes": [
    {
      "nodeType": "Source",
      "name": "sensors",
      "sourceSettings": {
        "endpointRef": "default",
        "dataSources": [
          "telemetry/sensors"
        ]
      }
    },
    {
      "nodeType": "Graph",
      "name": "remove-bad-data",
      "graphSettings": {
        "registryEndpointRef": "default",
        "artifact": "azureiotoperations/graph-dataflow-filter:1.1.0",
        "configuration": [
          {
            "key": "rules",
            "value": "{\"filter\":[{\"inputs\":[\"temperature\"],\"expression\":\"$1 > 1000\",\"description\":\"Drop impossible temperature readings\"}]}"
          }
        ]
      }
    },
    {
      "nodeType": "Graph",
      "name": "severity-check",
      "graphSettings": {
        "registryEndpointRef": "default",
        "artifact": "azureiotoperations/graph-dataflow-branch:1.1.0",
        "configuration": [
          {
            "key": "rules",
            "value": "{\"branch\":{\"inputs\":[\"severity\"],\"expression\":\"$1 > 5\",\"description\":\"Route high-severity messages\"}}"
          }
        ]
      }
    },
    {
      "nodeType": "Graph",
      "name": "alert-transform",
      "graphSettings": {
        "registryEndpointRef": "default",
        "artifact": "azureiotoperations/graph-dataflow-map:1.0.0",
        "configuration": [
          {
            "key": "rules",
            "value": "{\"map\":[{\"inputs\":[\"deviceId\"],\"output\":\"id\"},{\"inputs\":[\"temperature\"],\"output\":\"temp\"},{\"inputs\":[],\"output\":\"alert\",\"expression\":\"true\"}]}"
          }
        ]
      }
    },
    {
      "nodeType": "Graph",
      "name": "normal-transform",
      "graphSettings": {
        "registryEndpointRef": "default",
        "artifact": "azureiotoperations/graph-dataflow-map:1.0.0",
        "configuration": [
          {
            "key": "rules",
            "value": "{\"map\":[{\"inputs\":[\"deviceId\"],\"output\":\"id\"},{\"inputs\":[\"temperature\"],\"output\":\"temp\"}]}"
          }
        ]
      }
    },
    {
      "nodeType": "Graph",
      "name": "merge",
      "graphSettings": {
        "registryEndpointRef": "default",
        "artifact": "azureiotoperations/graph-dataflow-concatenate:1.0.0"
      }
    },
    {
      "nodeType": "Destination",
      "name": "output",
      "destinationSettings": {
        "endpointRef": "default",
        "dataDestination": "telemetry/processed"
      }
    }
  ],
  "nodeConnections": [
    {
      "from": {
        "name": "sensors"
      },
      "to": {
        "name": "remove-bad-data"
      }
    },
    {
      "from": {
        "name": "remove-bad-data"
      },
      "to": {
        "name": "severity-check"
      }
    },
    {
      "from": {
        "name": "severity-check.output.true"
      },
      "to": {
        "name": "alert-transform"
      }
    },
    {
      "from": {
        "name": "severity-check.output.false"
      },
      "to": {
        "name": "normal-transform"
      }
    },
    {
      "from": {
        "name": "alert-transform"
      },
      "to": {
        "name": "merge"
      }
    },
    {
      "from": {
        "name": "normal-transform"
      },
      "to": {
        "name": "merge"
      }
    },
    {
      "from": {
        "name": "merge"
      },
      "to": {
        "name": "output"
      }
    }
  ]
}
Apply the config file through Azure Resource Manager. This approach avoids an azure-iot-ops extension validation issue with named outputs such as severity-check.output.true.
INSTANCE_ID=$(az iot ops show --name "$AIO_INSTANCE_NAME" --resource-group "$RESOURCE_GROUP" --query id --output tsv)
EXTENDED_LOCATION=$(az iot ops show --name "$AIO_INSTANCE_NAME" --resource-group "$RESOURCE_GROUP" --query extendedLocation --output json)
GRAPH_ID="$INSTANCE_ID/dataflowProfiles/default/dataflowGraphs/alert-routing"

az rest --method put \
  --url "$GRAPH_ID?api-version=2026-07-01" \
  --body "{\"extendedLocation\":$EXTENDED_LOCATION,\"properties\":$(cat graph.json)}"

az resource wait --created --ids "$GRAPH_ID" --api-version 2026-07-01
Save this template as main.bicep. It references the existing instance, custom location, and default profile.
param aioInstanceName string
param customLocationName string

resource aioInstance 'Microsoft.IoTOperations/instances@2026-07-01' existing = {
  name: aioInstanceName
}

resource customLocation 'Microsoft.ExtendedLocation/customLocations@2021-08-31-preview' existing = {
  name: customLocationName
}

resource defaultDataflowProfile 'Microsoft.IoTOperations/instances/dataflowProfiles@2026-07-01' existing = {
  parent: aioInstance
  name: 'default'
}

resource dataflowGraph 'Microsoft.IoTOperations/instances/dataflowProfiles/dataflowGraphs@2026-07-01' = {
  name: 'alert-routing'
  parent: defaultDataflowProfile
  extendedLocation: {
    name: customLocation.id
    type: 'CustomLocation'
  }
  properties: {
    mode: 'Enabled'
    nodes: [
      {
        nodeType: 'Source'
        name: 'sensors'
        sourceSettings: {
          endpointRef: 'default'
          dataSources: [ 'telemetry/sensors' ]
        }
      }
      {
        nodeType: 'Graph'
        name: 'remove-bad-data'
        graphSettings: {
          registryEndpointRef: 'default'
          artifact: 'azureiotoperations/graph-dataflow-filter:1.1.0'
          configuration: [
            {
              key: 'rules'
              value: '{"filter":[{"inputs":["temperature"],"expression":"$1 > 1000","description":"Drop impossible temperature readings"}]}'
            }
          ]
        }
      }
      {
        nodeType: 'Graph'
        name: 'severity-check'
        graphSettings: {
          registryEndpointRef: 'default'
          artifact: 'azureiotoperations/graph-dataflow-branch:1.1.0'
          configuration: [
            {
              key: 'rules'
              value: '{"branch":{"inputs":["severity"],"expression":"$1 > 5","description":"Route high-severity messages"}}'
            }
          ]
        }
      }
      {
        nodeType: 'Graph'
        name: 'alert-transform'
        graphSettings: {
          registryEndpointRef: 'default'
          artifact: 'azureiotoperations/graph-dataflow-map:1.0.0'
          configuration: [
            {
              key: 'rules'
              value: '{"map":[{"inputs":["deviceId"],"output":"id"},{"inputs":["temperature"],"output":"temp"},{"inputs":[],"output":"alert","expression":"true"}]}'
            }
          ]
        }
      }
      {
        nodeType: 'Graph'
        name: 'normal-transform'
        graphSettings: {
          registryEndpointRef: 'default'
          artifact: 'azureiotoperations/graph-dataflow-map:1.0.0'
          configuration: [
            {
              key: 'rules'
              value: '{"map":[{"inputs":["deviceId"],"output":"id"},{"inputs":["temperature"],"output":"temp"}]}'
            }
          ]
        }
      }
      {
        nodeType: 'Graph'
        name: 'merge'
        graphSettings: {
          registryEndpointRef: 'default'
          artifact: 'azureiotoperations/graph-dataflow-concatenate:1.0.0'
        }
      }
      {
        nodeType: 'Destination'
        name: 'output'
        destinationSettings: {
          endpointRef: 'default'
          dataDestination: 'telemetry/processed'
        }
      }
    ]
    nodeConnections: [
      { from: { name: 'sensors' }, to: { name: 'remove-bad-data' } }
      { from: { name: 'remove-bad-data' }, to: { name: 'severity-check' } }
      { from: { name: 'severity-check.output.true' }, to: { name: 'alert-transform' } }
      { from: { name: 'severity-check.output.false' }, to: { name: 'normal-transform' } }
      { from: { name: 'alert-transform' }, to: { name: 'merge' } }
      { from: { name: 'normal-transform' }, to: { name: 'merge' } }
      { from: { name: 'merge' }, to: { name: 'output' } }
    ]
  }
}
Deploy the template to the instance's resource group. Set CUSTOM_LOCATION_NAME to the existing custom location name.
az deployment group create \
  --resource-group $RESOURCE_GROUP \
  --template-file main.bicep \
  --parameters aioInstanceName=$AIO_INSTANCE_NAME customLocationName=$CUSTOM_LOCATION_NAME
Important
The use of Kubernetes deployment manifests isn't supported in production environments and should only be used for debugging and testing.
apiVersion: connectivity.iotoperations.azure.com/v1
kind: DataflowGraph
metadata:
  name: alert-routing
  namespace: azure-iot-operations
spec:
  profileRef: default
  mode: Enabled
  nodes:
    - nodeType: Source
      name: sensors
      sourceSettings:
        endpointRef: default
        dataSources:
          - telemetry/sensors

    - nodeType: Graph
      name: remove-bad-data
      graphSettings:
        registryEndpointRef: default
        artifact: azureiotoperations/graph-dataflow-filter:1.1.0
        configuration:
          - key: rules
            value: |
              {
                "filter": [
                  {
                    "inputs": ["temperature"],
                    "expression": "$1 > 1000",
                    "description": "Drop impossible temperature readings"
                  }
                ]
              }

    - nodeType: Graph
      name: severity-check
      graphSettings:
        registryEndpointRef: default
        artifact: azureiotoperations/graph-dataflow-branch:1.1.0
        configuration:
          - key: rules
            value: |
              {
                "branch": {
                  "inputs": ["severity"],
                  "expression": "$1 > 5",
                  "description": "Route high-severity messages"
                }
              }

    - nodeType: Graph
      name: alert-transform
      graphSettings:
        registryEndpointRef: default
        artifact: azureiotoperations/graph-dataflow-map:1.0.0
        configuration:
          - key: rules
            value: |
              {
                "map": [
                  { "inputs": ["deviceId"], "output": "id" },
                  { "inputs": ["temperature"], "output": "temp" },
                  { "inputs": [], "output": "alert", "expression": "true" }
                ]
              }

    - nodeType: Graph
      name: normal-transform
      graphSettings:
        registryEndpointRef: default
        artifact: azureiotoperations/graph-dataflow-map:1.0.0
        configuration:
          - key: rules
            value: |
              {
                "map": [
                  { "inputs": ["deviceId"], "output": "id" },
                  { "inputs": ["temperature"], "output": "temp" }
                ]
              }

    - nodeType: Graph
      name: merge
      graphSettings:
        registryEndpointRef: default
        artifact: azureiotoperations/graph-dataflow-concatenate:1.0.0

    - nodeType: Destination
      name: output
      destinationSettings:
        endpointRef: default
        dataDestination: telemetry/processed

  nodeConnections:
    - from: { name: sensors }
      to: { name: remove-bad-data }
    - from: { name: remove-bad-data }
      to: { name: severity-check }
    - from: { name: severity-check.output.true }
      to: { name: alert-transform }
    - from: { name: severity-check.output.false }
      to: { name: normal-transform }
    - from: { name: alert-transform }
      to: { name: merge }
    - from: { name: normal-transform }
      to: { name: merge }
    - from: { name: merge }
      to: { name: output }