Tutorial: Calculate overall equipment effectiveness
Important
Azure IoT Operations Preview – enabled by Azure Arc is currently in PREVIEW. You shouldn't use this preview software in production environments.
See the Supplemental Terms of Use for Microsoft Azure Previews for legal terms that apply to Azure features that are in beta, preview, or otherwise not yet released into general availability.
Contoso supplies baked goods to the Puget Sound area in the northwest United States. It has bakeries in Seattle and Redmond.
Contoso wants to measure the overall equipment effectiveness (OEE) and power consumption of its production lines. Contoso plans to use these measurements to identify ineffective areas in the manufacturing process, and use the insights to improve the bottom line for the business.
To achieve these goals, Contoso needs to:
- Gather data from multiple data sources.
- Down sample, transform, and join the data at the edge.
- Write the clean data to the cloud for viewing on dashboards and for analysis.
Prerequisites
Follow the steps in Quickstart: Deploy Azure IoT Operations Preview to an Arc-enabled Kubernetes cluster to install Azure IoT operations Preview on an Azure Arc-enabled Kubernetes cluster.
A Microsoft Fabric subscription. You can sign up for a free Microsoft Fabric (Preview) Trial. In your Microsoft Fabric subscription, ensure that the following settings are enabled for your tenant:
- Allow service principals to use Power BI APIs
- Users can access data stored in OneLake with apps external to Fabric
To learn more, see Microsoft Fabric > About tenant settings.
Download and sign into Power BI Desktop.
Prepare your environment
Complete the following tasks to prepare your environment:
Create a service principal
To create a service principal that gives your pipeline access to your Microsoft Fabric workspace:
Use the following Azure CLI command to create a service principal.
az ad sp create-for-rbac --name <YOUR_SP_NAME>The output of this command includes an
appId,displayName,password, andtenant. Make a note of these values to use when you configure access to your Fabric workspace, create a secret, and configure a pipeline destination:{ "appId": "<app-ID>", "displayName": "<name>", "password": "<client-secret>", "tenant": "<tenant-ID>" }
Grant access to your Microsoft Fabric workspace
Navigate to the Microsoft Fabric Power BI experience.
To ensure you can see the Manage access option in your Microsoft Fabric workspace, create a new workspace:
Select Workspaces in the left navigation bar, then select New Workspace:
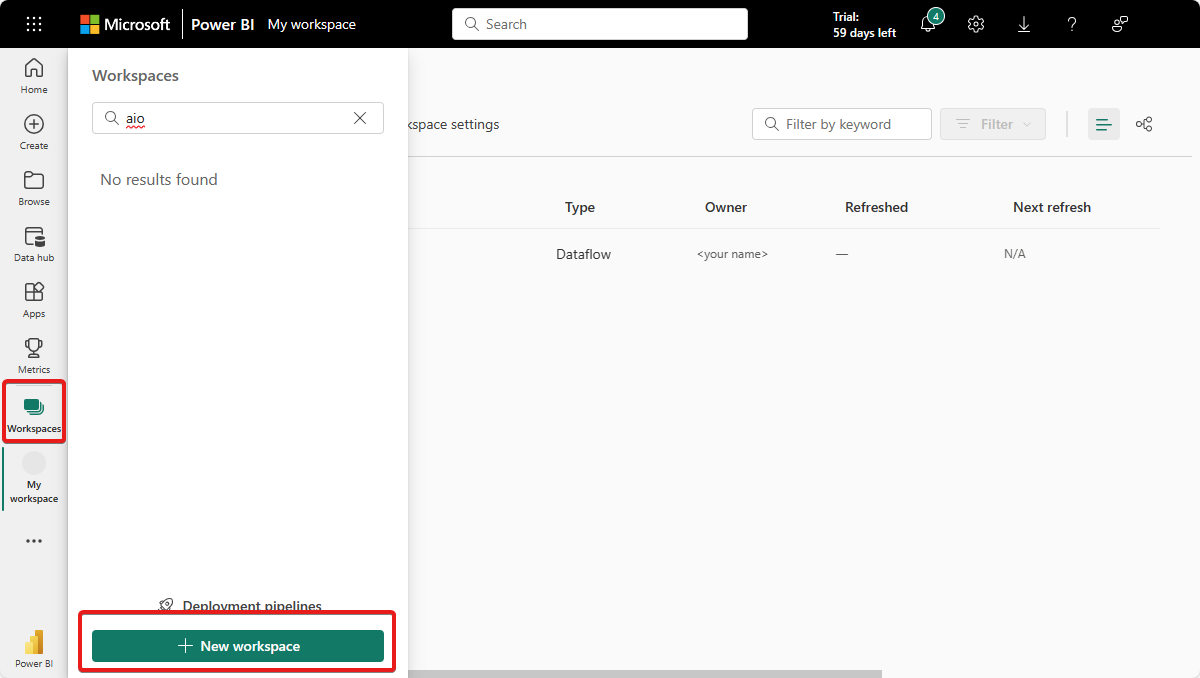
Enter a name for your workspace, such as Your name AIO workspace, and select Apply.
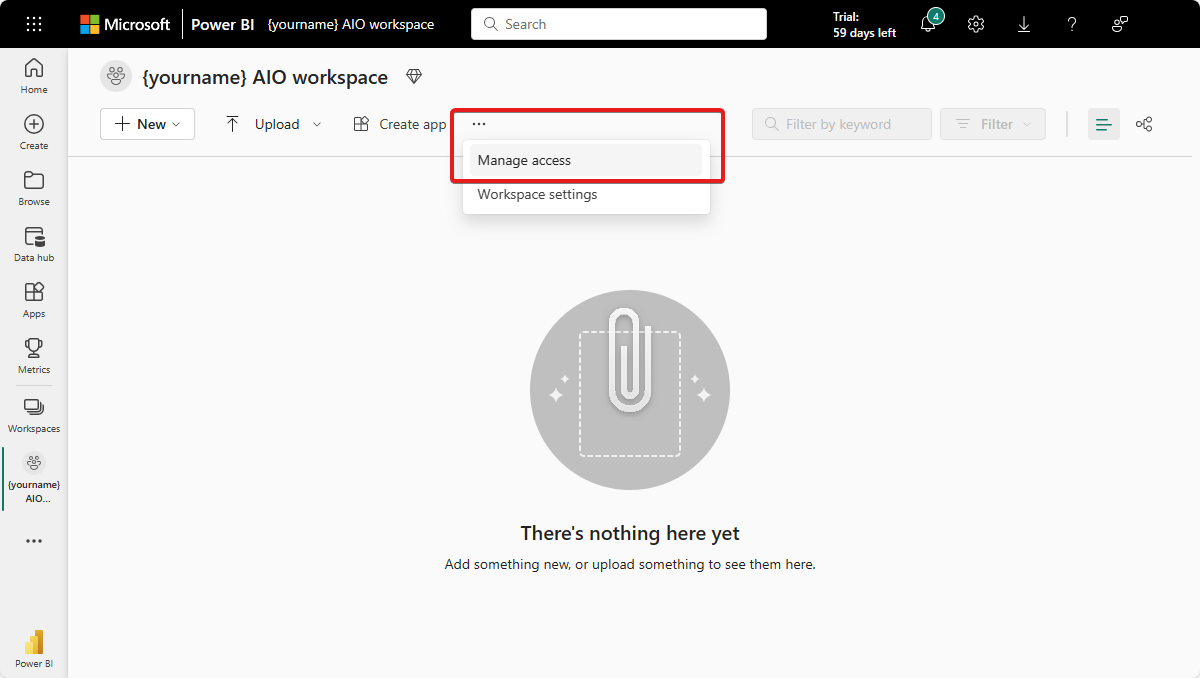
To grant the service principal access to your Microsoft Fabric workspace:
In your Microsoft Fabric workspace, select Manage access:
Select Add people or groups, then paste the display name of the service principal from the previous step and grant at least Contributor access to it.
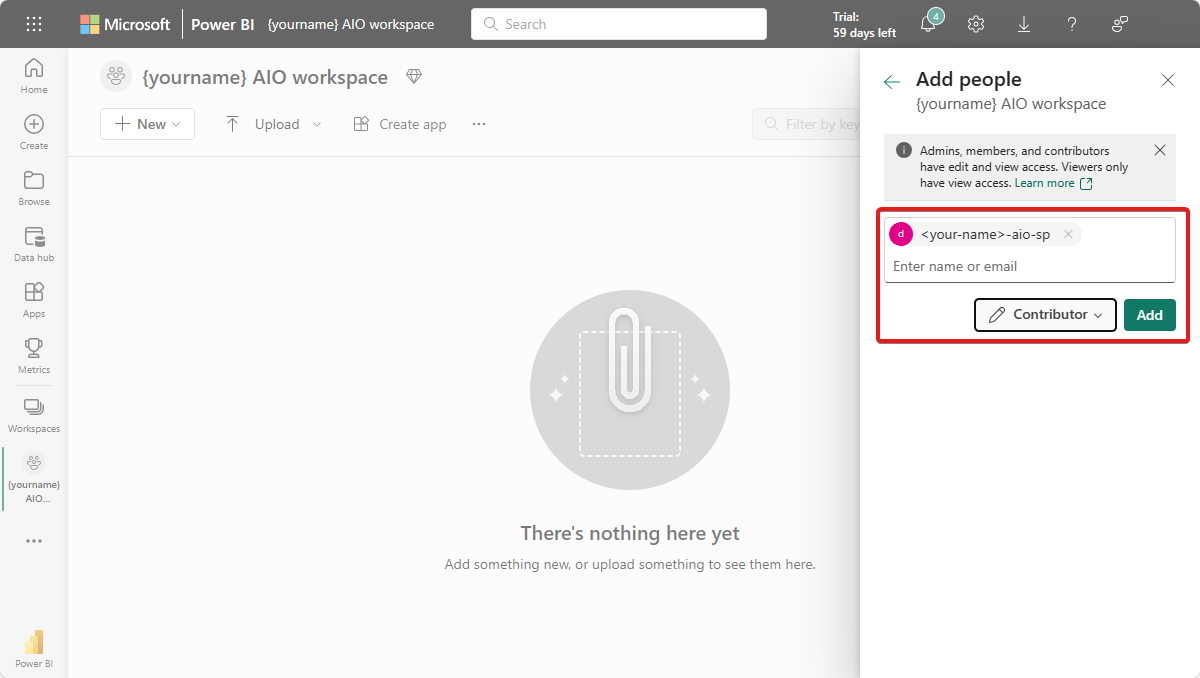
Select Add to grant the service principal contributor permissions in the workspace.
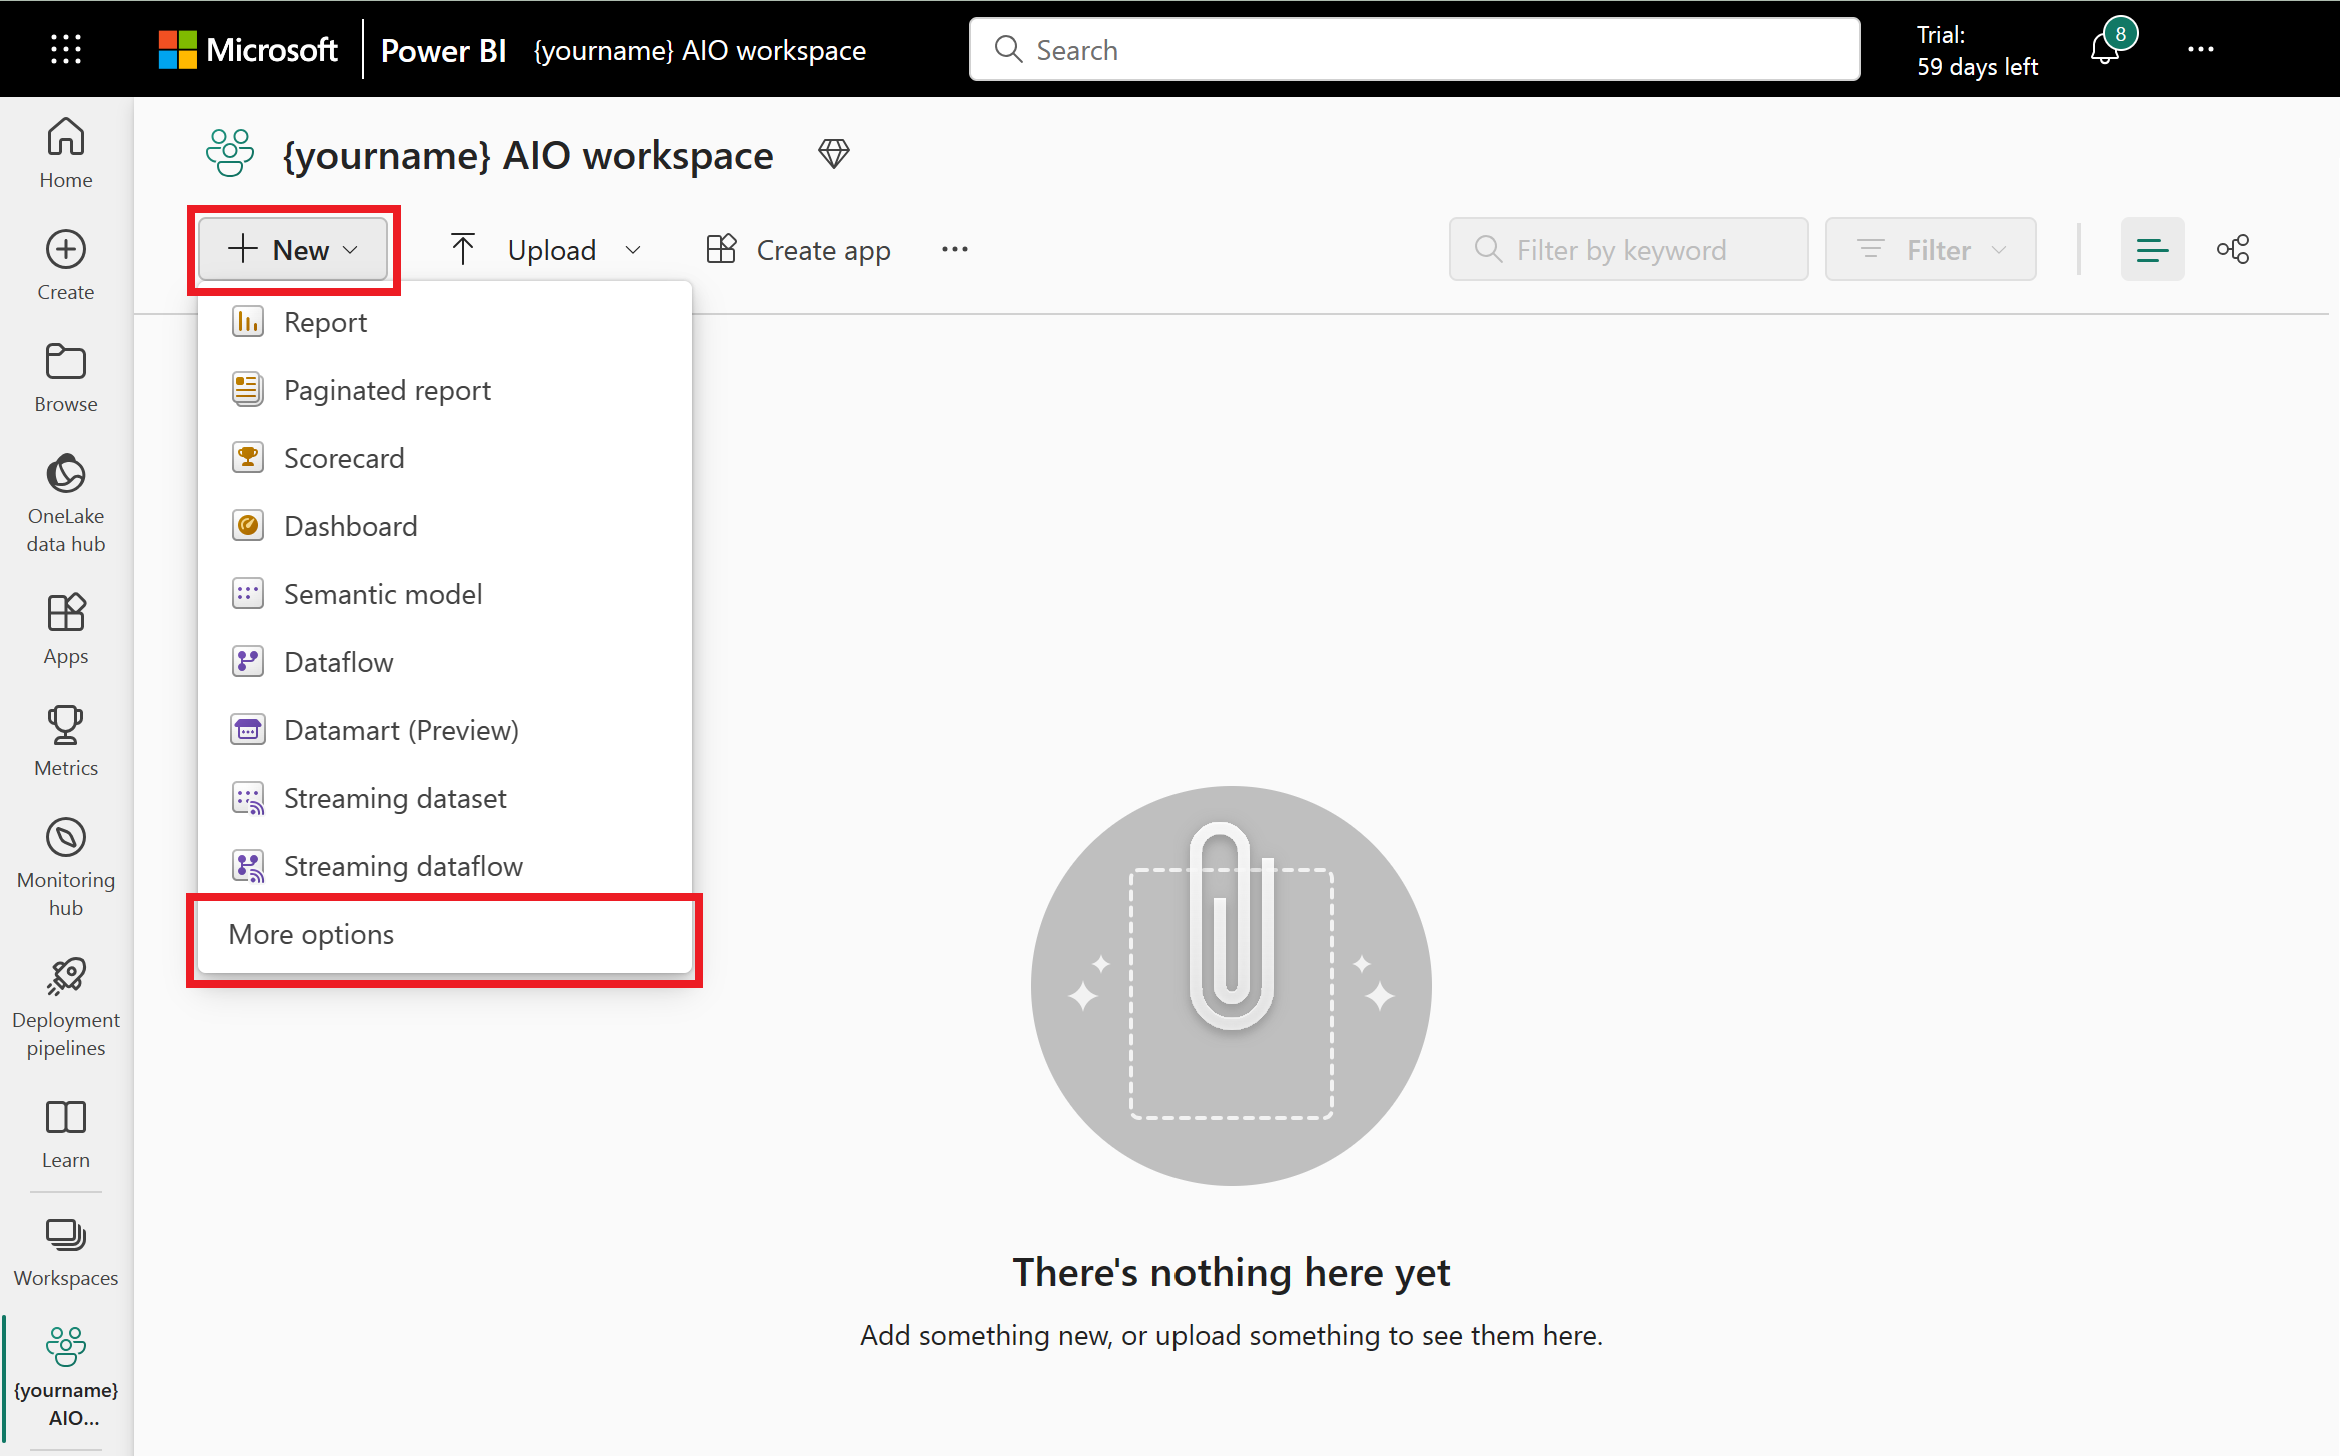
Create a lakehouse
Create a lakehouse in your Microsoft Fabric workspace:
Select New and More options, then choose Lakehouse from the list.
Enter a name for your lakehouse, such as yourname_mq_destination, and select Create.
Make a note of your workspace ID and lakehouse ID, you need them later. You can find these values in the URL that you use to access your lakehouse:
https://msit.powerbi.com/groups/<your-workspace-ID>/lakehouses/<your-lakehouse-ID>?experience=data-engineering
Add a secret to your cluster
To access the lakehouse from a Data Processor pipeline, you need to enable your cluster to access the service principal details you created earlier. You need to configure your Azure Key Vault with the service principal details so that the cluster can retrieve them.
Use the following command to add a secret to your Azure Key Vault that contains the client secret you made a note of when you created the service principal. You created the Azure Key Vault in the Deploy Azure IoT Operations to an Arc-enabled Kubernetes cluster quickstart:
az keyvault secret set --vault-name <your-key-vault-name> --name AIOFabricSecret --value <client-secret>
To add the secret reference to your Kubernetes cluster, edit the aio-default-spc secretproviderclass resource:
Enter the following command on the machine where your cluster is running to edit the aio-default-spc
secretproviderclassresource. The YAML configuration for the resource opens in your default editor:kubectl edit secretproviderclass aio-default-spc -n azure-iot-operationsAdd a new
AIOFabricSecretentry to the array of secrets for your new Azure Key Vault secret. Use thespecsection in the following example for reference:# Edit the object below. Lines beginning with a '#' will be ignored, # and an empty file will abort the edit. If an error occurs while saving this file will be # reopened with the relevant failures. # apiVersion: secrets-store.csi.x-k8s.io/v1 kind: SecretProviderClass metadata: creationTimestamp: "2023-11-16T11:43:31Z" generation: 2 name: aio-default-spc namespace: azure-iot-operations resourceVersion: "89083" uid: cda6add7-3931-47bd-b924-719cc862ca29 spec: parameters: keyvaultName: <this is the name of your key vault> objects: | array: - | objectName: azure-iot-operations objectType: secret objectVersion: "" - | objectName: AIOFabricSecret objectType: secret objectVersion: "" tenantId: <this is your tenant ID> usePodIdentity: "false" provider: azureSave the changes and exit from the editor.
The CSI driver updates secrets by using a polling interval, therefore the new secret isn't available to the pod until the next polling interval. To update a component immediately, restart the pods for the component. For example, to restart the Data Processor component, run the following commands:
kubectl delete pod aio-dp-reader-worker-0 -n azure-iot-operations
kubectl delete pod aio-dp-runner-worker-0 -n azure-iot-operations
Understand the scenario and data
In this tutorial, you simulate the Redmond and Seattle sites. Each site has two production lines producing baked goods:

To calculate OEE for Contoso, you need data from three data sources: production line assets, production data, and operator data. The following sections provide detail on each of these.
Production line assets
Production line assets have sensors that generate measurements as the baked goods are produced. Contoso production lines contain assembly, test, and packaging assets. As a product moves through each asset, the system captures measurements of values that can affect the final product. The system sends these measurements to Azure IoT MQ Preview.
In this tutorial, the industrial data simulator simulates the assets that generate measurements. A manifest file determines how the industrial data simulator generates the measurements.
The following snippet shows an example of the measurements the simulator sends to MQ:
[
  {
    "DataSetWriterName": "SLine1_1_SLine1_1__asset_0",
    "Payload": {
      "SLine1_1__assembly_assetID__0": {
        "SourceTimestamp": "2023-12-03T16:54:47.380769575-08:00",
        "Value": "Line2_Assembly"
      },
      "SLine1_1__assembly_energyconsumed__0": {
        "SourceTimestamp": "2023-12-03T16:54:47.380791333-08:00",
        "Value": 9.183789847893975
      },
      "SLine1_1__assembly_humidity__0": {
        "SourceTimestamp": "2023-12-03T16:54:47.380757125-08:00",
        "Value": 0
      },
      "SLine1_1__assembly_lastcycletime__0": {
        "SourceTimestamp": "2023-12-03T16:54:47.380716706-08:00",
        "Value": 4936
      },
      "SLine1_1__assembly_machinestatus__0": {
        "SourceTimestamp": "2023-12-03T16:54:47.380723952-08:00",
        "Value": 1
      },
      "SLine1_1__assembly_plannedProductionTime__0": {
        "SourceTimestamp": "2023-12-03T16:54:47.380840281-08:00",
        "Value": 14048
      },
      "SLine1_1__assembly_pressure__0": {
        "SourceTimestamp": "2023-12-03T16:54:47.380744766-08:00",
        "Value": 0
      },
      "SLine1_1__assembly_qualityStatus__0": {
        "SourceTimestamp": "2023-12-03T16:54:47.380720317-08:00",
        "Value": 1
      },
      "SLine1_1__assembly_sound__0": {
        "SourceTimestamp": "2023-12-03T16:54:47.380766621-08:00",
        "Value": 118.33789847893975
      },
      "SLine1_1__assembly_speed__0": {
        "SourceTimestamp": "2023-12-03T16:54:47.38075408-08:00",
        "Value": 2.4584474619734937
      },
      "SLine1_1__assembly_temperature__0": {
        "SourceTimestamp": "2023-12-03T16:54:47.380731522-08:00",
        "Value": 109.16894923946987
      },
      "SLine1_1__assembly_totalOperatingTime__0": {
        "SourceTimestamp": "2023-12-03T16:54:47.380831078-08:00",
        "Value": 14038
      },
      "SLine1_1__assembly_vibration__0": {
        "SourceTimestamp": "2023-12-03T16:54:47.380749267-08:00",
        "Value": 54.584474619734934
      }
    },
    "SequenceNumber": 11047,
    "Timestamp": "2023-12-03T16:54:47.380696886-08:00"
  }
]
Production data
Production data is product-related data, such as the type of baked good and the customer. Production data is accessible from an HTTP endpoint.
Each production line produces goods for a specific customer. The following snippet shows an example of production data:
[
  {
    "Line": "Line1",
    "Shift": 1,
    "ProductId": "Bagel",
    "Site": "Redmond",
    "Customer": "Contoso"
  },
  {
    "Line": "Line2",
    "Shift": 1,
    "ProductId": "Donut",
    "Site": "Redmond",
    "Customer": "Contoso"
  }
]
Operator data
Operator data is operator-related data, such as the name of operator, the shift, and any performance targets. Operator data is accessible from an HTTP endpoint.
There are three shifts in each 24-hour facility. An operator supervises each shift. Each operator has performance targets based on their past performance. The following snippet shows an example of production data:
[
  {
    "Shift": 0,
    "Operator": "Bob",
    "PerformanceTarget": 45,
    "PackagedProductTarget": 12960
  },
  {
    "Shift": 1,
    "Operator": "Anne",
    "PerformanceTarget": 60,
    "PackagedProductTarget": 17280
  },
  {
    "Shift": 2,
    "Operator": "Cameron",
    "PerformanceTarget": 50,
    "PackagedProductTarget": 14400
  }
]
Set up the data simulator and HTTP call-out samples
Run the following command to deploy the industrial data simulator to your cluster with the configuration for this sample:
kubectl apply -f https://raw.githubusercontent.com/Azure-Samples/explore-iot-operations/main/samples/industrial-data-simulator/manifests/oee/manifest.yml
Caution
The previous configuration adds an insecure BrokerListener to connect the simulator to the MQTT broker. Don't use this configuration in a production environment.
Run the following command to deploy the gRPC callout service that returns simulated production and operator data to your cluster:
kubectl apply -f https://raw.githubusercontent.com/Azure-Samples/explore-iot-operations/main/samples/http-grpc-callout/manifest.yml
Run the following command to deploy the shift calculation simulator to your cluster:
kubectl apply -f https://raw.githubusercontent.com/Azure-Samples/explore-iot-operations/main/samples/http-grpc-shift-calculation/manifest.yml
Transform and enrich the data
To transform the measurement data from the three data sources at the edge and send it to Microsoft Fabric where you can calculate OEE, you use Data Processor pipelines.
In this tutorial, you create three pipelines:
The production data reference pipeline ingests production data from the HTTP endpoint and writes it to the production-data reference dataset.
The operation data reference pipeline ingests operations data from the HTTP endpoint and writes it to the operation-data reference dataset.
The process pipeline ingests the sensor measurements from the production line assets, and transforms and enriches the measurement data with data from the two reference datasets. The pipeline then writes the transformed and enriched data to a Microsoft Fabric lakehouse.
Production data reference pipeline
To make the production data available to the enrichment stage in the process pipeline, you save the production data in a reference dataset.
To create the production-data dataset:
Navigate to the Azure IoT Operations (preview) portal in your browser and sign in with your Microsoft Entra ID credentials.
Select Get started and navigate to Azure IoT Operations instances to see a list of the clusters you have access to.
Select your instance and then select Data pipelines. Here, you can author the Data Processor pipelines, create the reference data sets, and deploy them to your Azure Arc-enabled Kubernetes cluster.
Select Reference datasets. Then select Create reference dataset.
Enter the information from the following table, which includes adding one property.
Field Value Name production-dataProperty Name 1 LineProperty Path 1 .LinePrimary Key 1 YesSelect Create. It can take up to a minute for the reference dataset to deploy to the Kubernetes cluster and show up in the portal.
To create the production-data-reference pipeline that ingests the data from the HTTP endpoint and then saves it in the production-data dataset:
Navigate back to Data pipelines and select Create pipeline.
Select the title of the pipeline on the top left corner, rename it to production-data-reference, and Apply the change.
In the pipeline diagram, select Configure source and then select HTTP Endpoint. Use the information from the following table to configure it:
Field Value Name HTTP Endpoint - production dataMethod GETURL http://callout-svc-http:3333/productionDataAuthentication NoneData format JSONAPI Request – Request Body {}Request Interval 1mSelect Apply.
Select Add stages and then select Delete to delete the middle stage.
To connect the source and destination stages, select the red dot at the bottom of the source stage and drag it to the red dot at the top of the destination stage.
Select Add destination and then select Reference datasets.
Name the stage Reference dataset - production-data.
Select production-data in the Dataset field, and select Apply.
Select Save to save the pipeline.
You now have a pipeline that queries an HTTP endpoint for production reference data to store in a reference dataset.
Operations data reference pipeline
To make the operations data available to the enrichment stage in the process pipeline, you save the production data in a reference dataset.
To create the operations-data dataset:
In the Azure IoT Operations (preview) portal, make sure you're still on the Data pipelines page.
Select Reference datasets. Then select Create reference dataset.
Enter the information from the following table, which includes adding one property.
Field Value Name operations-dataProperty Name 1 ShiftProperty Path 1 .ShiftPrimary Key 1 YesSelect Create. It can take up to a minute for the reference dataset to deploy to the Kubernetes cluster and show up in the portal.
To create the operations-data-reference pipeline that ingests the data from the HTTP endpoint and then saves it in the operations-data dataset:
Navigate back to Data pipelines and select Create pipeline.
Select the title of the pipeline on the top left corner, rename it to operations-data-reference, and Apply the change.
In the pipeline diagram, select Configure source and then select HTTP Endpoint. Use the information from the following table to configure it:
Field Value Name HTTP Endpoint - operations dataMethod GETURL http://callout-svc-http:3333/operatorDataAuthentication NoneData format JSONAPI Request – Request Body {}Request Interval 1mSelect Apply.
Select Add stages and then select Delete to delete the middle stage.
To connect the source and destination stages, select the red dot at the bottom of the source stage and drag it to the red dot at the top of the destination stage.
Select Add destination and then select Reference datasets.
Name the stage Reference dataset - operations-data.
Select operations-data in the Dataset field, select Apply.
Select Save to save the pipeline.
You now have a pipeline that queries an HTTP endpoint for operations reference data to store in a reference dataset.
Process pipeline
Now you can build the process pipeline that:
- Ingests the sensor measurements from the production line assets.
- Transforms and enriches the sensor measurements with data from the two reference datasets.
To create the oee-process-pipeline pipeline:
Navigate back to Data pipelines and select Create pipeline.
Select the title of the pipeline on the top left corner, rename it to oee-process-pipeline, and Apply the change.
Use the Sources tab on the left to select MQ as the source, and select the source from the pipeline diagram to open its configuration. Use the information from the following table to configure it:
Field Value Name MQ - Contoso/#Broker tls://aio-mq-dmqtt-frontend:8883Topic Contoso/#Data format JSONSelect Apply. The simulated production line assets send measurements to the MQ broker in the cluster. This input stage configuration subscribes to all the topics under the
Contosotopic in the MQ broker.Use the Stages list on the left to add a Transform stage after the source stage. Name the stage Transform - flatten message and add the following JQ expressions. This transform creates a flat, readable view of the message and extracts the
LineandSiteinformation from the topic:.payload[0].Payload |= with_entries(.value |= .Value) | .payload |= .[0] | .payload.Payload |= with_entries ( if (.key | startswith("SLine")) then .key |= capture("^SLine[0-9]+_[0-9]+__[a-zA-Z0-9]+_(?<name>.+)__0").name elif (.key | startswith("RLine")) then .key |= capture("^RLine[0-9]+_[0-9]+__[a-zA-Z0-9]+_(?<name>.+)__0").name else . end ) | .payload.Payload.Line = (.topic | split("/")[2]) | .payload.Payload.Site = (.topic | split("/")[1])Select Apply.
Use the Stages list on the left to add an Aggregate stage after the transform stage and select it. Name the stage Aggregate - down sample measurements. In this pipeline, you use the aggregate stage to down sample the measurements from the production line assets. You configure the stage to aggregate data for 10 seconds. Then for the relevant data, calculate the average or pick the latest value. Select the Advanced tab in the aggregate stage and paste in the following configuration:
{
  "displayName": "Aggregate - 1b84f9",
  "type": "processor/aggregate@v1",
  "next": [
      "output"
  ],
  "viewOptions": {
      "position": {
          "x": -624,
          "y": 304
      }
  },
  "window": {
      "type": "tumbling",
      "size": "10s"
  },
  "properties": [
      {
          "function": "last",
          "inputPath": ".payload.Payload.assetID",
          "outputPath": ".payload.AssetID"
      },
      {
          "function": "count",
          "inputPath": ".",
          "outputPath": ".payload.TotalGoodsProduced"
      },
      {
          "function": "average",
          "inputPath": ".payload.Payload.temperature",
          "outputPath": ".payload.TemperatureAvg"
      },
      {
          "function": "average",
          "inputPath": ".payload.Payload.energyconsumed",
          "outputPath": ".payload.EnergyConsumedAvg"
      },
      {
          "function": "last",
          "inputPath": ".payload.Payload.lastcycletime",
          "outputPath": ".payload.LastCycletime"
      },
      {
          "function": "average",
          "inputPath": ".payload.Payload.pressure",
          "outputPath": ".payload.PressureAvg"
      },
      {
          "function": "average",
          "inputPath": ".payload.Payload.vibration",
          "outputPath": ".payload.VibrationAvg"
      },
      {
          "function": "average",
          "inputPath": ".payload.Payload.humidity",
          "outputPath": ".payload.HumidityAvg"
      },
      {
          "function": "average",
          "inputPath": ".payload.Payload.speed",
          "outputPath": ".payload.SpeedAvg"
      },
      {
          "function": "last",
          "inputPath": ".systemProperties.timestamp",
          "outputPath": ".payload.timestamp"
      },
      {
          "function": "last",
          "inputPath": ".topic",
          "outputPath": ".topic"
      },
      {
          "function": "last",
          "inputPath": ".payload.Payload.totalOperatingTime",
          "outputPath": ".payload.TotalOperatingTime"
      },
      {
          "function": "last",
          "inputPath": ".payload.Payload.Line",
          "outputPath": ".payload.Line"
      },
      {
          "function": "last",
          "inputPath": ".payload.Payload.plannedProductionTime",
          "outputPath": ".payload.PlannedProductionTime"
      },
      {
          "function": "sum",
          "inputPath": ".payload.Payload.qualityStatus",
          "outputPath": ".payload.TotalGoodUnitsProduced"
      },
      {
          "function": "last",
          "inputPath": ".payload.Payload.Site",
          "outputPath": ".payload.Site"
      }
  ]
}
Select Apply.
Use the Stages list on the left to add a Call out HTTP stage after the aggregate stage and select it. This HTTP call out stage calls a custom module running in the Kubernetes cluster that exposes an HTTP API. The module calculates the shift based on the current time. To configure the stage, select Add condition and enter the information from the following table:
Field Value Name Call out HTTP - Fetch shift dataMethod POSTURL http://shift-svc-http:3333Authentication NoneAPI Request - Data format JSONAPI Request - Path .payloadAPI Response - Data format JSONAPI Response - Path .payloadSelect Apply.
Use the Stages list on the left to add an Enrich stage after the HTTP call out stage and select it. This stage enriches the measurements from the simulated production line assets with reference data from the operations-data dataset. This stage uses a condition to determine when to add the operations data. Open the Add condition options and add the following information:
Field Value Name Enrich - Operations dataDataset operations-dataOutput path .payload.operatorDataInput path .payload.shiftProperty ShiftOperator Key matchSelect Apply.
Use the Stages list on the left to add another Enrich stage after the first enrich stage and select it. This stage enriches the measurements from the simulated production line assets with reference data from the production-data dataset. Open the Add condition options and add the following information:
Field Value Name Enrich - Production dataDataset production-dataOutput path .payload.productionDataInput path .payload.LineProperty LineOperator Key matchSelect Apply.
Use the Stages list on the left to add another Transform stage after the enrich stage and select it. Name the stage Transform - flatten enrichment data. Add the following JQ expressions:
.payload |= . + .operatorData |
.payload |= . + .productionData |
.payload |= del(.operatorData) |
.payload |= del(.productionData)
Select Apply. These JQ expressions move the enrichment data to the same flat path as the real-time data. This structure makes it easy to export the data to Microsoft Fabric.
Use the Destinations tab on the left to select MQ for the output stage, and select the stage. Add the following configuration:
Field Value Name MQ - Oee-processed-outputBroker tls://aio-mq-dmqtt-frontend:8883Topic Oee-processed-outputData format JSONPath .payloadSelect Apply.
Review your pipeline diagram to make sure all the stages are present and connected. It should look like the following:
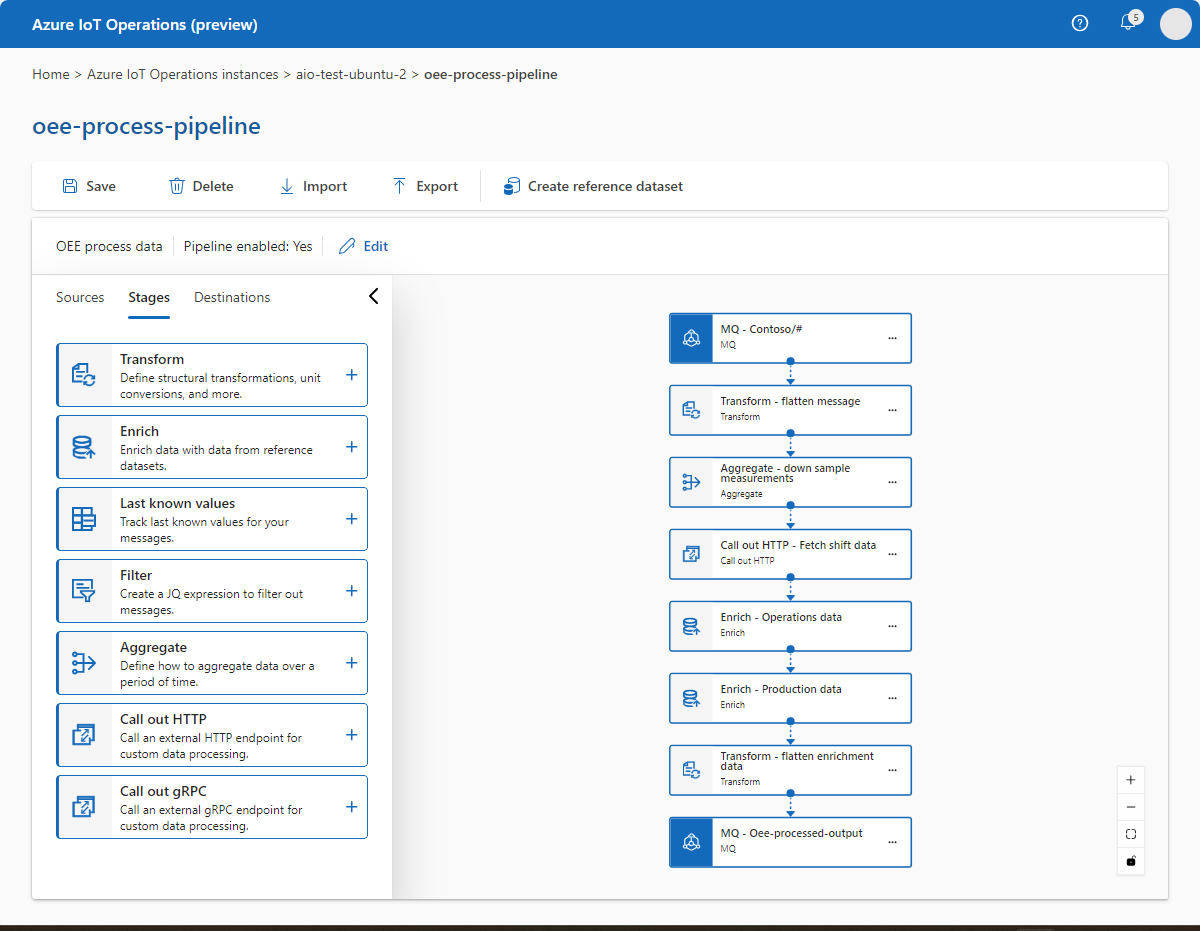
To save your pipeline, select Save. It may take a few minutes for the pipeline to deploy to your cluster, so make sure it's finished before you proceed.

View processed data
Verify data is flowing to the MQTT broker by using the mqttui tool. In this example, you run the mqttui tool inside your Kubernetes cluster:
Run the following command to deploy a pod that includes the mqttui and mosquitto tools that are useful for interacting with the MQ broker in the cluster:
kubectl apply -f https://raw.githubusercontent.com/Azure-Samples/explore-iot-operations/main/samples/quickstarts/mqtt-client.yamlThe following snippet shows the YAML file that you applied:
# Important: do not use in production environments
# Creates a pod with mosquitto-clients and mqttui utilities in your cluster
apiVersion: v1
kind: Pod
metadata:
  name: mqtt-client
  # The namespace must match the IoT MQ BrokerListener's namespace
  # Otherwise use the long hostname: aio-mq-dmqtt-frontend.azure-iot-operations.svc.cluster.local
  namespace: azure-iot-operations
spec:
  # Use the "mqtt-client" service account which comes with default deployment
  # Otherwise create it with `kubectl create serviceaccount mqtt-client -n azure-iot-operations`
  serviceAccountName: mqtt-client
  containers:
    # Install mosquitto and mqttui utilities on Alpine linux
  - image: alpine
    name: mqtt-client
    command: ["sh", "-c"]
    args: ["apk add mosquitto-clients mqttui && sleep infinity"]
    volumeMounts:
    - name: mq-sat
      mountPath: /var/run/secrets/tokens
    - name: trust-bundle
      mountPath: /var/run/certs
  volumes:
  - name: mq-sat
    projected:
      sources:
      - serviceAccountToken:
          path: mq-sat
          audience: aio-mq # Must match audience in BrokerAuthentication
          expirationSeconds: 86400
  - name: trust-bundle
    configMap:
      name: aio-ca-trust-bundle-test-only # Default root CA cert
Caution
This configuration isn't secure. Don't use this configuration in a production environment.
When the mqtt-client pod is running, run the following command to create a shell environment in the pod you created:
kubectl exec --stdin --tty mqtt-client -n azure-iot-operations -- shAt the shell in the mqtt-client pod, run the following command to connect to the MQ broker using the mqttui tool:
mqttui -b mqtts://aio-mq-dmqtt-frontend:8883 -u '$sat' --password $(cat /var/run/secrets/tokens/mq-sat) --insecure
Look for Oee-processed-output in the list of topics and verify that it's receiving messages. The following example shows a message in the Oee-processed-output topic:
{
  "payload": {
    "AssetID": "Line2_Assembly",
    "Customer": "Contoso",
    "EnergyConsumedAvg": 7.749793095563527,
    "HumidityAvg": 0,
    "LastCycletime": 4989,
    "Line": "Line2",
    "Manufacturer": "Northwind",
    "Operator": "Anne",
    "PackagedProductTarget": 17280,
    "PerformanceTarget": 60,
    "PlannedProductionTime": 15100,
    "PressureAvg": 0,
    "ProductId": "Donut",
    "Shift": 2,
    "Site": "Seattle",
    "SpeedAvg": 2.099948273890882,
    "TemperatureAvg": 101.99896547781763,
    "TotalGoodUnitsProduced": 3,
    "TotalGoodsProduced": 10,
    "TotalOperatingTime": 14799,
    "VibrationAvg": 50.99948273890882,
    "shift": 2,
    "timestamp": "2023-12-04T00:55:39.410Z"
  },
  "topic": "Contoso/Seattle/Line2/Assembly/SLine2_1"
}
Now that the data has passed through the pipeline stages, the data:
- Is easier to read.
- Is better organized.
- Has no unnecessary fields.
- Is enriched with information such as the manufacturer, customer, product ID, operator, and shift.
Next, you can send your transformed and enriched measurement data to Microsoft Fabric for further analysis and to create visualizations of the OEE of your production lines.
Send data to Microsoft Fabric
The next step is to create a Data Processor pipeline that sends the transformed and enriched measurement data to your Microsoft Fabric lakehouse.
Back in the Azure IoT Operations (preview) portal, navigate to Data pipelines and select Create pipeline.
Select the title of the pipeline on the top left corner, rename it to oee-fabric, and Apply the change.
In the pipeline diagram, select Configure source and then select MQ. Use the information from the following table to configure it:
Field Value Name MQ - Oee-processed-outputBroker tls://aio-mq-dmqtt-frontend:8883Topic Oee-processed-outputData Format JSONSelect Apply.
Select Add stages and then select Delete to delete the middle stage.
To connect the source and destination stages, select the red dot at the bottom of the source stage and drag it to the red dot at the top of the destination stage.
Select Add destination and then select Fabric Lakehouse. Select the Advanced tab and then paste in the following configuration:
{
  "displayName": "Fabric Lakehouse - OEE table",
  "type": "output/fabric@v1",
  "viewOptions": {
    "position": {
      "x": 0,
      "y": 432
    }
  },
  "workspace": "",
  "lakehouse": "",
  "table": "OEE",
  "columns": [
    {
      "name": "Timestamp",
      "type": "timestamp",
      "path": ".timestamp"
    },
    {
      "name": "AssetID",
      "type": "string"
    },
    {
      "name": "Line",
      "type": "string"
    },
    {
      "name": "Operator",
      "type": "string"
    },
    {
      "name": "PackagedProductTarget",
      "type": "integer"
    },
    {
      "name": "PerformanceTarget",
      "type": "integer"
    },
    {
      "name": "ProductId",
      "type": "string"
    },
    {
      "name": "Shift",
      "type": "integer"
    },
    {
      "name": "Site",
      "type": "string"
    },
    {
      "name": "Customer",
      "type": "string"
    },
    {
      "name": "AverageEnergy",
      "type": "double",
      "path": ".EnergyConsumedAvg"
    },
    {
      "name": "AverageHumidity",
      "type": "double",
      "path": ".HumidityAvg"
    },
    {
      "name": "PlannedProductionTime",
      "type": "integer",
      "path": ".PlannedProductionTime"
    },
    {
      "name": "AveragePressure",
      "type": "double",
      "path": ".PressureAvg"
    },
    {
      "name": "AverageSpeed",
      "type": "double",
      "path": ".SpeedAvg"
    },
    {
      "name": "AverageTemperature",
      "type": "double",
      "path": ".TemperatureAvg"
    },
    {
      "name": "TotalGoodUnitsProduced",
      "type": "integer",
      "path": ".TotalGoodUnitsProduced"
    },
    {
      "name": "TotalUnitsProduced",
      "type": "integer",
      "path": ".TotalGoodsProduced"
    },
    {
      "name": "TotalOperatingTime",
      "type": "integer",
      "path": ".TotalOperatingTime"
    },
    {
      "name": "Manufacturer",
      "type": "string"
    }
  ],
  "authentication": {
    "type": "servicePrincipal",
    "tenantId": "",
    "clientId": "",
    "clientSecret": ""
  },
  "batch": {
    "path": ".payload"
  }
}
Then navigate to the Basic tag and fill in the following fields by using the information you made a note of previously:
Field Value Tenant ID The tenant ID you made a note of when you created the service principal. Client ID The app ID you made a note of when you created the service principal. Secret AIOFabricSecretWorkspace The Microsoft Fabric workspace ID you made a note of when you created the lakehouse. Lakehouse The Microsoft Fabric lakehouse ID you made a note of when you created the lakehouse. Select Apply.
To save your pipeline, select Save. It may take a few minutes for the pipeline to deploy to your cluster, so make sure it's finished before you proceed.
View your measurement data in Microsoft Fabric
In Microsoft Fabric, navigate to your lakehouse and select the OEE table. After a few minutes of receiving data from the pipeline, it looks like the following example:

Use Power BI to calculate OEE
Open Power BI Desktop and sign in.
Select Get data followed by Microsoft Fabric:

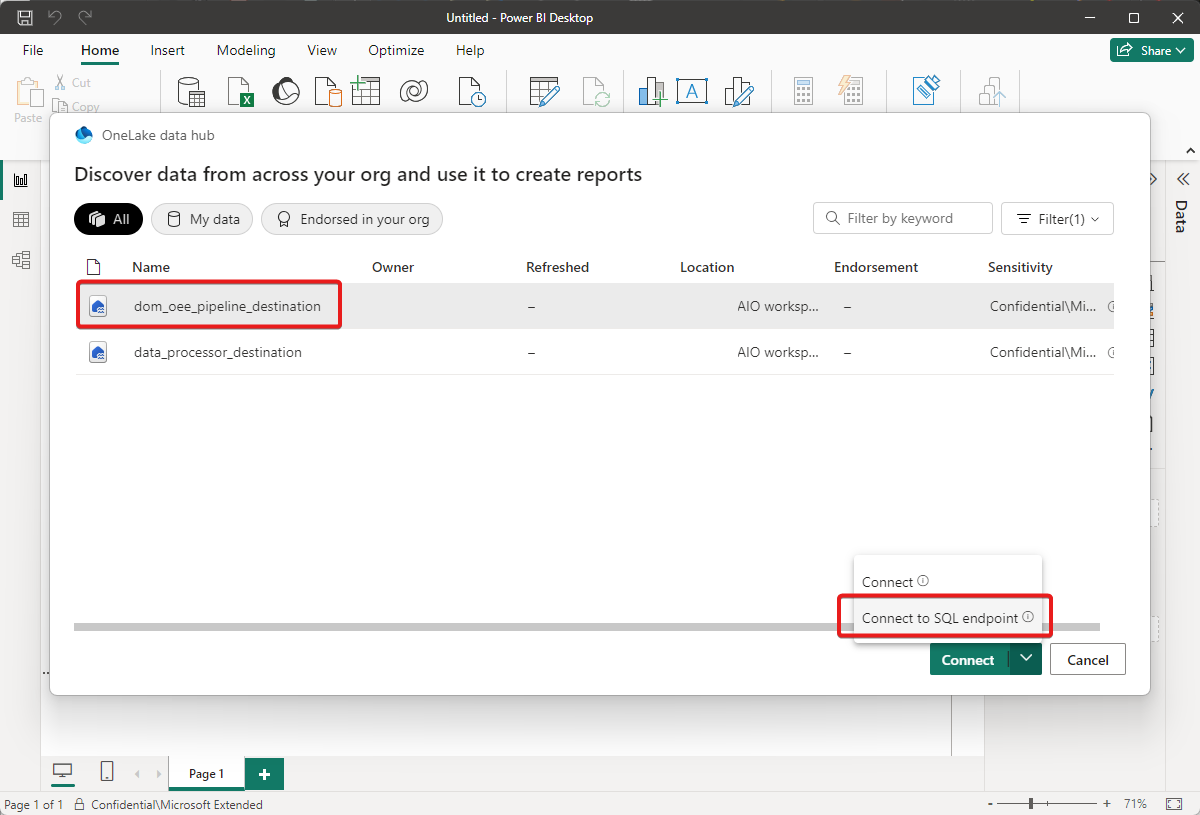
Select Lakehouses and then select Connect.
Select your lakehouse, and then Connect to SQL endpoint:
Check the box next to the OEE table and then select Load.
Select DirectQuery as the connection setting and then select OK.


You can now create measurements and tiles to display OEE for your production lines by using formulae such as:
OEE = Availability\*performance\*QualityPerformance = TotalUnitsProduced/10 (StandardProductionOutput)Availability = TotalOperatingTime/PlannedProductionTimeQuality = TotalGoodUnitsProduced/TotalUnitsProduced
Follow these steps to create some measures and use them to build a visualization dashboard.
From the top navigation plane, select New measure. Paste the following data analysis expression into the main text field:
OEE = DIVIDE(AVERAGE(OEE[TotalUnitsProduced]),10) * DIVIDE(AVERAGE(OEE[TotalOperatingTime]),AVERAGE(OEE[PlannedProductionTime])) * (DIVIDE(AVERAGE(OEE[TotalGoodUnitsProduced]), AVERAGE(OEE[TotalUnitsProduced])))Change the measure Name to OEE, the Format to Percentage, and the number of decimals to
2.Select the checkmark to save your measurement:
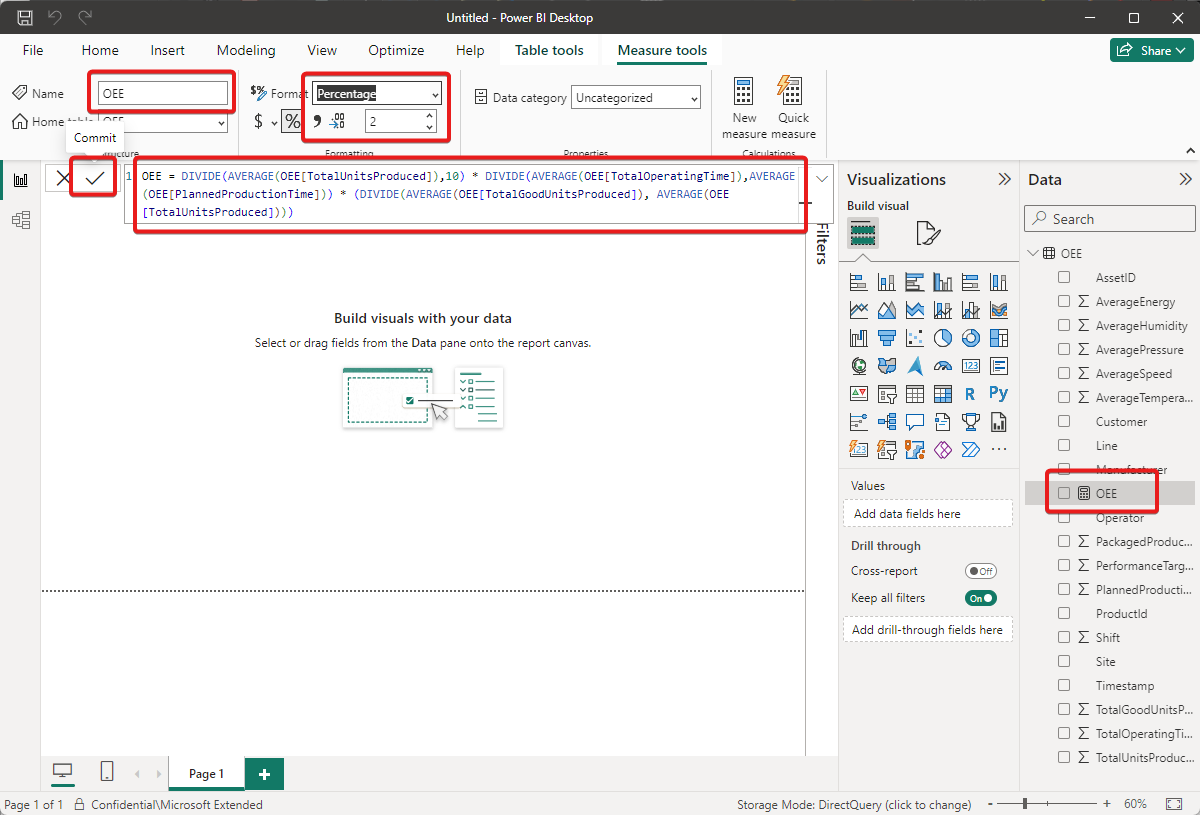
The new OEE measurement now appears in the Data panel on the right.
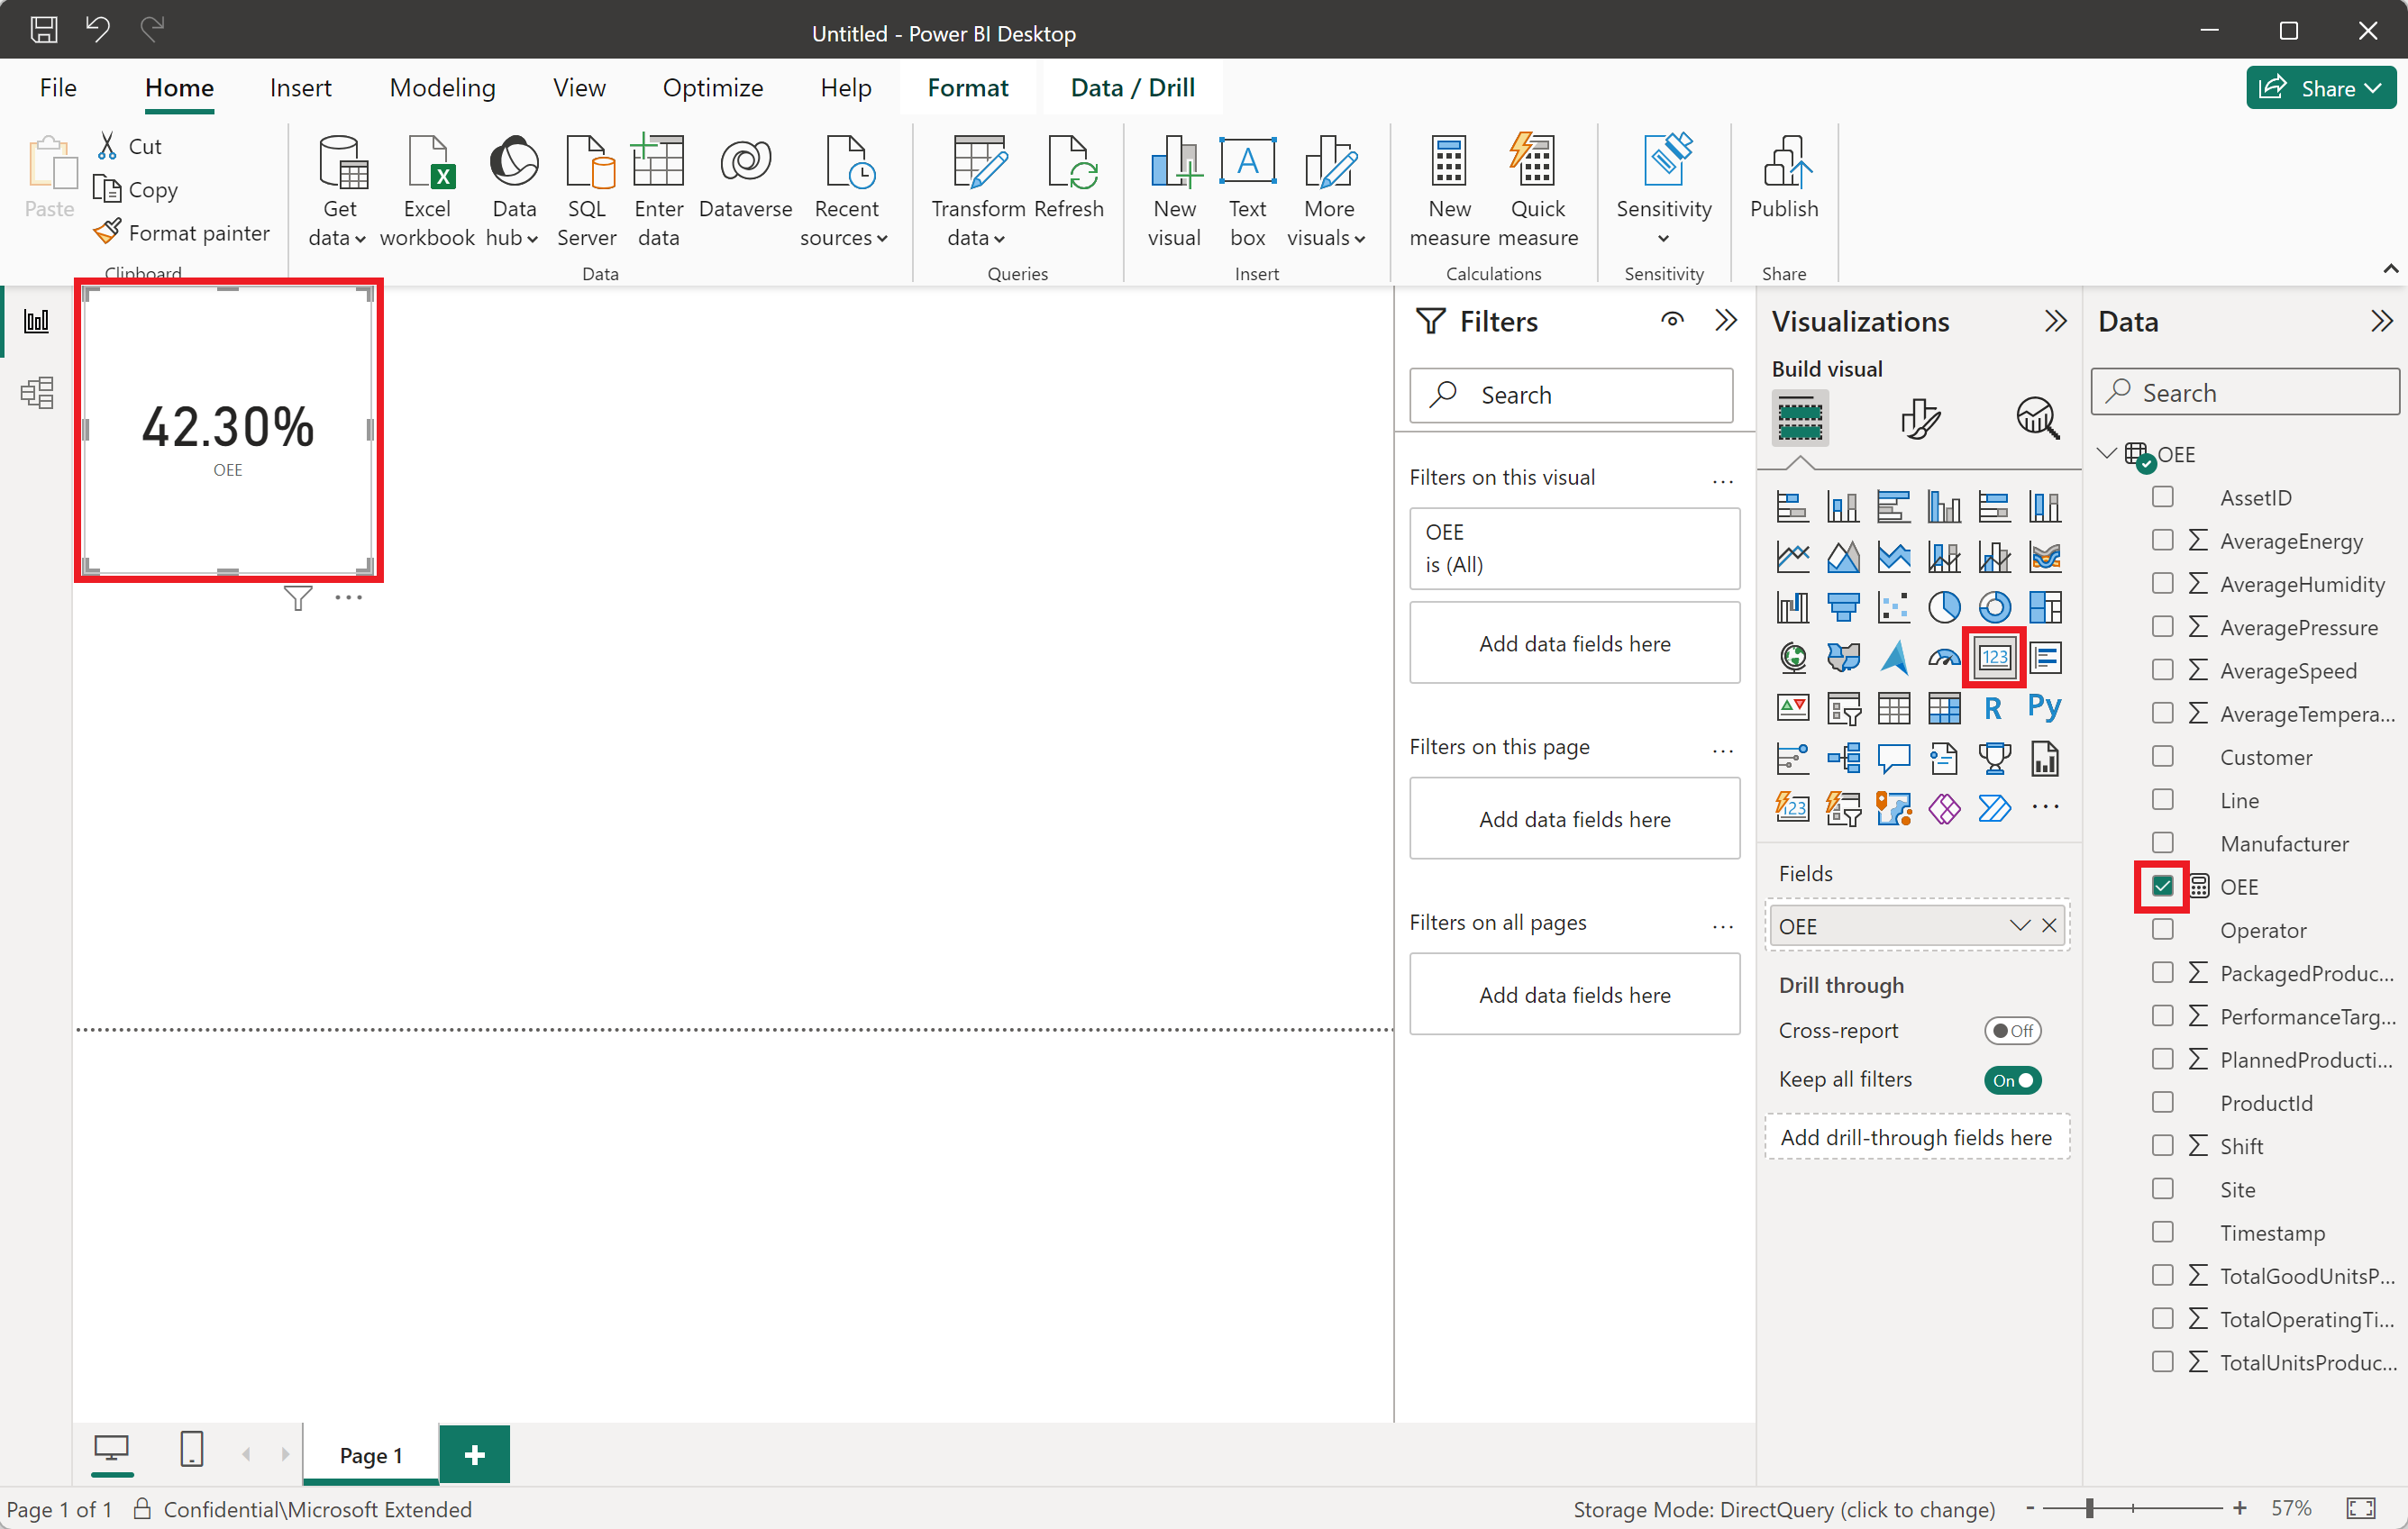
Select the Card icon in the Visualizations panel and select the OEE measurement you created. You're now using the most recent asset measurement data to calculate OEE for your production lines.
Repeat these steps to create new measurements and their corresponding tiles for Performance, Availability, and Quality. Use the following data analysis expressions:
Performance = DIVIDE(AVERAGE(OEE[TotalUnitsProduced]),10)Availability = DIVIDE(AVERAGE(OEE[TotalOperatingTime]),AVERAGE(OEE[PlannedProductionTime]))Quality = (DIVIDE(AVERAGE(OEE[TotalGoodUnitsProduced]), AVERAGE(OEE[TotalUnitsProduced])))

Your dashboard looks like the following example:

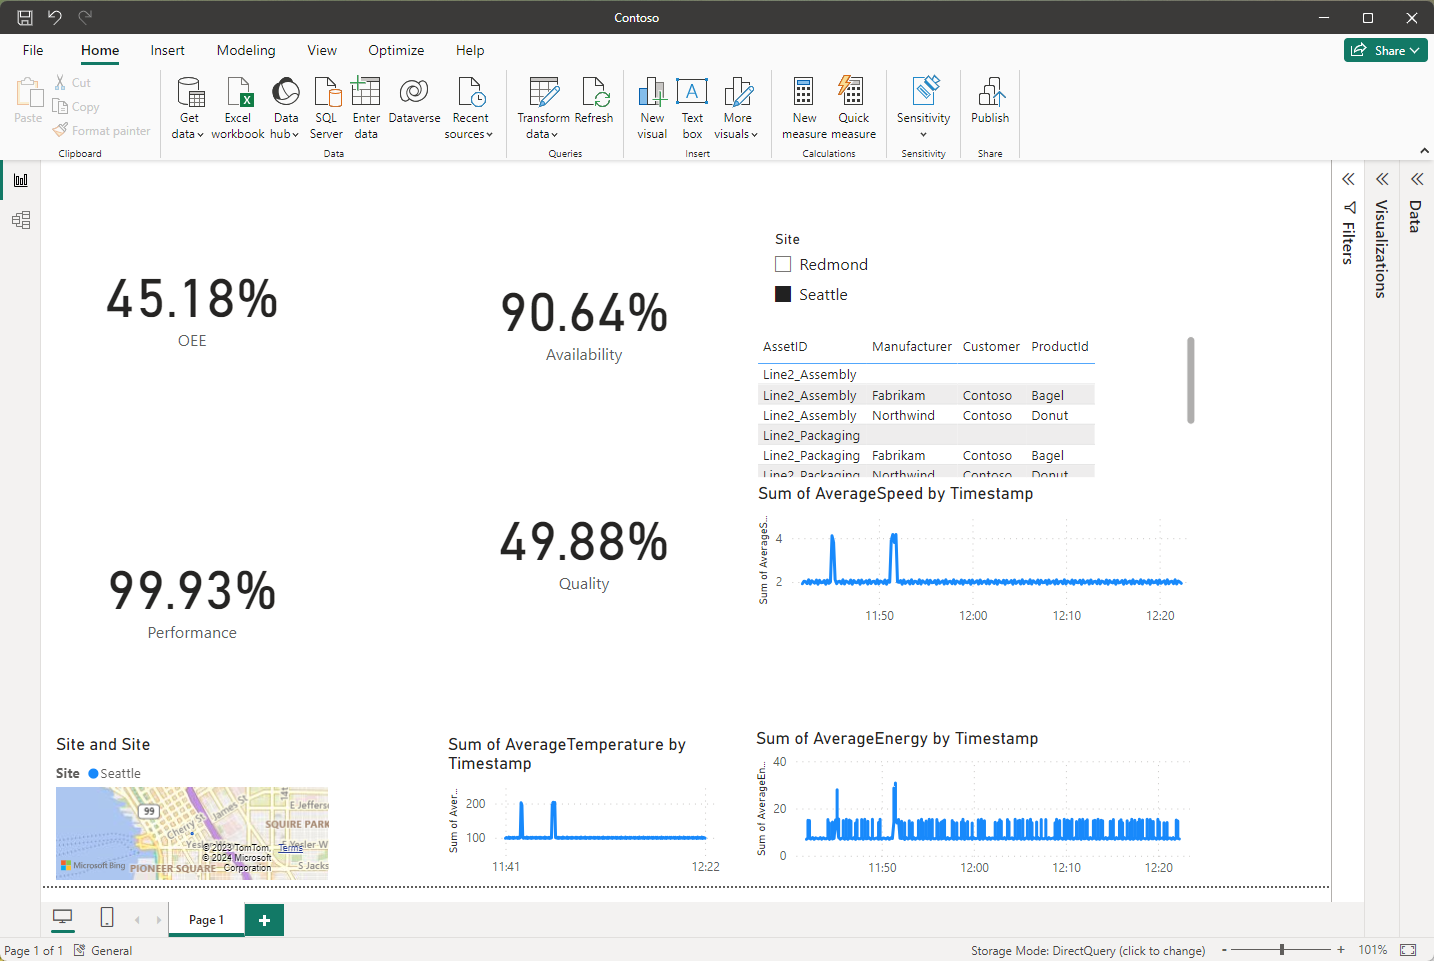
To create a filter that lets you calculate OEE for each Contoso site and further enhance the visualizations on the dashboard, complete the following steps:
Select the Slicer icon in the visualizations panel and select Site. The slicer lets you filter by the site to calculate OEE, performance, and availability, for individual sites. You can also create a slicer based on asset ID.
Select the Table icon in the visualizations panel and select AssetID, Manufacturer, Customer, and ProductId. The dashboard now displays enrichment data for each asset.
Select the Map icon in the visualizations panel, select Site, and drag the site box inside the visualizations panel into the Location field.
Select the Line chart icon in the visualizations panel and then check Timestamp and AverageTemperature.
Select the Line chart icon in the visualizations panel and then check Timestamp and AverageEnergy.
Select the Line chart icon in the visualizations panel and then check Timestamp and AverageSpeed.
Your dashboard now looks like the following example:
Save your dashboard.

To share your dashboard with your coworkers, select Publish in the top navigation plane, and enter your Microsoft Fabric workspace as the destination.
Related content
Feedback
Coming soon: Throughout 2024 we will be phasing out GitHub Issues as the feedback mechanism for content and replacing it with a new feedback system. For more information see: https://aka.ms/ContentUserFeedback.
Submit and view feedback for