Tutorial: Detect anomalies in your manufacturing process in real time
Important
Azure IoT Operations Preview – enabled by Azure Arc is currently in PREVIEW. You shouldn't use this preview software in production environments.
See the Supplemental Terms of Use for Microsoft Azure Previews for legal terms that apply to Azure features that are in beta, preview, or otherwise not yet released into general availability.
Contoso supplies baked goods to the Puget Sound area in the northwest United States. It has bakeries in Seattle, Redmond, and Tacoma.
Contoso wants to check the quality of its manufacturing process by detecting anomalies in real-time at their three bakeries. The quality of the process helps Contoso decide whether the baked products need more inspection because of process anomalies before they're shipped.
To achieve these goals, Contoso needs to:
- Collect data from multiple data sources.
- Contextualize the data.
- Use an analytics model at the edge to estimate the quality in near-real time.
Contoso also wants to reduce the amount of data at the edge and send the final data to the cloud for more analysis.
Prerequisite
Follow the steps in Quickstart: Deploy Azure IoT Operations Preview to an Arc-enabled Kubernetes cluster to install Azure IoT operations on an Azure Arc-enabled Kubernetes cluster.
An Azure Data Explorer cluster and database. Follow the steps in Quickstart: Create an Azure Data Explorer cluster and database to create a free cluster and database to use in this tutorial. Name your database
bakery_ops.An Azure Managed Grafana workspace. You can use either the Azure portal or Azure CLI to create the workspace. Make a note of the endpoint URL, you need it later in this tutorial.
Prepare your environment
Complete the following tasks to prepare your environment.
Grant access to your Azure Data Explorer database
Before you can write to Azure Data Explorer from a data pipeline, enable access for the managed identity associated with the data processor in your database. The advantage of using the managed identity instead of creating your own service principal is that you don't need to manage the lifecycle of the service principal. The managed identity is automatically created and managed by the data processor extension.
To find the application ID of the managed identity and your tenant ID, run the following commands. Replace the placeholders with your cluster name, resource group, and subscription ID:
CLUSTER_NAME=<Your connected cluster name>
RESOURCE_GROUP=<The resource group where your connected cluster is installed>
SUBSCRIPTION=<The subscription where your connected cluster is installed>
EXTENSION_NAME=processor

OBJECT_ID=$(az k8s-extension show --name $EXTENSION_NAME --cluster-name $CLUSTER_NAME --resource-group $RESOURCE_GROUP --cluster-type connectedClusters --query identity.principalId -o tsv --subscription $SUBSCRIPTION)
echo "App ID:    " `az ad sp show --query appId --id $OBJECT_ID -o tsv`
echo "Tenant ID: " `az account show --query tenantId -o tsv`
Make a note of the App ID and Tenant ID, you need these values later.
To add the managed identity to the database, navigate to the Azure Data Explorer portal and run the following query on your database. Replace the placeholders with the values you made a note of in the previous step:
.add database ['bakery_ops'] admins ('aadapp=<app-ID>;<tenant-ID>');
Add a table to your database
To add a table to the bakery_ops database to store the anomaly data, navigate to the Azure Data Explorer portal and run the following query on your database:
.create table edge_data  (
['AssetID']:string,
['Timestamp']:datetime,
['Name']:string,
['SerialNumber']:string,
['Status']:bool,
['Maintenance']:string,
['Location']:string,
['OperatingTime']:int,
['Humidity']:decimal,
['HumidityAnomalyFactor']:decimal,
['HumidityAnomaly']:bool,
['Temperature']:decimal,
['TemperatureAnomalyFactor']:decimal,
['TemperatureAnomaly']:bool,
['Vibration']:decimal,
['VibrationAnomalyFactor']:decimal,
['VibrationAnomaly']:bool
)
Assets and measurements
In this tutorial, you simulate the Contoso sites and production lines. Contoso has three types of asset on its production lines: ovens, mixers, and slicers:

The production line assets generate multiple real-time measurements such as humidity, pressure, and temperature. This tutorial uses these simulated measurements to detect anomalies in the manufacturing process.
The simulation generates data and measurements from two sources for anomaly detection: production line assets and enterprise resource planning data. These are explained in more detail in the sections below.
Production line assets
Production line assets have sensors that generate measurements as the baked goods are produced. Contoso production lines contain oven, mixer, and slicer assets. As a product moves through each asset, the system captures measurements of values that can affect the final product. The system sends these measurements to Azure IoT MQ Preview.
In this tutorial, the industrial data simulator simulates the assets that generate measurements. A manifest file determines how the industrial data simulator generates the measurements.
The following snippet shows an example of the measurements the simulator sends to MQ:
[
  {
    "DataSetWriterName": "Redmond_Oven_Redmond_Oven__asset_0",
    "Payload": {
      "Redmond_Oven__oven_asset_id__0": {
        "SourceTimestamp": "2023-12-08T17:06:31.840373756-08:00",
        "Value": "Red_O1"
      },
      "Redmond_Oven__oven_humidity__0": {
        "SourceTimestamp": "2023-12-08T17:06:31.84037286-08:00",
        "Value": 91.36737218207834
      },
      "Redmond_Oven__oven_machine_status__0": {
        "SourceTimestamp": "2023-12-08T17:06:31.840359971-08:00",
        "Value": 1
      },
      "Redmond_Oven__oven_operating_time__0": {
        "SourceTimestamp": "2023-12-08T17:06:31.840354666-08:00",
        "Value": 15
      },
      "Redmond_Oven__oven_pressure__0": {
        "SourceTimestamp": "2023-12-08T17:06:31.840366788-08:00",
        "Value": 9.98121471138974
      },
      "Redmond_Oven__oven_temperature__0": {
        "SourceTimestamp": "2023-12-08T17:06:31.840365282-08:00",
        "Value": 109.9060735569487
      },
      "Redmond_Oven__oven_vibration__0": {
        "SourceTimestamp": "2023-12-08T17:06:31.840370171-08:00",
        "Value": 54.64103415605061
      }
    },
    "SequenceNumber": 14,
    "Timestamp": "2023-12-08T17:06:31.840331844-08:00"
  }
]
Enterprise resource planning data
Enterprise resource planning data (ERP) is contextual data for the operations from an ERP application. This ERP data is accessible from an HTTP endpoint. The following snippet shows an example of the ERP data:
[
  {
    "assetID": "Sea_O1",
    "serialNumber": "SN001",
    "name": "Contoso",
    "site": "Seattle",
    "maintenanceStatus": "Done"
  },
  {
    "assetID": "Red_O1",
    "serialNumber": "SN002",
    "name": "Contoso",
    "site": "Redmond",
    "maintenanceStatus": "Upcoming"
  }
]
Set up the data simulator and HTTP call-out samples
Run the following command to deploy the industrial data simulator to your cluster with the configuration for this sample:
kubectl apply -f https://raw.githubusercontent.com/Azure-Samples/explore-iot-operations/main/samples/industrial-data-simulator/manifests/anomaly-detection/manifest.yml
Caution
The previous configuration adds an insecure BrokerListener to connect the simulator to the MQTT broker. Don't use this configuration in a production environment.
Run the following command to deploy the gRPC callout service that returns simulated ERP data to your cluster:
kubectl apply -f https://raw.githubusercontent.com/Azure-Samples/explore-iot-operations/main/samples/http-grpc-callout/manifest.yml
Deploy the anomaly detection custom workload
To deploy the anomaly detection custom workload pods to your Kubernetes cluster, run the following command:
kubectl apply -f https://raw.githubusercontent.com/Azure-Samples/explore-iot-operations/main/samples/anomaly-detection/manifest.yml
The anomaly detection service applies the exponential weighted moving average (EWMA) method to detect anomalies in process variables such as temperature, humidity, and vibration. The EWMA method is a statistical technique for anomaly detection used to find anomalies in the mean of time series data. The EWMA method acts as a filter that gives more importance to recent data points and less importance to older data points.
By default, the anomaly detection service uses preset estimated control limits. The algorithm identifies an anomaly in the measurement stream when the control limit value of a data point lies outside the control limit band. You can modify the anomaly detection service configuration to use dynamically calculated control limits for anomalies. To learn more, see the Anomaly Detection Server README file.
Transform and enrich the measurement data
To transform the measurement data from your production lines into a structure that the anomaly detector can use, you use Data Processor pipelines.
In this tutorial, you create three pipelines:
The ERP reference data pipeline ingests ERP data from the HTTP endpoint and writes it to the erp-data reference dataset.
The operations data processing pipeline:
- Ingests the operational sensor data from the assets.
- Transforms the data and enriches it with data from the ERP dataset.
- Writes the data to a separate MQTT topic.
The send data to Azure Data Explorer pipeline ingests the preprocessed data and writes it to Azure Data Explorer in the cloud.
ERP reference data pipeline
To make the ERP data available to the enrichment stage in the operations data processing pipeline, you save the ERP data in a reference dataset.
To create the erp-data dataset:
Navigate to the Azure IoT Operations (preview) portal in your browser and sign in with your Microsoft Entra ID credentials.
Select Get started and navigate to Azure IoT Operations instances to see a list of the clusters you have access to.
Select your instance and then select Data pipelines. Here, you can author the Data Processor pipelines, create the reference data sets, and deploy them to your Azure Arc-enabled Kubernetes cluster.
Select Reference datasets. Then select Create reference dataset.
Enter the information from the following table, which includes adding one property.
Field Value Name erp-dataProperty Name IDProperty Path .assetIDPrimary Key Yes Select Create. It can take up to a minute for the reference dataset to deploy to the Kubernetes cluster and show up in the portal.
To create the ERP reference data pipeline that ingests the data from the HTTP endpoint and then saves it in the erp-data dataset:
Navigate back to Data pipelines and select Create pipeline.
Select the title of the pipeline on the top left corner, rename it to erp-reference-data-pipeline, and Apply the change.
In the pipeline diagram, select Configure source and then select HTTP Endpoint. Enter the information from the following table:
Field Value Name HTTP Endpoint - ERP dataMethod GETURL http://callout-svc-http:3333/ref_dataAuthentication NoneData format JSONAPI Request – Request Body {}Request Interval 30mSelect Apply.
Select Add stages and then select Delete to delete the middle stage.
To connect the source and destination stages, select the red dot at the bottom of the source stage and drag it to the red dot at the top of the destination stage.
Select Add destination and then select Reference datasets.
Name the stage Reference dataset - erp-data.
Select erp-data in the Dataset field, and select Apply.
Select Save to save the pipeline.
You now have a pipeline that queries an HTTP endpoint every 30 minutes for ERP reference data to store in a reference dataset.
OPCUA anomaly detection pipeline
Now you can build the OPCUA anomaly detection pipeline that:
- Ingests the sensor measurements from the production line assets.
- Detects any anomalies in the measurement data.
To create the opcua-anomaly-pipeline pipeline:
Navigate back to Data pipelines and select Create pipeline.
Select the title of the pipeline on the top left corner, rename it to opcua-anomaly-pipeline, and Apply the change.
In the pipeline diagram, select Configure source and then select MQ. Enter the information from the following table:
Field Value Name MQ - ContosoLLC/#Broker tls://aio-mq-dmqtt-frontend:8883Topic ContosoLLC/#Data format JSONSelect Apply. The simulated production line assets send measurements to the MQ broker in the cluster. This input stage configuration subscribes to all the topics under the
ContosoLLCtopic in the MQ broker. This topic receives measurement data from the Redmond, Seattle, and Tacoma sites.Add a Transform stage after the source stage. Name the stage Transform - Reorganize message and add the following JQ expressions. This transform reorganizes the data and makes it easier to read:
.payload[0].Payload |= with_entries(.value |= .Value) |
.payload[0].Payload.sourceTimestamp = .systemProperties.timestamp |
.payload |= .[0] |
.payload.Payload.assetName = .payload.DataSetWriterName |
del(.payload.DataSetWriterName) |
.payload.Payload |= with_entries (
    if (.key | startswith("Tacoma")) then
        .key |= capture("^(Tacoma)_[a-zA-Z0-9]+__[a-zA-Z0-9]+_(?<name>.+)__0").name
    elif (.key | startswith("Seattle")) then
        .key |= capture("^(Seattle)_[a-zA-Z0-9]+__[a-zA-Z0-9]+_(?<name>.+)__0").name
    elif (.key | startswith("Redmond")) then
        .key |= capture("^(Redmond)_[a-zA-Z0-9]+__[a-zA-Z0-9]+_(?<name>.+)__0").name
    else
        .
    end
    )
Select Apply.
Use the Stages list on the left to add an Enrich stage after the transform stage, and select it from the pipeline diagram. Name the stage Enrich - Add ERP data. This stage enriches the measurements from the simulated production line assets with reference data from the
erp-datadataset. This stage uses a condition to determine when to add the ERP data. Open the Add condition options and add the following information:Field Value Dataset erp-dataOutput path .payload.Payload.enrichCondition Input path .payload.Payload.asset_idCondition Property IDCondition Operator Key matchSelect Apply.
Add a Transform stage after the enrich stage with the following JQ expressions. Name the stage Transform - Flatten ERP data. This transform stage reorganizes the data and makes it easier to read. These JQ expressions move the enrichment data to the same flat path as the real-time data to make it easier to export to Azure Data Explorer:
.payload.Payload |= . + .enrich |
.payload.Payload |= del(.enrich)
Select Apply.
Add a Call out HTTP stage after the transform stage and select it. This HTTP call out stage calls a custom module running in the Kubernetes cluster that exposes an HTTP API. The anomaly detection service detects anomalies in the time-series data and how large they are. To configure the stage, enter the information from the following table:
Field Value Name Call out HTTP - Anomaly detectionMethod POSTURL http://anomaly-svc:3333/anomalyAuthentication None API Request - Data format JSONAPI Request - Path .API Response - Data format JSONAPI Response - Path .Select Apply.
In the pipeline diagram, select Add destination and then select MQ.
Add the following configuration:
Field Value Name MQ - processed-outputBroker tls://aio-mq-dmqtt-frontend:8883Topic processed-outputData format JSONPath .payloadSelect Apply.
To save your pipeline, select Save. It may take a few minutes for the pipeline to deploy to your cluster, so make sure it's finished before you proceed.
View processed data
Verify data is flowing to the MQTT broker by using the mqttui tool. In this example, you run the mqttui tool inside your Kubernetes cluster:
Run the following command to deploy a pod that includes the mqttui and mosquitto tools that are useful for interacting with the MQ broker in the cluster:
kubectl apply -f https://raw.githubusercontent.com/Azure-Samples/explore-iot-operations/main/samples/quickstarts/mqtt-client.yamlThe following snippet shows the YAML file that you applied:
# Important: do not use in production environments
# Creates a pod with mosquitto-clients and mqttui utilities in your cluster
apiVersion: v1
kind: Pod
metadata:
  name: mqtt-client
  # The namespace must match the IoT MQ BrokerListener's namespace
  # Otherwise use the long hostname: aio-mq-dmqtt-frontend.azure-iot-operations.svc.cluster.local
  namespace: azure-iot-operations
spec:
  # Use the "mqtt-client" service account which comes with default deployment
  # Otherwise create it with `kubectl create serviceaccount mqtt-client -n azure-iot-operations`
  serviceAccountName: mqtt-client
  containers:
    # Install mosquitto and mqttui utilities on Alpine linux
  - image: alpine
    name: mqtt-client
    command: ["sh", "-c"]
    args: ["apk add mosquitto-clients mqttui && sleep infinity"]
    volumeMounts:
    - name: mq-sat
      mountPath: /var/run/secrets/tokens
    - name: trust-bundle
      mountPath: /var/run/certs
  volumes:
  - name: mq-sat
    projected:
      sources:
      - serviceAccountToken:
          path: mq-sat
          audience: aio-mq # Must match audience in BrokerAuthentication
          expirationSeconds: 86400
  - name: trust-bundle
    configMap:
      name: aio-ca-trust-bundle-test-only # Default root CA cert
Caution
This configuration isn't secure. Don't use this configuration in a production environment.
When the mqtt-client pod is running, run the following command to create a shell environment in the pod you created:
kubectl exec --stdin --tty mqtt-client -n azure-iot-operations -- shAt the shell in the mqtt-client pod, run the following command to connect to the MQ broker using the mqttui tool:
mqttui -b mqtts://aio-mq-dmqtt-frontend:8883 -u '$sat' --password $(cat /var/run/secrets/tokens/mq-sat) --insecure
Look for processed-output in the list of topics and verify that it's receiving messages. The following example shows a message in the processed-output topic:
{
  "payload": {
    "assetId": "Sea_S1",
    "assetName": "Seattle_Slicer_Seattle_Slicer__asset_0",
    "humidity": 82.88225244364277,
    "humidityAnomaly": true,
    "humidityAnomalyFactor": 68.48042507750309,
    "machineStatus": 0,
    "maintainenceStatus": "Upcoming",
    "name": "Contoso",
    "operatingTime": 162,
    "serialNumber": "SN004",
    "site": "Seattle",
    "sourceTimestamp": "2023-12-09T01:08:58.852Z",
    "temperature": 92.97592214422629,
    "temperatureAnomaly": false,
    "temperatureAnomalyFactor": 84.1659459093868,
    "vibration": 54.79910570367032,
    "vibrationAnomaly": false,
    "vibrationAnomalyFactor": 52.154975528663186
  }
}
After it passes through the pipeline stages, the data:
- Is easier to read.
- Is better organized.
- Has no unnecessary fields.
- Is enriched with information such as the asset ID, company name, maintenance status, site, and serial number.
Now you can send your transformed and enriched measurement data to Microsoft Azure Data Explorer for further analysis and to create visualizations of the anomalies in your production processes.
Send data to Azure Data Explorer
The next step is to create a Data Processor pipeline that sends the transformed and enriched measurement data to your Azure Data Explorer instance.
Back in the Azure IoT Operations (preview) portal, navigate to Data pipelines and select Create pipeline.
Select the title of the pipeline on the top left corner, rename the pipeline to adx-pipeline, and Apply the change.
In the pipeline diagram, select Configure source and then select MQ. Enter the information from the following table:
Field Value Name MQ - processed-outputBroker tls://aio-mq-dmqtt-frontend:8883Topic processed-outputData Format JSONSelect Apply.
Select Add stages and then select Delete to delete the middle stage.
To connect the source and destination stages, select the red dot at the bottom of the source stage and drag it to the red dot at the top of the destination stage.
Select Add destination and then select Azure Data Explorer. Select the Advanced tab and then paste in the following configuration:
{
    "displayName": "Azure Data Explorer - bakery_ops",
    "type": "output/dataexplorer@v1",
    "viewOptions": {
        "position": {
            "x": 0,
            "y": 432
        }
    },
    "clusterUrl": "https://your-cluster.northeurope.kusto.windows.net/",
    "database": "bakery_ops",
    "table": "edge_data",
    "authentication": {
        "type": "managedIdentity"
    },
    "batch": {
        "time": "5s",
        "path": ".payload.payload"
    },
    "columns": [
        {
            "name": "AssetID",
            "path": ".assetId"
        },
        {
            "name": "Timestamp",
            "path": ".sourceTimestamp"
        },
        {
            "name": "Name",
            "path": ".assetName"
        },
        {
            "name": "SerialNumber",
            "path": ".serialNumber"
        },
        {
            "name": "Status",
            "path": ".machineStatus"
        },
        {
            "name": "Maintenance",
            "path": ".maintenanceStatus"
        },
        {
            "name": "Location",
            "path": ".site"
        },
        {
            "name": "OperatingTime",
            "path": ".operatingTime"
        },
        {
            "name": "Humidity",
            "path": ".humidity"
        },
        {
            "name": "HumidityAnomalyFactor",
            "path": ".humidityAnomalyFactor"
        },
        {
            "name": "HumidityAnomaly",
            "path": ".humidityAnomaly"
        },
        {
            "name": "Temperature",
            "path": ".temperature"
        },
        {
            "name": "TemperatureAnomalyFactor",
            "path": ".temperatureAnomalyFactor"
        },
        {
            "name": "TemperatureAnomaly",
            "path": ".temperatureAnomaly"
        },
        {
            "name": "Vibration",
            "path": ".vibration"
        },
        {
            "name": "VibrationAnomalyFactor",
            "path": ".vibrationAnomalyFactor"
        },
        {
            "name": "VibrationAnomaly",
            "path": ".vibrationAnomaly"
        }
    ]
}
Then navigate to the Basic tag and fill in the following fields by using the information you made a note of previously:
Field Value Cluster URL To find this value, navigate to your cluster at Azure Data Explorer and select the Edit connection icon next to your cluster name in the left pane. Tenant ID The tenant ID you made a note of when you created the service principal. Client ID The app ID you made a note of when you created the service principal. Secret AIOFabricSecretSelect Apply.
Select Save to save the pipeline.
Query your data
You can use Azure Data Explorer to query your data. Navigate to your Azure Data Explorer cluster and run the following query to confirm that the data is flowing from your pipeline:
edge_data
| take 10
You can use Kusto queries in Azure Data Explorer to examine your data. The following example finds the asset with the highest proportion of anomalous data points compared to the total data points. Queries like these can help with predictive maintenance tasks:
edge_data
| summarize TotalCount = count(), AnomalyCount = countif(VibrationAnomaly == true) by AssetID
| extend AnomalyPercentage = todouble(AnomalyCount) / todouble(TotalCount) * 100
| top 1 by AnomalyPercentage desc
| project AssetID
To learn more, see Anomaly detection and forecasting. You can use the time series analysis functionality in Azure Data Explorer for tasks such as root cause analysis and forecasting.
Visualize anomalies and process data
To visualize anomalies and process data, you can use Azure Managed Grafana. Use the Azure Managed Grafana instance that you created previously. Create a new dashboard to show the data from Azure Data Explorer:
In the Azure portal, navigate to your Azure Managed Grafana instance. Use the Endpoint link to open your Grafana instance.
Select Add your first data source to connect your Grafana instance to Azure Data Explorer.
On the Add data source page, search for and select Azure Data Explorer Datasource.
In the Connection Details section, add your Azure Data Explorer cluster URI.
In the Authentication section, select App Registration and enter your service principal details. You made a note of these values when you created your service principal.
To test the connection to the Azure Data Explorer database, select Save & test. You should see a Success indicator.
Now that your Grafana instance is connected to your Azure Data Explorer database, you can build a dashboard:
From the Grafana menu, select Dashboards.
Then select New > Import.
In another browser tab, navigate to https://raw.githubusercontent.com/Azure-Samples/explore-iot-operations/main/samples/dashboard/grafanaPredictiveMaintenance.json and copy the contents. This is the JSON definition of the sample dashboard.
Paste the dashboard JSON definition into the Import via panel json text box and then select Load.
On the Import dashboard page, in the Azure Data Explorer Datasource drop-down list, select the Azure Data Explorer data source you created previously. Then select Import.
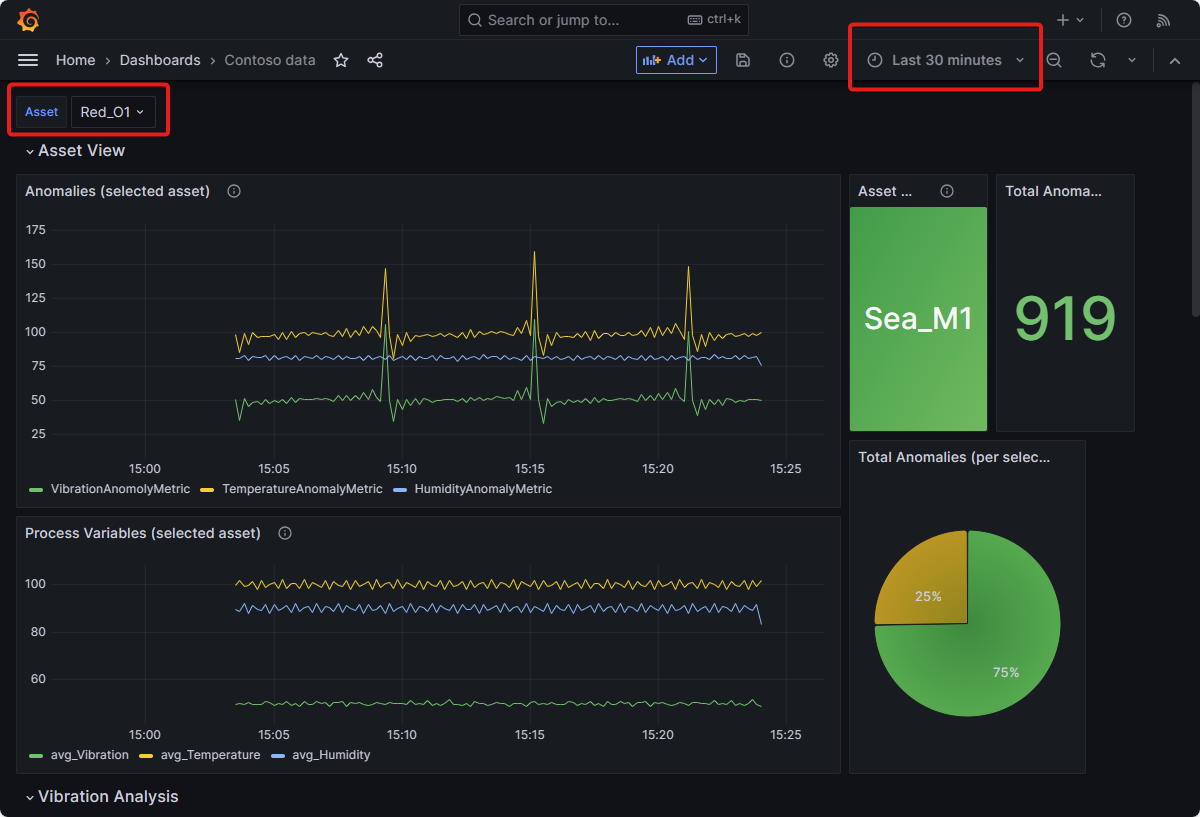
To view data on the dashboard, use the Asset drop-down list to select an asset and make sure that the Time range is set to Last 30 minutes.
Note
This dashboard uses the variables feature to create the drop-down list of assets.
The sample dashboard has three sections:
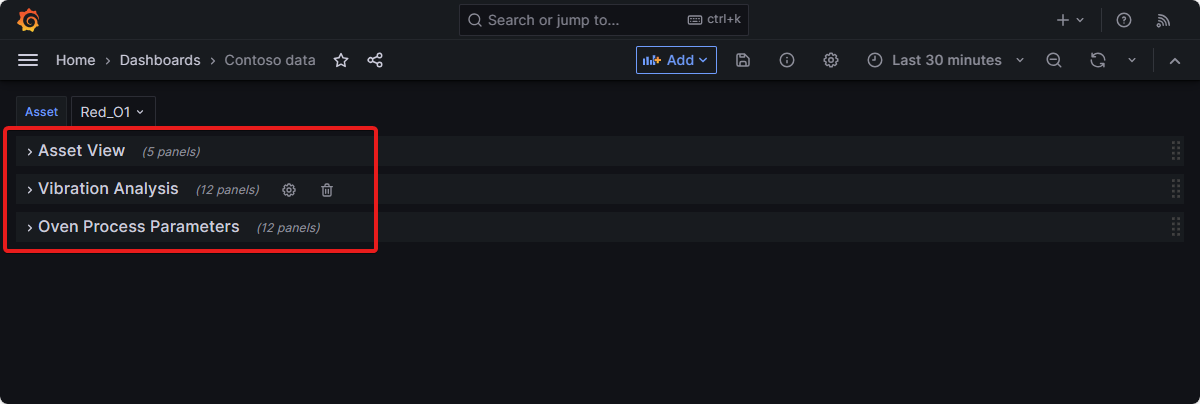
The Asset View section displays the process variables, anomalies, number of anomalies, and the ratio of anomalies of the selected asset.
This view also displays the name of the asset that has the highest number of anomalies ratio within a given time period. This asset should be either inspected or replaced as soon as possible.
This view also displays the name of the asset that has the highest number of vibration anomalies ratio within a given time period. The Contoso plant maintenance crew should prioritize this asset for predictive maintenance.
The industrial data simulator generates deliberately noisy data for demonstration purposes and the anomaly detection is sensitive. Therefore, you see lots of anomalies. You can configure the sensitivity of the anomaly detection service and the noisiness of the industrial data simulator by editing their manifest files.
The Vibration Analysis section of the dashboard charts the real-time vibrations coming from moving assets such as slicers and mixers. It also charts the average of the anomaly detection factor metric that lets operators know when the vibration anomalies are over the set limit. This information helps operators identify assets that require predictive maintenance. This section is valuable to the plant operators, as it helps them monitor asset health and take necessary actions to prevent potential downtime or asset damage.
The Oven Process Parameters section of the dashboard lets you visualize the current oven process parameters in the three Contoso Bakery locations. It charts the process parameters over a selected time period and shows temperature and humidity anomalies. You can use this anomaly data to predict abnormal oven process parameters that could result in a bad product. This section is valuable to the plant operators, as it helps them to monitor the health of the ovens and take any necessary actions to preserve the quality of the products.
You can also create your own dashboard with Kusto Queries.
Summary
This tutorial shows you how to do anomaly detection with the Contoso manufacturing operations sample. You learned how to:
- Set up Azure IoT Operations on an Arc-enabled Kubernetes cluster.
- Use Data Processor to transform and enrich the measurement data.
- Use Data Processor to call a custom analytics service that detects anomalies in the measurement data at near real time.
- Create an Azure Data Explorer cluster.
- Deploy a custom workload for anomaly detection.
- Send data from the edge to Azure Data Explorer.
- Use Azure Managed Grafana to visualize the anomalies and data from your industrial process.
Related content
Feedback
Coming soon: Throughout 2024 we will be phasing out GitHub Issues as the feedback mechanism for content and replacing it with a new feedback system. For more information see: https://aka.ms/ContentUserFeedback.
Submit and view feedback for