Note
Access to this page requires authorization. You can try signing in or changing directories.
Access to this page requires authorization. You can try changing directories.
In this article, you learn how you can compare test runs in Azure Load Testing. You can view trends across the last 10 test runs, or you can select and compare up to ten individual test runs. Optionally, you can mark a test run as a baseline to compare against.
To identify regressions over time, you can use the client-side metrics trends of the last 10 test runs, such as the response time, error rate, and more. In combination with CI/CD integration, the trends data might help you identify which application build introduced a performance issue.
When you want to compare the client-side metrics trends against a specific reference test run, you can mark that test run as your baseline. For example, before you implement performance optimizations in your application, you might first create a baseline load test run, and then validate the effects of your optimizations against your baseline.
To compare both client-side and server-side metrics, you can select up to ten test runs, and compare them in the Azure Load Testing dashboard. The dashboard overlays the client-side and server-side metric graphs for each test run. By also comparing server-side application metrics in the dashboard, you can identify which application component was the root cause for a sudden performance degradation.
Prerequisites
An Azure account with an active subscription. If you don't have an Azure subscription, create a free account before you begin.
An Azure load testing resource, which has a test with multiple test runs. To create a load testing resource, see Create and run a load test.
Compare multiple load test runs
To compare test runs in Azure Load Testing, you first have to select up to ten runs within a load test. You can only compare runs that belong to the same load test. After you select the test runs you want to compare, you can visually compare the client-side and server-side metrics for each test run in the load test dashboard.
A test run needs to be in the Done, Stopped, or Failed state to compare it.
Use the following steps to select the test runs:
Sign in to the Azure portal by using the credentials for your Azure subscription.
Go to your load testing resource, and then select Tests in the left pane.
Tip
You can also use the filters to find your load test.
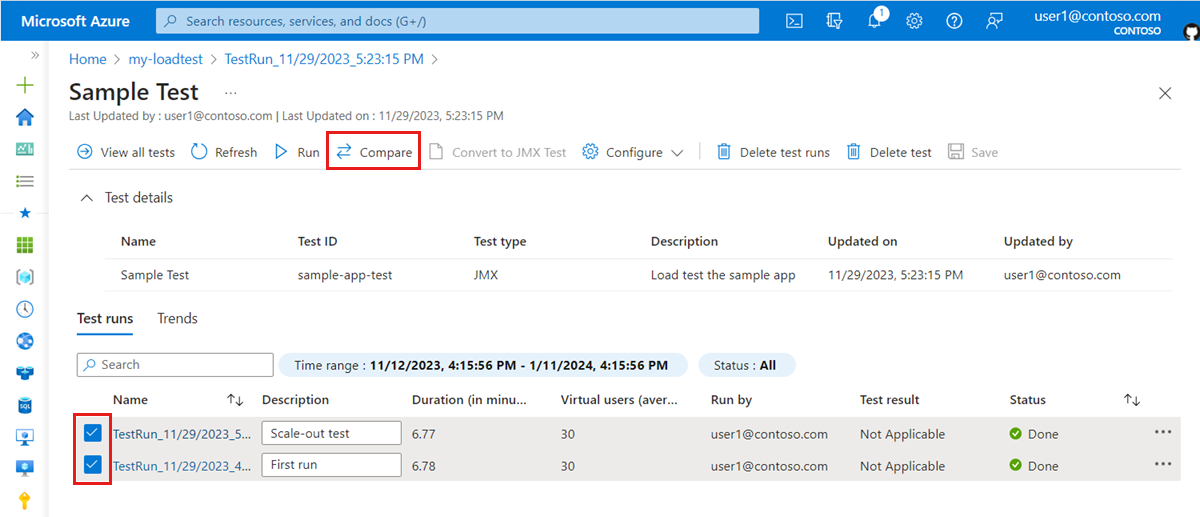
Select the test whose runs you want to compare by selecting its name.
Select two or more test runs, and then select Compare to compare test runs.
You can choose a maximum of ten test runs to compare.
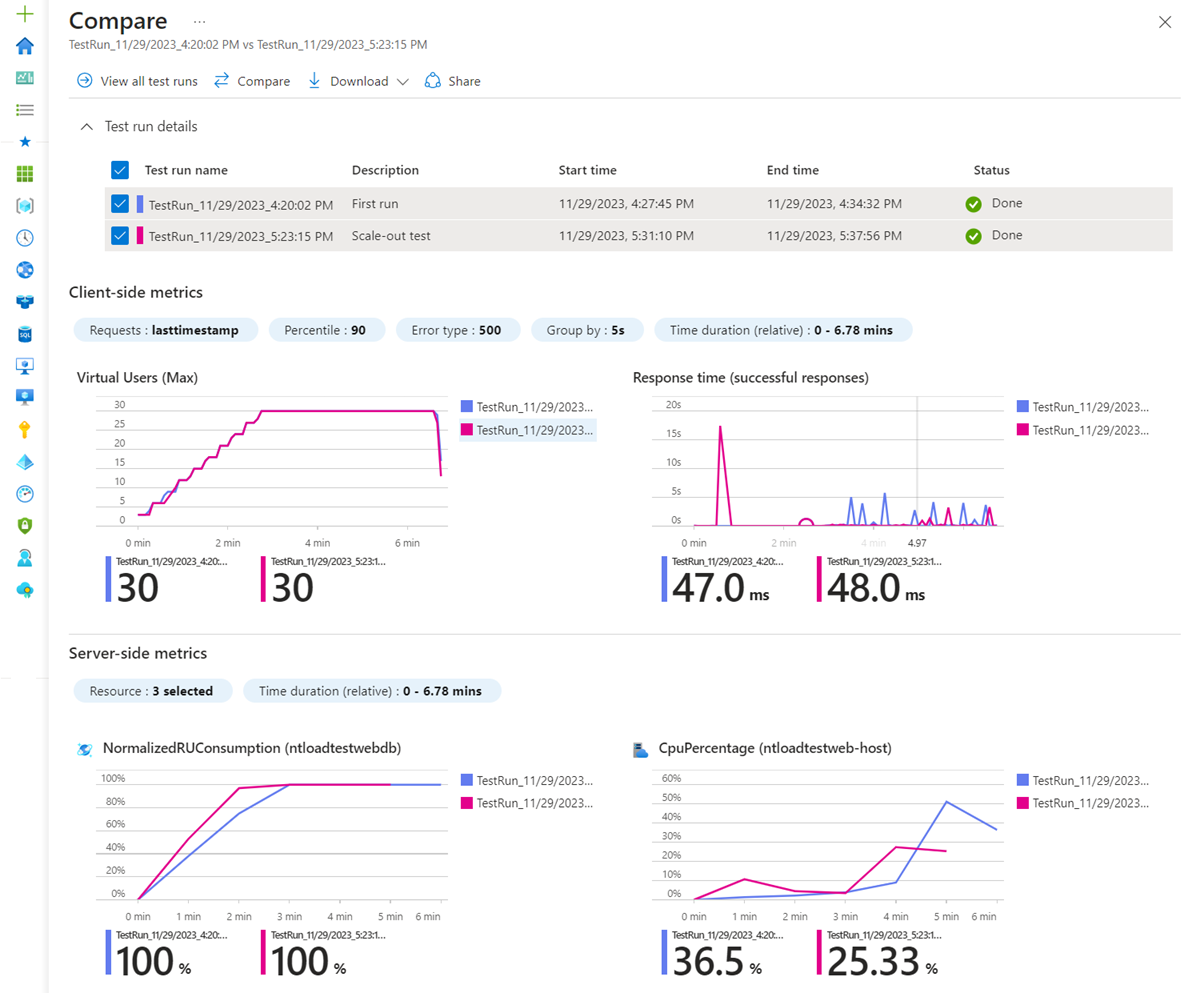
On the dashboard, each test run is shown as an overlay in the different graphs.
The dashboard enables you to compare both client-side metrics and server-side metrics. You can view the color-coding for each test run in the Test run details section.
Note
The time filter is based on the duration of the tests. A value of zero indicates the start of the test, and the maximum value marks the duration of the longest test run.


View metrics trends across load test runs
To view metrics trends across test runs in Azure Load Testing, you need to have at least two test runs in the Done, or Stopped state. You can only view trends from runs that belong to the same load test.
Use the following steps to view metrics trends across test runs:
Sign in to the Azure portal by using the credentials for your Azure subscription.
Go to your Azure Load Testing resource and then, on the left pane, select Tests.
Select the test for which you want to view metrics trends by selecting its name.
Select the Trends tab to view the metrics trends for the load test.
The graphs show the trends for total requests, response time, error percentage, and throughput for the 10 most recent test runs.
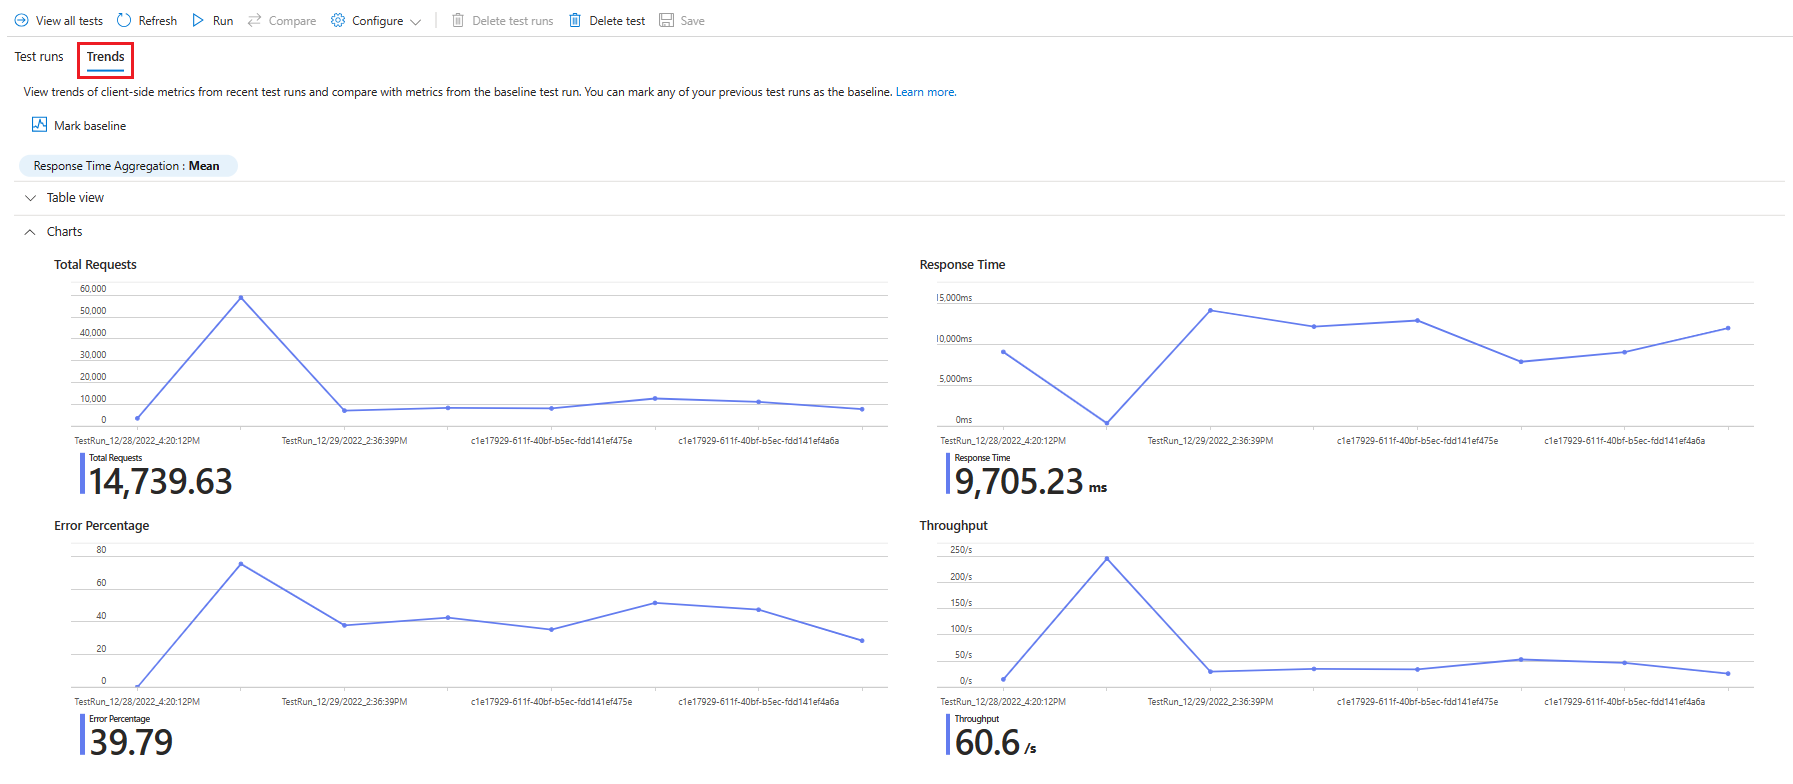
Optionally, you can select Table view to view the metrics trends in a tabular view.
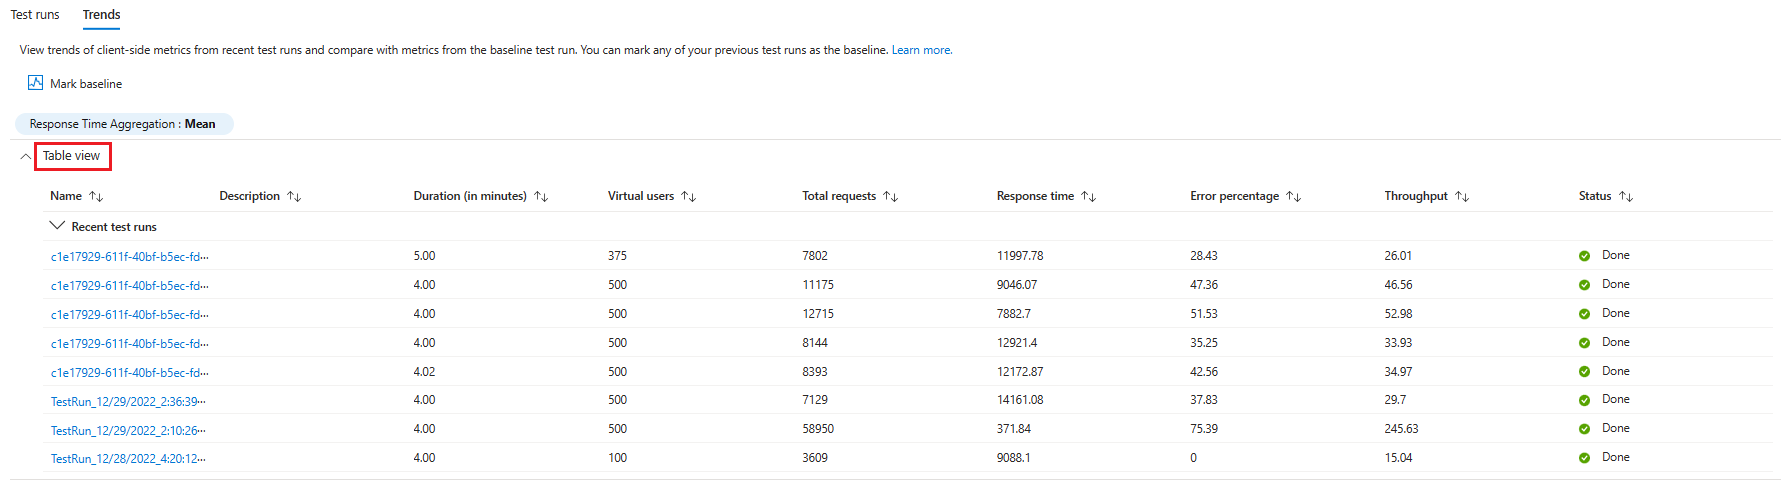
You can select a test run that you want to analyze and open the results dashboard for that test run.


Compare load test runs against a baseline
You can mark a test run as a baseline to compare the client-side metrics of the recent test runs with the metrics of the baseline.
Use the following steps to mark a test run as baseline:
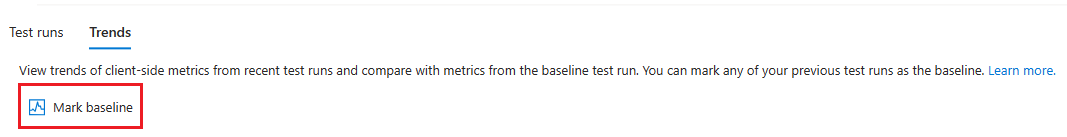
On the Trends tab, select Mark baseline.
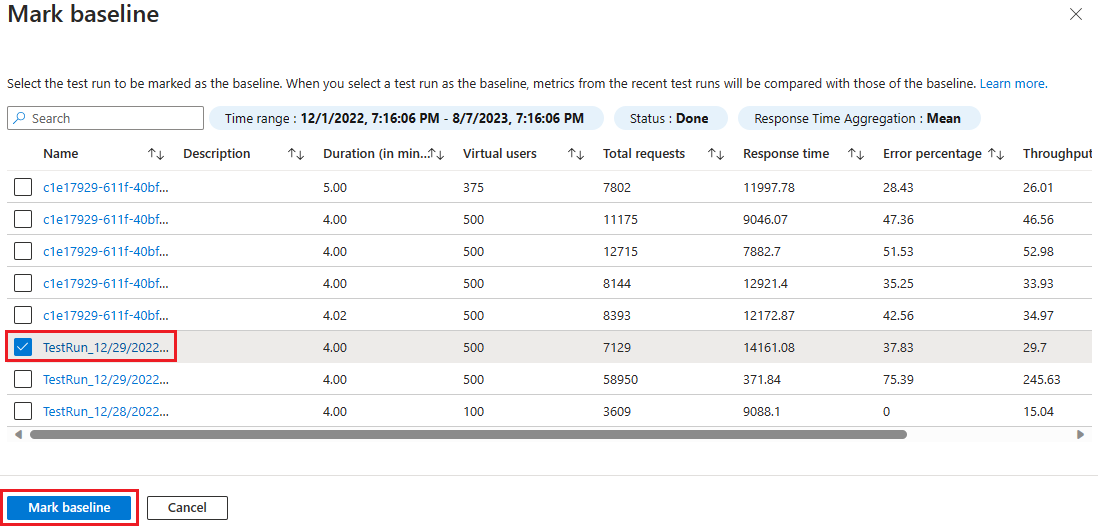
From the list of test runs, select the checkbox for the test run that you want to mark as baseline, and then select Mark baseline.
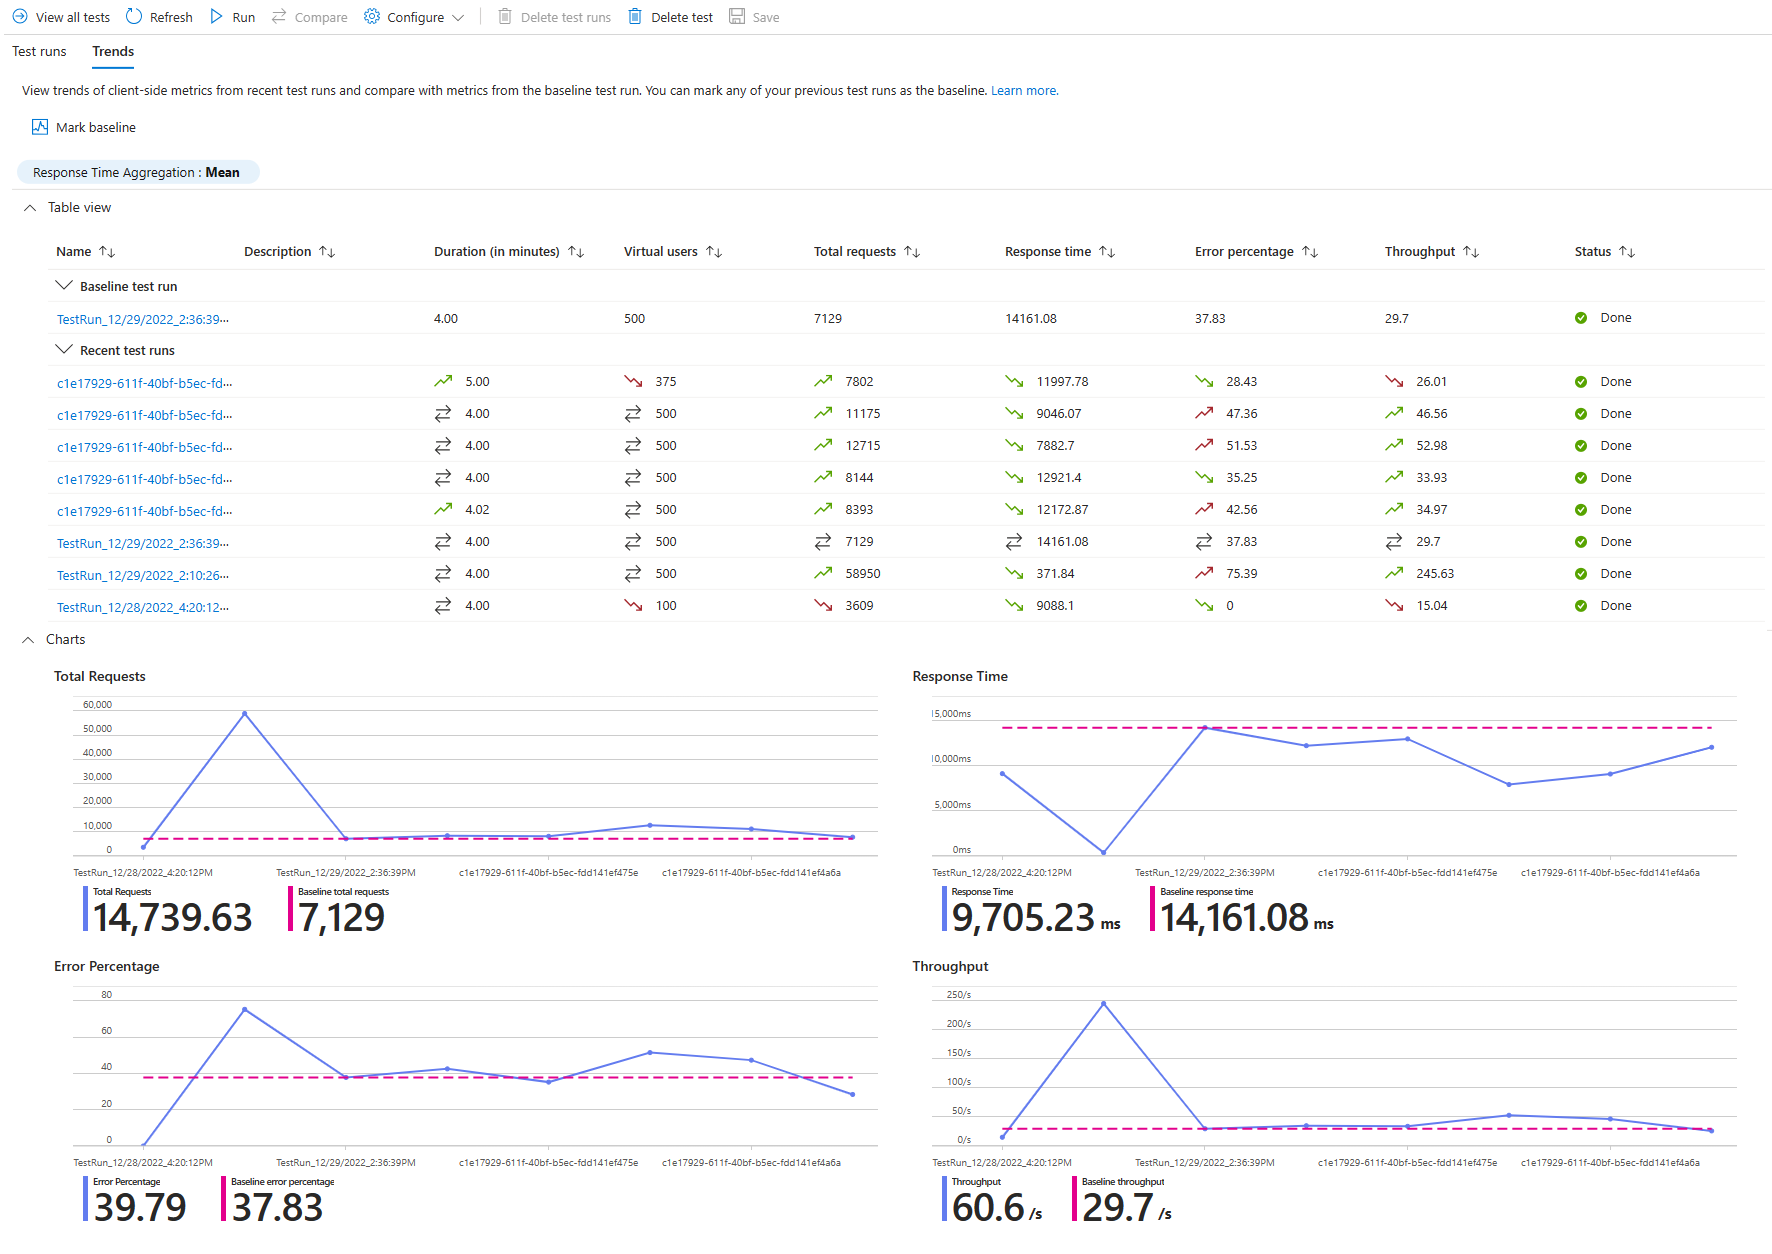
On the Trends tab, you can now view the baseline test run in the table and charts.
The baseline value is shown as a horizontal line in the charts. In the table view, an extra row with the baseline test run details is shown.
In the table, an arrow icon indicates whether the metric is trending favorably or unfavorably as compared to the baseline metric value.


Related content
- Learn more about exporting the load test results for reporting.
- Learn more about diagnosing failing load tests.
- Learn more about configuring automated performance testing with CI/CD.