Note
Access to this page requires authorization. You can try signing in or changing directories.
Access to this page requires authorization. You can try changing directories.
In this article, you learn how to automate an existing load test by creating a CI/CD pipeline in Azure Pipelines. Select your test in Azure Load Testing, and directly configure a pipeline in Azure DevOps that triggers your load test with every source code commit. Automate load tests with CI/CD to continuously validate your application performance and stability under load.
If you want to automate your load test with GitHub Actions, learn how to manually configure a CI/CD pipeline for Azure Load Testing.
Prerequisites
An Azure account with an active subscription. Create an account for free.
Your Azure account needs to have the Application Administrator role. See Check access for a user to Azure resources to verify your permissions.
An Azure DevOps organization and project. If you don't have an Azure DevOps organization, you can create one for free.
Your Azure DevOps organization is connected to Microsoft Entra ID in your subscription. Learn how you can connect your organization to Microsoft Entra ID.
Your Azure DevOps organization needs to have the Azure Load Testing extension installed.
A load testing resource, which contains a test. Create a URL-based load test, use an existing JMeter script, or use an existing Locust script to create a load test.
Configure a CI/CD pipeline
In this section, you'll create a CI/CD pipeline in Azure Pipelines to run an existing load test. The test files like test script and test configuration YAML will be committed to your repository.
In the Azure portal, go to your Azure load testing resource.
On the left pane, select Tests to view the list of tests.
Select a test from the list by selecting the checkbox, and then select Set up CI/CD.

Enter the following details for creating a CI/CD pipeline definition:
Setting Value Organization Select the Azure DevOps organization where you want to run the pipeline from. Project Select the project from the organization selected above. Repository Select the source code repository to store and run the Azure pipeline from. Branch Select the branch in the selected repository. Repository branch folder (Optional) Enter the repository branch folder name in which you'd like to commit. If empty, the root folder is used. Override existing files Check this setting. Service connection Select Create new to create a new service connection to allow Azure Pipelines to connect to the load testing resource.
If you already have a service connection with the Load Test Contributor role on the resource, choose Select existing and select the service connection from the dropdown list.
Important
If you're getting an error creating a PAT token, or you don't see any repositories, make sure to connect your Azure DevOps organization to Microsoft Entra ID. Make sure the directory in Azure DevOps matches the directory you're using for Azure Load Testing. After connecting to Microsoft Entra ID, close and reopen your browser window.
Select Create Pipeline to start creating the pipeline definition.
Azure Load Testing performs the following steps to configure the CI/CD pipeline:
Create a new service connection of type Azure Resource Manager in the Azure DevOps project. The service principal is automatically assigned the Load Test Contributor role on the Azure load testing resource.
Commit the test script and test configuration YAML to the source code repository.
Create a pipeline definition that invokes the Azure load testing resource and runs the load test.
When the pipeline creation finishes, you receive a notification in the Azure portal with a link to the pipeline.
Optionally, you can open the pipeline definition and modify the pipeline steps or change when the pipeline is triggered.


You now have a CI/CD pipeline in Azure Pipelines that invokes your load test when the pipeline is triggered. By default, the pipeline is triggered whenever you push an update to the selected branch.

Grant permission to service connection
When you run the CI/CD pipeline for the first time, you need to grant permission to the pipeline to access the service connection and start the load test.
Sign in to your Azure DevOps organization (
https://dev.azure.com/<your-organization>), and select your project.Replace the
<your-organization>text placeholder with your project identifier.Select Pipelines in the left navigation, and then select your pipeline.
Notice that the pipeline run status is Pending.
Select the pending pipeline run, and then select View.
An alert message is shown that the pipeline needs permission to access the load test resource.
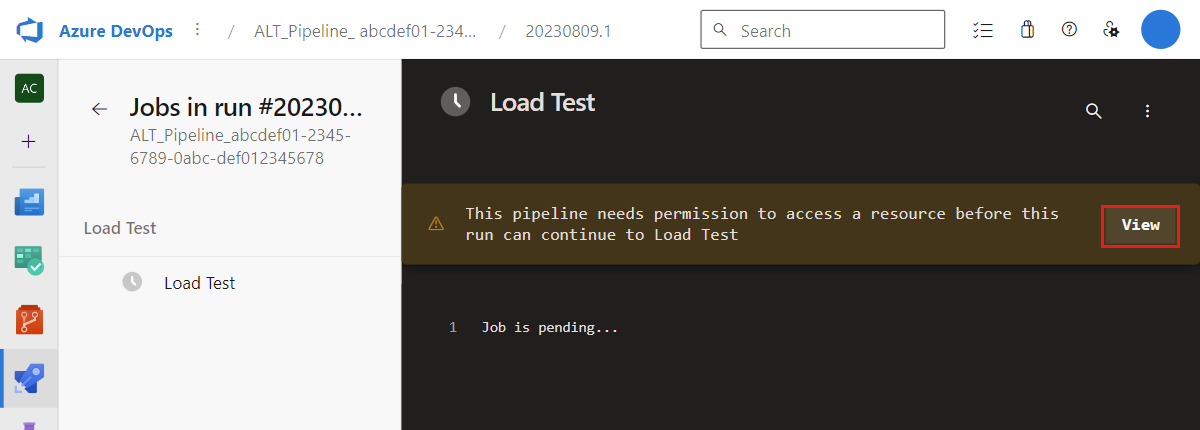
Select Permit, and then select Permit again in the confirmation window.


The CI/CD pipeline run now starts and accesses the Azure load testing resource to run the test.
View load test results in CI/CD
You can view the load test summary results directly in the CI/CD output log.

The generated CI/CD pipeline publishes the load test results as a pipeline artifact. You can download these results as a CSV file for further reporting.

Next steps
You've configured a CI/CD pipeline in Azure Pipelines for an existing load test.
- Define test fail criteria
- View performance trends over time
- Manually configure a CI/CD pipeline for Azure Load Testing, if you want to add a load test to GitHub Actions or use an existing pipeline