Note
Access to this page requires authorization. You can try signing in or changing directories.
Access to this page requires authorization. You can try changing directories.
Implementing responsible AI in practice requires rigorous engineering. But rigorous engineering can be tedious, manual, and time-consuming without the right tooling and infrastructure.
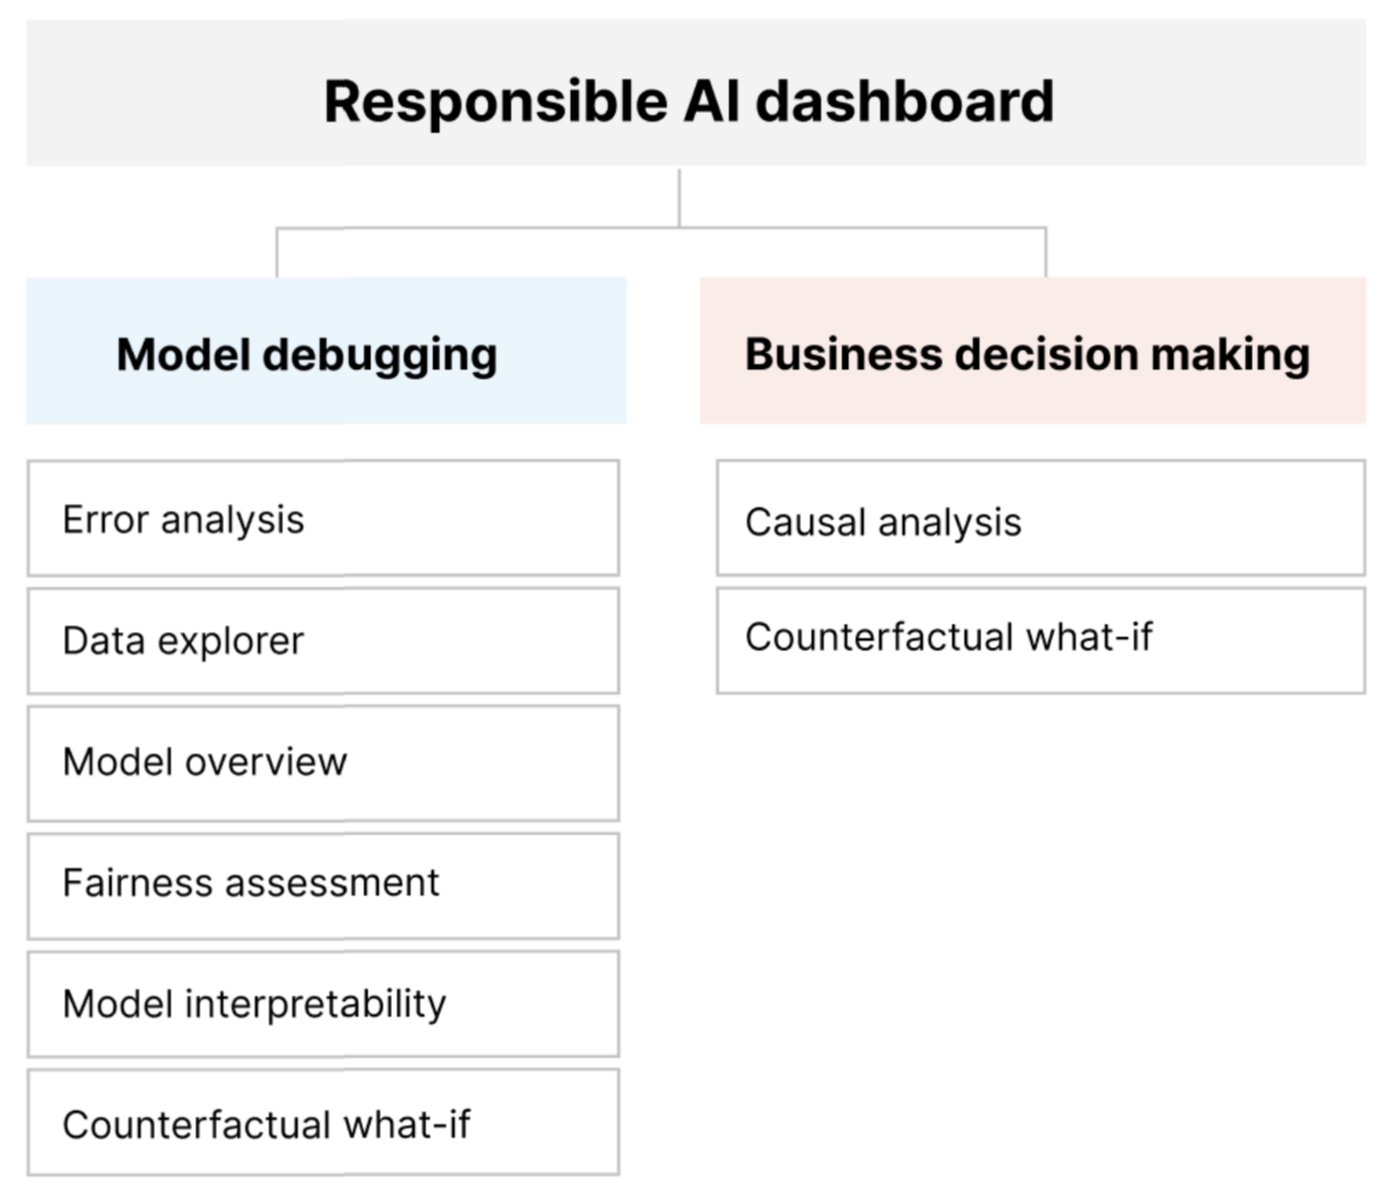
The Responsible AI dashboard provides a single interface to help you implement responsible AI in practice effectively and efficiently. It brings together several mature responsible AI tools in the areas of:
- Model performance and fairness assessment
- Data exploration
- Machine learning interpretability
- Error analysis
- Counterfactual analysis and perturbations
- Causal inference
The dashboard offers a holistic assessment and debugging of models so you can make informed data-driven decisions. Having access to all of these tools in one interface enables you to:
Evaluate and debug your machine learning models by identifying model errors and fairness issues, diagnosing why those errors are happening, and informing your mitigation steps.
Boost your data-driven decision-making abilities by addressing questions like:
"What is the minimum change that users can apply to their features to get a different outcome from the model?"
"What is the causal effect of reducing or increasing a feature (for example, red meat consumption) on a real-world outcome (for example, diabetes progression)?"
You can customize the dashboard to include only the subset of tools that are relevant to your use case.
The Responsible AI dashboard is accompanied by a PDF scorecard. The scorecard enables you to export responsible AI metadata and insights into your data and models. You can then share them offline with the product and compliance stakeholders.
Note
For information about using responsible AI image and text dashboards, see the open source Responsible AI Toolbox.
Responsible AI dashboard components
The Responsible AI dashboard brings together, in a comprehensive view, various new and pre-existing tools. The dashboard integrates these tools with Azure Machine Learning CLI v2, Azure Machine Learning Python SDK v2, and Azure Machine Learning studio. The tools include:
- Data analysis, to understand and explore your dataset distributions and statistics.
- Model overview and fairness assessment, to evaluate the performance of your model and evaluate your model's group fairness issues (how your model's predictions affect diverse groups of people).
- Error analysis, to view and understand how errors are distributed in your dataset.
- Model interpretability (importance values for aggregate and individual features), to understand your model's predictions and how those overall and individual predictions are made.
- Counterfactual what-if, to observe how feature perturbations would affect your model predictions while providing the closest data points with opposing or different model predictions.
- Causal analysis, to use historical data to view the causal effects of treatment features on real-world outcomes.
Together, these tools can help you debug machine learning models and inform your data-driven and model-driven business decisions. The following diagram shows how you can incorporate them into your AI lifecycle to improve your models and get solid data insights.
Model debugging
Assessing and debugging machine learning models is critical for model reliability, interpretability, fairness, and compliance. It helps determine how and why AI systems behave the way they do. You can then use this knowledge to improve model performance. Conceptually, model debugging consists of three stages:
Identify, to understand and recognize model errors and/or fairness issues by addressing the following questions:
"What kinds of errors does my model have?"
"In what areas are errors most prevalent?"
Diagnose, to explore the reasons behind the identified errors by addressing these questions:
"What are the causes of these errors?"
"Where should I focus my resources to improve my model?"
Mitigate, to use the identification and diagnosis insights from previous stages to take targeted mitigation steps and address questions such as:
"How can I improve my model?"
"What social or technical solutions exist for these issues?"

The following table describes when to use Responsible AI dashboard components to support model debugging:
| Stage | Component | Description |
|---|---|---|
| Identify | Error analysis | The error analysis component helps you get a deeper understanding of model failure distribution and quickly identify erroneous cohorts (subgroups) of data. The capabilities of this component in the dashboard come from the Error Analysis package. |
| Identify | Fairness analysis | The fairness component defines groups in terms of sensitive attributes like sex, race, and age. It then assesses how your model predictions affect these groups and how you can mitigate disparities. It evaluates the performance of your model by exploring the distribution of your prediction values and the values of your model performance metrics across the groups. The capabilities of this component in the dashboard come from the Fairlearn package. |
| Identify | Model overview | The model overview component aggregates model assessment metrics in a high-level view of model prediction distribution for better investigation of model performance. This component also enables group fairness assessment by highlighting the breakdown of model performance across sensitive groups. |
| Diagnose | Data analysis | Data analysis visualizes datasets based on predicted and actual outcomes, error groups, and specific features. You can then identify issues of overrepresentation and underrepresentation, and you can see how data is clustered in the dataset. |
| Diagnose | Model interpretability | The interpretability component generates human-understandable explanations of the predictions of a machine learning model. It provides multiple views into a model's behavior: - Global explanations (for example, which features affect the overall behavior of a loan allocation model) - Local explanations (for example, why an applicant's loan application is approved or rejected) The capabilities of this component in the dashboard come from the InterpretML package. |
| Diagnose | Counterfactual analysis and what-if | This component consists of two functionalities for better error diagnosis: - Generating a set of examples in which minimal changes to a particular point alter the model's prediction. That is, the examples show the closest data points that provide opposite model predictions. - Enabling interactive and custom what-if perturbations for individual data points to understand how the model reacts to feature changes. The capabilities of this component in the dashboard come from the DiCE package. |
Mitigation steps are available via standalone tools such as Fairlearn. For more information, see the unfairness mitigation algorithms.
Responsible decision-making
Decision-making is one of the biggest promises of machine learning. The Responsible AI dashboard can help you make informed business decisions through:
Data-driven insights, to further understand causal treatment effects on an outcome by using historical data only. For example:
"How would a medicine affect a patient's blood pressure?"
"How would providing promotional values to certain customers affect revenue?"
These insights are provided through the causal inference component of the dashboard.
Model-driven insights, to answer users' questions (such as "What can I do to get a different outcome from your AI next time?") so they can take action. These insights are provided to data scientists through the counterfactual what-if component.
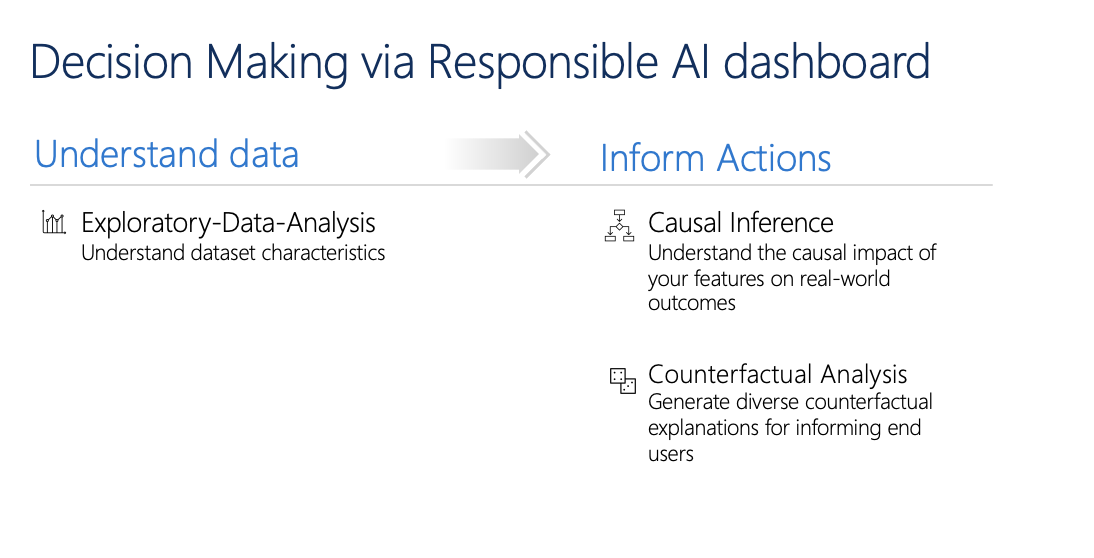
Exploratory data analysis, causal inference, and counterfactual analysis capabilities can help you make informed model-driven and data-driven decisions responsibly.
These components of the Responsible AI dashboard support responsible decision-making:
Data analysis. You can reuse the data analysis component here to understand data distributions and to identify overrepresentation and underrepresentation. Data exploration is a critical part of decision making, because it isn't feasible to make informed decisions about a cohort that's underrepresented in the data.
Causal inference. The causal inference component estimates how a real-world outcome changes in the presence of an intervention. It also helps construct promising interventions by simulating feature responses to various interventions and creating rules to determine which population cohorts would benefit from a particular intervention. Collectively, these functionalities allow you to apply new policies and effect real-world change.
The capabilities of this component come from the EconML package, which estimates heterogeneous treatment effects from observational data via machine learning.
Counterfactual analysis. You can reuse the counterfactual analysis component here to generate minimum changes applied to a data point's features that lead to opposite model predictions. For example: Taylor would have obtained the loan approval from the AI if they earned $10,000 more in annual income and had two fewer credit cards open.
Providing this information to users informs their perspective. It educates them on how they can take action to get the desired outcome from the AI in the future.
The capabilities of this component come from the DiCE package.
Reasons for using the Responsible AI dashboard
Although progress has been made on individual tools for specific areas of Responsible AI, data scientists often need to use various tools to holistically evaluate their models and data. For example, they might need to use model interpretability and fairness assessment together.
If data scientists discover a fairness issue by using one tool, they then need to use a different tool to understand what data or model factors lie at the root of the issue before taking any steps on mitigation. The following factors further complicate this challenging process:
- There's no central location for discovering and learning about the tools, extending the time it takes to research and learn new techniques.
- The different tools don't communicate with each other. Data scientists must wrangle the datasets, models, and other metadata as they pass them between the tools.
- The metrics and visualizations aren't easily comparable, and the results are hard to share.
The Responsible AI dashboard challenges this status quo. It's a comprehensive yet customizable tool that brings together fragmented experiences in one place. It enables you to seamlessly onboard to a single customizable framework for model debugging and data-driven decision-making.
By using the Responsible AI dashboard, you can create dataset cohorts, pass those cohorts to all of the supported components, and observe your model health for your identified cohorts. You can further compare insights from all supported components across a variety of prebuilt cohorts to perform disaggregated analysis and find the blind spots of your model.
When you're ready to share those insights with other stakeholders, you can extract them easily by using the Responsible AI PDF scorecard. Attach the PDF report to your compliance reports, or share it with colleagues to build trust and get their approval.
Ways to customize the Responsible AI dashboard
The Responsible AI dashboard's strength lies in its customizability. It enables you to design tailored, end-to-end model debugging and decision-making workflows that address your particular needs.
Need some inspiration? Here are some examples of how the dashboard's components can be put together to analyze scenarios in diverse ways:
| Responsible AI dashboard flow | Use case |
|---|---|
| Model overview > error analysis > data analysis | To identify model errors and diagnose them by understanding the underlying data distribution |
| Model overview > fairness assessment > data analysis | To identify model fairness issues and diagnose them by understanding the underlying data distribution |
| Model overview > error analysis > counterfactuals analysis and what-if | To diagnose errors in individual instances with counterfactual analysis (minimum change to lead to a different model prediction) |
| Model overview > data analysis | To understand the root cause of errors and fairness issues introduced via data imbalances or lack of representation of a particular data cohort |
| Model overview > interpretability | To diagnose model errors by understanding how the model made its predictions |
| Data analysis > causal inference | To distinguish between correlations and causations in the data or decide the best treatments to apply to get a positive outcome |
| Interpretability > causal inference | To learn whether the factors that the model used for prediction-making have any causal effect on the real-world outcome |
| Data analysis > counterfactuals analysis and what-if | To address customers' questions about what they can do next time to get a different outcome from an AI system |
Roles that should use the Responsible AI dashboard
The following roles can use the Responsible AI dashboard, and its corresponding Responsible AI scorecard, to build trust with AI systems:
- Machine learning professionals and data scientists who want to debug and improve their machine learning models before deployment
- Machine learning professionals and data scientists who want to share their model health records with product managers and business stakeholders to build trust and receive deployment permissions
- Product managers and business stakeholders who are reviewing machine learning models before deployment
- Risk officers who are reviewing machine learning models to understand fairness and reliability issues
- Providers of AI solutions who want to explain model decisions to users or help them improve the outcome
- Professionals in heavily regulated spaces who need to review machine learning models with regulators and auditors
Supported scenarios and limitations
- The Responsible AI dashboard currently supports regression and classification (binary and multi-class) models trained on tabular structured data.
- The Responsible AI dashboard currently supports MLflow models that are registered in Azure Machine Learning with a sklearn (scikit-learn) implementation only. The scikit-learn models should implement
predict()/predict_proba()methods, or the model should be wrapped within a class that implementspredict()/predict_proba()methods. The models must be loadable in the component environment and must be pickleable. - The Responsible AI dashboard currently visualizes up to 5 thousand data points on the dashboard UI. You should downsample your dataset to 5 thousand data points or less before passing it to the dashboard.
- The dataset inputs to the Responsible AI dashboard must be pandas DataFrames in Parquet format. NumPy and SciPy sparse data is currently not supported.
- The Responsible AI dashboard currently supports numeric or categorical features. For categorical features, you need to explicitly specify the feature names.
- The Responsible AI dashboard currently doesn't support datasets with more than 10 thousand columns.
- The Responsible AI dashboard currently doesn't support the AutoML MLFlow model.
- The Responsible AI dashboard currently doesn't support registered AutoML models from the UI.
Next steps
- Learn how to generate the Responsible AI dashboard via CLI and SDK or Azure Machine Learning studio UI.
- Learn how to generate a Responsible AI scorecard based on the insights observed on the Responsible AI dashboard.