View a business case (preview)
This article describes how to review the business case reports for on-premises servers and workloads in your datacenter with Azure Migrate: Discovery and assessment tool.
Azure Migrate helps you to plan and execute migration and modernization projects to Azure. Azure Migrate provides a centralized hub to track discovery, assessment, and migration of on-premises infrastructure, applications, and data to Azure. The hub provides Azure tools for assessment and migration, as well as third-party Independent Software Vendor (ISV) offerings.
Prerequisites
- Build a business case if you have not built one already.
Review the business case
There are four major reports that you need to review:
- Overview: This report is an executive summary of the business case and covers:
- Potential savings (TCO).
- Estimated year on year cashflow savings based on the estimated migration completed that year.
- Savings from unique Azure benefits like Azure Hybrid Benefit.
- Savings from Security and Management capabilities.
- Discovery insights covering the scope of the business case.
- Support status of the operating system and database licenses.
- On-premises vs Azure: This report covers the breakdown of the total cost of ownership by cost categories and insights on savings.
- Azure IaaS: This report covers the Azure and on-premises footprint of the servers and workloads recommended for migrating to Azure IaaS.
- On-premises vs AVS (Azure VMware Solution): In case you build a business case to “Migrate to AVS”, you’ll see this report which covers the AVS and on-premises footprint of the workloads for migrating to AVS.
- Azure PaaS: This report covers the Azure and on-premises footprint of the workloads recommended for migrating to Azure PaaS.
View a business case
In Servers, databases and web apps > Azure Migrate: Discovery and assessment, select the number below Total migration business cases.
In Business Case, select a business case to open it. As an example (estimations and costs, for example, only):
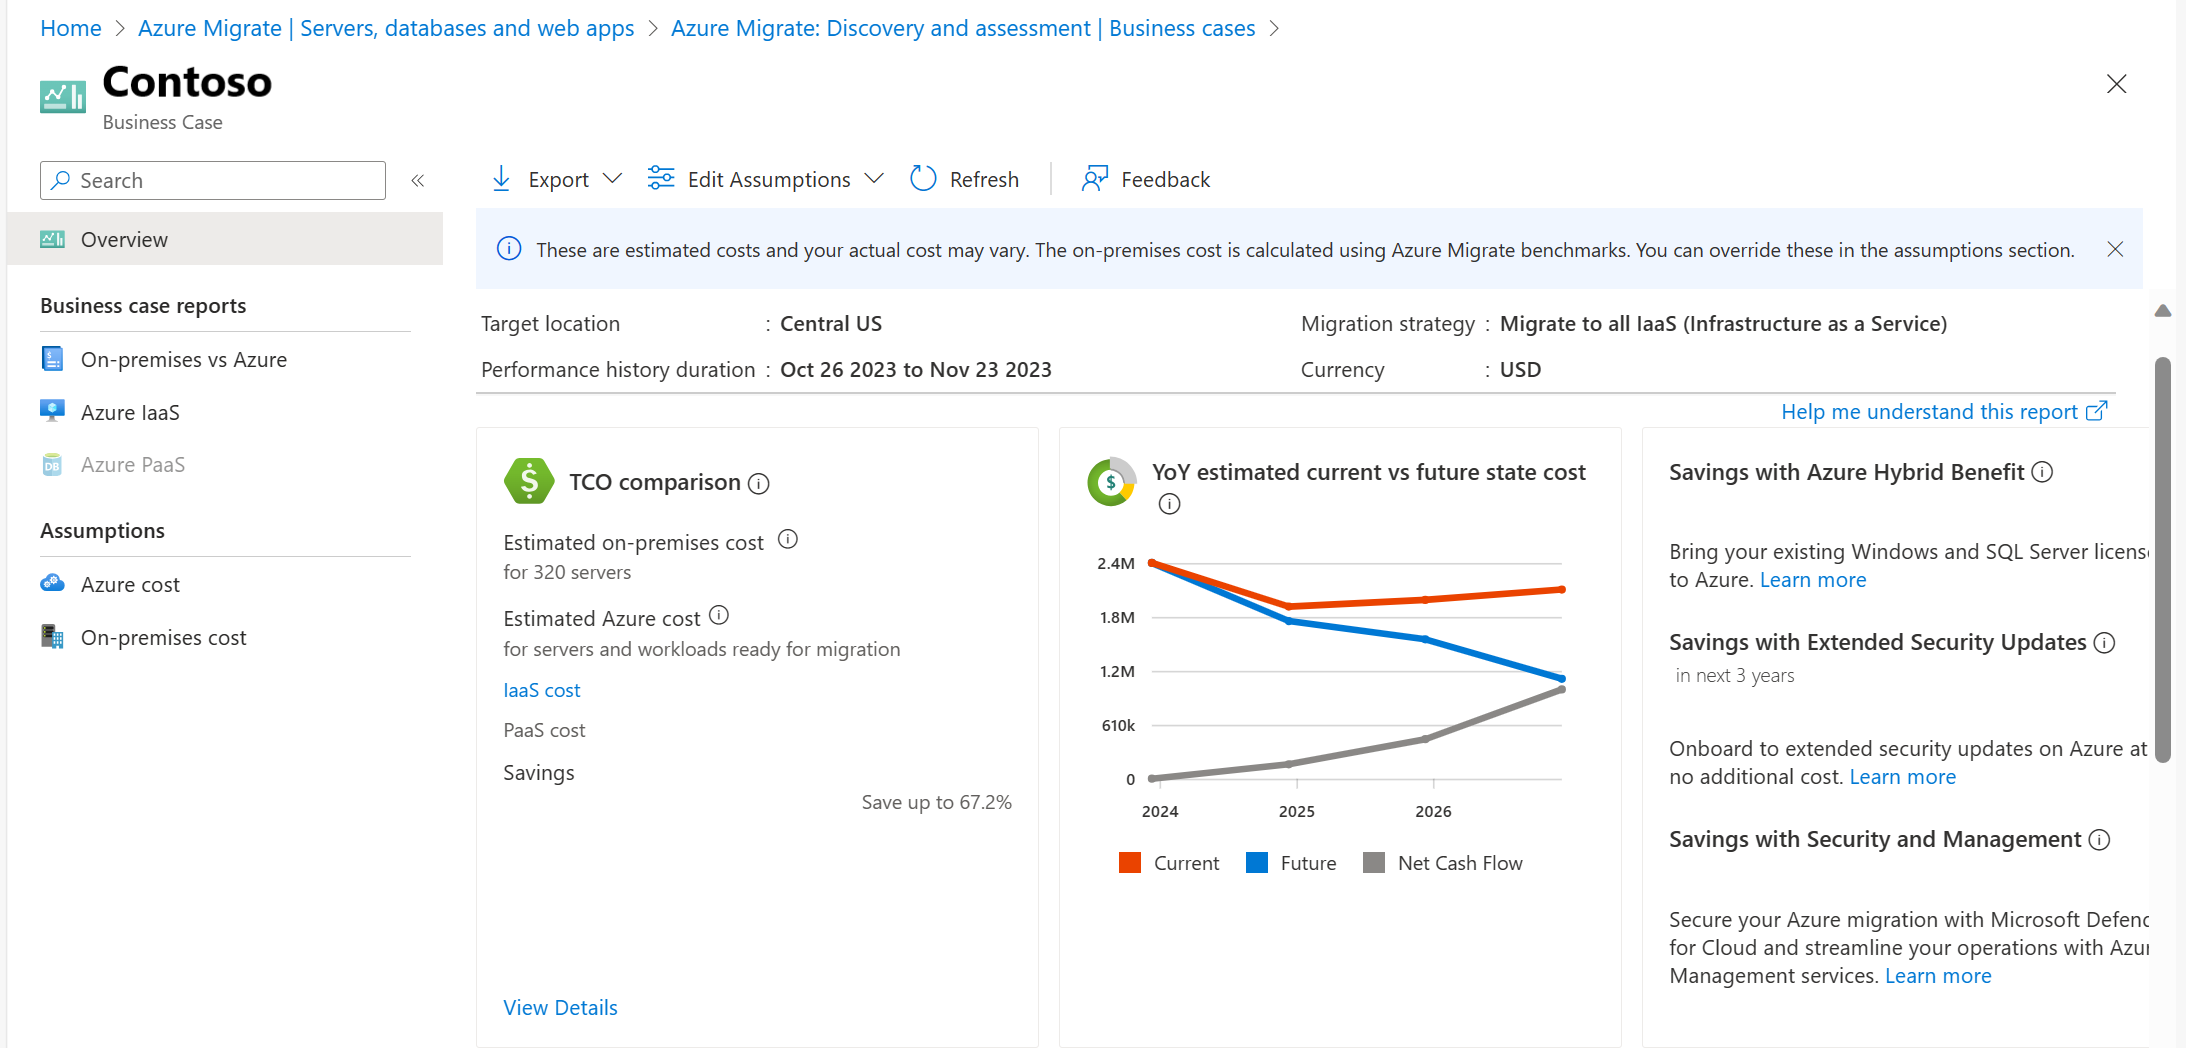

Overview report
Potential savings
This card covers your potential total cost of ownership savings based on the chosen migration strategy. It includes one year savings from compute, storage, network, labor, and facilities cost (based on assumptions) to help you envision how Azure benefits can turn into cost savings. You can see the insights of different cost categories in the On-premises vs Azure report.
Estimated on-premises cost
It covers the cost of running all the servers scoped in the business case using some of the industry benchmarks. It doesn't cover Facilities (lease/colocation/power) cost by default, but you can edit it in the on-premises cost assumptions section. It includes one time cost for some of the capital expenditures like hardware acquisition etc., and annual cost for other components that you might pay as operating expenses like maintenance etc.
Estimated Azure cost
It covers the cost of all servers and workloads that have been identified as ready for migration/modernization as per the recommendation. Refer to the respective Azure IaaS and Azure PaaS report for details. The Azure cost is calculated based on the right sized Azure configuration, ideal migration target and most suitable pricing offers for your workloads. You can override the migration strategy, target location or other settings in the 'Azure cost' assumptions to see how your savings could change by migrating to Azure.
YoY estimated current vs future state cost
As you plan to migrate to Azure in phases, this line chart shows your cashflow per year based on the estimated migration completed that year. By default, it's assumed that you'll migrate 0% in the current year, 20% in Year 1, 50% in Year 2, and 100% in Year 3.
- Current state cost shows how your net cashflow will be on-premises, given your infrastructure is growing 5% per year.
- The future state cost shows how your net cashflow will be as you migrate some percentage to Azure per year as in the 'Azure cost' assumptions, while your infrastructure is growing 5% per year.
Savings with Azure Hybrid Benefits
This card shows a static percentage of maximum savings you could get with Azure hybrid Benefits.
Savings with Extended security updates
It shows the potential savings with respect to extended security update license. It's the cost of extended security update license required to run Windows Server and SQL Server securely after the end of support of its licenses on-premises. Extended security updates are offered at no additional cost on Azure.
Savings with security and management
It shows the potential savings with respect to securing your migration with Microsoft Defender for Cloud and Azure Management services including Azure Monitor, Azure Backup and Azure Update Manager for streamlining your operations.
Discovery insights
It covers the total servers scoped in the business case computation, virtualization distribution, utilization insights, support status of the licenses, and distribution of servers based on workloads running on them.
Utilization insights
It covers which servers are ideal for cloud, servers that can be decommissioned on-premises, and servers that can't be classified based on resource utilization/performance data:
- Ideal for cloud: These servers are best fit for migrating to Azure and comprises of active and idle servers:
- Active servers: These servers delivered business value by being on and had their CPU and memory utilization above 5% and network utilization above 2%.
- Idle servers: These servers were on but didn't deliver business value by having their CPU and memory utilization below 5% and network utilization below 2%.
- Decommission: These servers were expected to deliver business value, but didn't and can be decommissioned on-premises and recommended to not migrate to Azure:
- Zombie: The CPU, memory and network utilization were 0% with no performance data collection issues.
- These servers were on but don't have adequate metrics available:
- Unknown: Many servers can land in this section if the discovery is still ongoing or has some unaddressed discovery issues.
On-premises vs Azure report
It covers cost components for on-premises and Azure, savings, and insights to understand the savings better.

Azure IaaS report
This section contains the cost estimate by recommended target (Annual cost and also includes Compute, Storage, Network, labor components) and savings from Hybrid benefits.
- IaaS cost estimate:
- Estimated cost by target: This card includes the cost based on the target.
- Compute and license cost: This card shows the comparison of compute and license cost when using Azure hybrid benefit and without Azure hybrid benefit.
- Savings - This card displays the estimated maximum savings when using Azure hybrid benefit and with extended security updates over a period of one year.
- Azure VM:
- Estimated cost by savings options: This card includes compute cost for Azure VMs. It's recommended that all idle servers are migrated via Pay as you go Dev/Test and others (Active and unknown) are migrated using 3 year Reserved Instance or 3 year Azure Savings Plan to maximize savings.
- Recommended VM family: This card covers the VM sizes recommended. The ones marked Unknown are the VMs that have some readiness issues and no SKUs could be found for them.
- Recommended storage type: This card covers the storage cost distribution across different recommended storage types.
- SQL Server on Azure VM:
This section assumes instance to SQL Server on Azure VM migration recommendation, and the number of VMs here are the number of instances recommended to be migrated as SQL Server on Azure VM:
- Estimated cost by savings options: This card includes compute cost for SQL Server on Azure VMs. It is recommended that all idle servers are migrated via Pay as you go Dev/Test and others (Active and unknown) are migrated using 3 year Reserved Instance or 3 year Azure Savings Plan to maximize savings.
- Recommended VM family: This card covers the VM sizes recommended. The ones marked Unknown are the VMs that have some readiness issues and no SKUs could be found for them.
- Recommended storage type: This card covers the storage cost distribution across different recommended storage types.
Azure PaaS report
This section contains the cost estimate by recommended target (Annual cost and also includes Compute, Storage, Network, labor components) and savings from Hybrid benefits.
- PaaS cost estimate:
- Estimated cost by target: This card includes the cost based on the target.
- Compute and license cost: This card shows the comparison of compute and license cost when using Azure hybrid benefit and without Azure hybrid benefit.
- Savings - This card displays the estimated maximum savings when using Azure hybrid benefit and with extended security updates over a period of one year.
- Azure SQL:
- Estimated cost by savings options: This card includes compute cost for Azure SQL MI. It's recommended that all idle SQL instances are migrated via Pay as you go Dev/Test and others (Active and unknown) are migrated using 3 year Reserved Instance to maximize savings.
- Distribution by recommended service tier : This card covers the recommended service tier.
- Azure App Service and App Service Container:
- Estimated cost by savings options: This card includes Azure App Service Plans cost. It's recommended that the web apps are migrated using 3 year Reserved Instance or 3 year Savings Plan to maximize savings.
- Distribution by recommended plans : This card covers the recommended App Service plan.
- Azure Kubernetes Service:
- Estimated cost by savings options: This card includes the cost of the recommended AKS node pools. It's recommended that the web apps are migrated using 3 year Reserved Instance or 3 year Savings Plan to maximize savings.
- Distribution by recommended Node pool SKU: This card covers the recommended SKUs for AKS node pools.
On-premises vs AVS report
It covers cost components for on-premises and AVS, savings, and insights to understand the savings better.

AVS report
This section contains the cost estimate by recommended target (Annual cost includes Compute, Storage, Network, labor components) and savings from Hybrid benefits.
- AVS cost estimate:
- Estimated AVS cost: This card includes the total cost of ownership for hosting all workloads on AVS including the AVS nodes cost (which includes storage cost), networking and labor cost. The node cost is computed by taking the most cost optimum AVS node SKU. A default CPU over-subscription of 4:1, 100% memory overcommit and compression and deduplication factor of 1.5 is assumed to get the compute cost of AVS. You can learn more about this here. External storage options like ANF aren’t a part of the business case yet.
- Compute and license cost: This card shows the comparison of compute and license cost when using Azure hybrid benefit and without Azure hybrid benefit.
- Savings and optimization:
- Savings with 3-year RI: This card shows the node cost with 3-year RI.
- Savings with Azure Hybrid Benefit & Extended Security Updates: This card displays the estimated maximum savings when using Azure hybrid benefit and with extended security updates over a period of one year.
Next steps
- Learn more about how business cases are calculated.
Feedback
Coming soon: Throughout 2024 we will be phasing out GitHub Issues as the feedback mechanism for content and replacing it with a new feedback system. For more information see: https://aka.ms/ContentUserFeedback.
Submit and view feedback for