Note
Access to this page requires authorization. You can try signing in or changing directories.
Access to this page requires authorization. You can try changing directories.
In this article, you learn about the metrics for network security perimeter. You learn about the available metrics, how to access them, and how to use them. Then, you learn how to enable metrics through the Azure portal, discover common monitoring scenarios, create alerts, and how they differ from diagnostic logs.
Important
Network security perimeter metrics are generally available in all Azure public cloud regions with Azure Storage and Azure Key Vault. They're available in preview with Azure SQL Database and Azure Cosmos DB. Preview features are provided without a service-level agreement (SLA) and aren't recommended for production workloads. For more information, see Supplemental Terms of Use for Microsoft Azure Previews.
Introduction
Network security perimeter metrics provide visibility into access activity for resources protected by a network security perimeter. These metrics help administrators monitor network access patterns, understand the impact of the access rules, and identify unexpected traffic behavior across protected resources. You can access these metrics through Azure Monitor and use them to create dashboards, alerts, and operational monitoring experiences.
Why use network security perimeter metrics?
When resources are protected by a network security perimeter, administrators often need to understand how perimeter rules affect application traffic. Network security perimeter metrics capture access requests evaluated by the data plane and provide visibility into network activity associated with the perimeter-protected resources. They provide an aggregated view of access activity and enable monitoring scenarios such as:
Tracking approved and denied access requests.
Monitoring inbound and outbound access activity.
Understanding traffic patterns across protected resources, profiles, access modes, and access rule versions.
Detecting unexpected access attempts.
Validating the impact of access rules changes.
Establishing a baseline before moving a perimeter from Transition mode to Enforced mode.
Network security perimeter metrics provide aggregated time-series data that is optimized for monitoring, alerting, and trend analysis.
Access network security perimeter metrics
Access network security perimeter metrics through Azure Monitor.
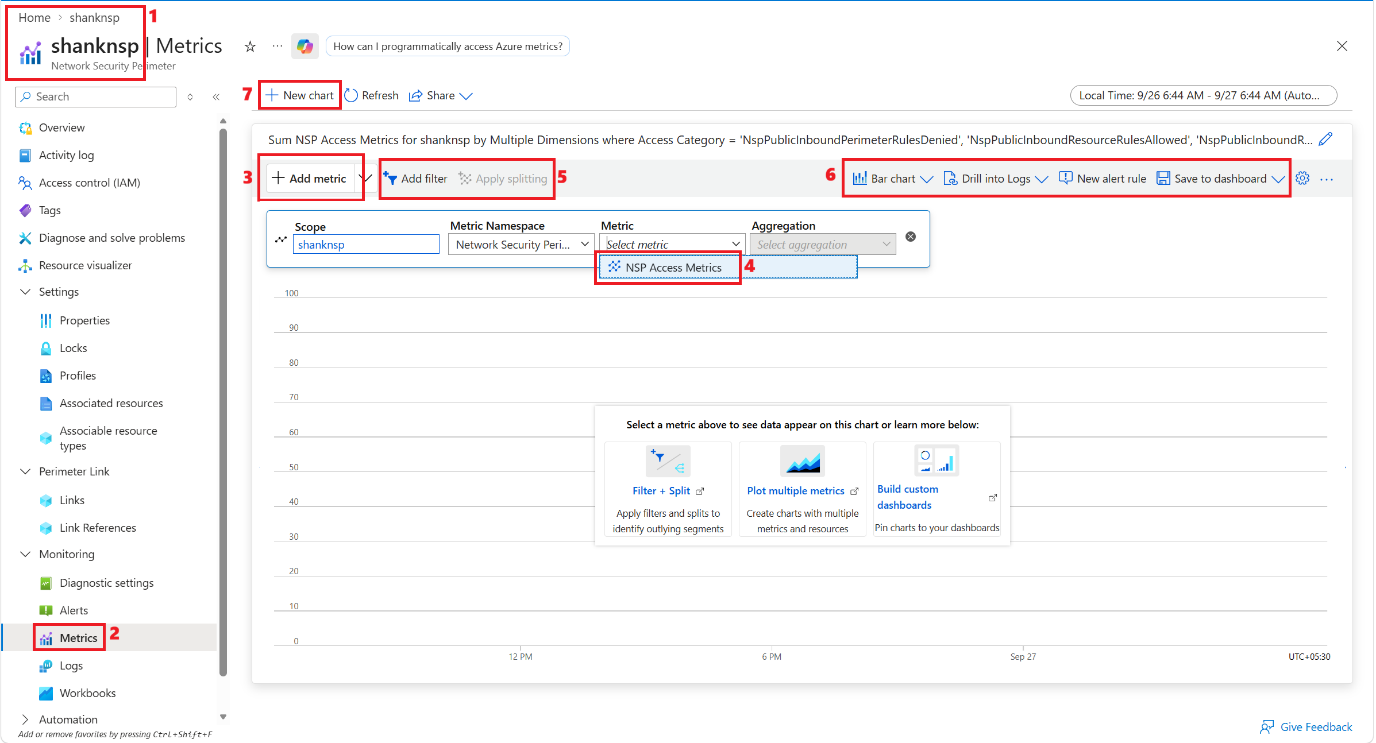
In the Azure portal, navigate to your Network Security Perimeter resource.
Select Metrics under the Monitoring section.
Select Add Metric.
Choose the NSP access metrics namespace.
Select a metric and configure filters and splitting as needed.
Use Azure Monitor features to build charts, dashboards, workbooks, and metric alerts.
Create multiple charts for different metrics that you want to monitor.
You can also use regular Azure Monitor features like drilling into the logs, saving the chart as a dashboard, or exporting it to a workbook.
Common monitoring scenarios for metrics
Review these common monitoring scenarios for metrics in Network Security Perimeter.
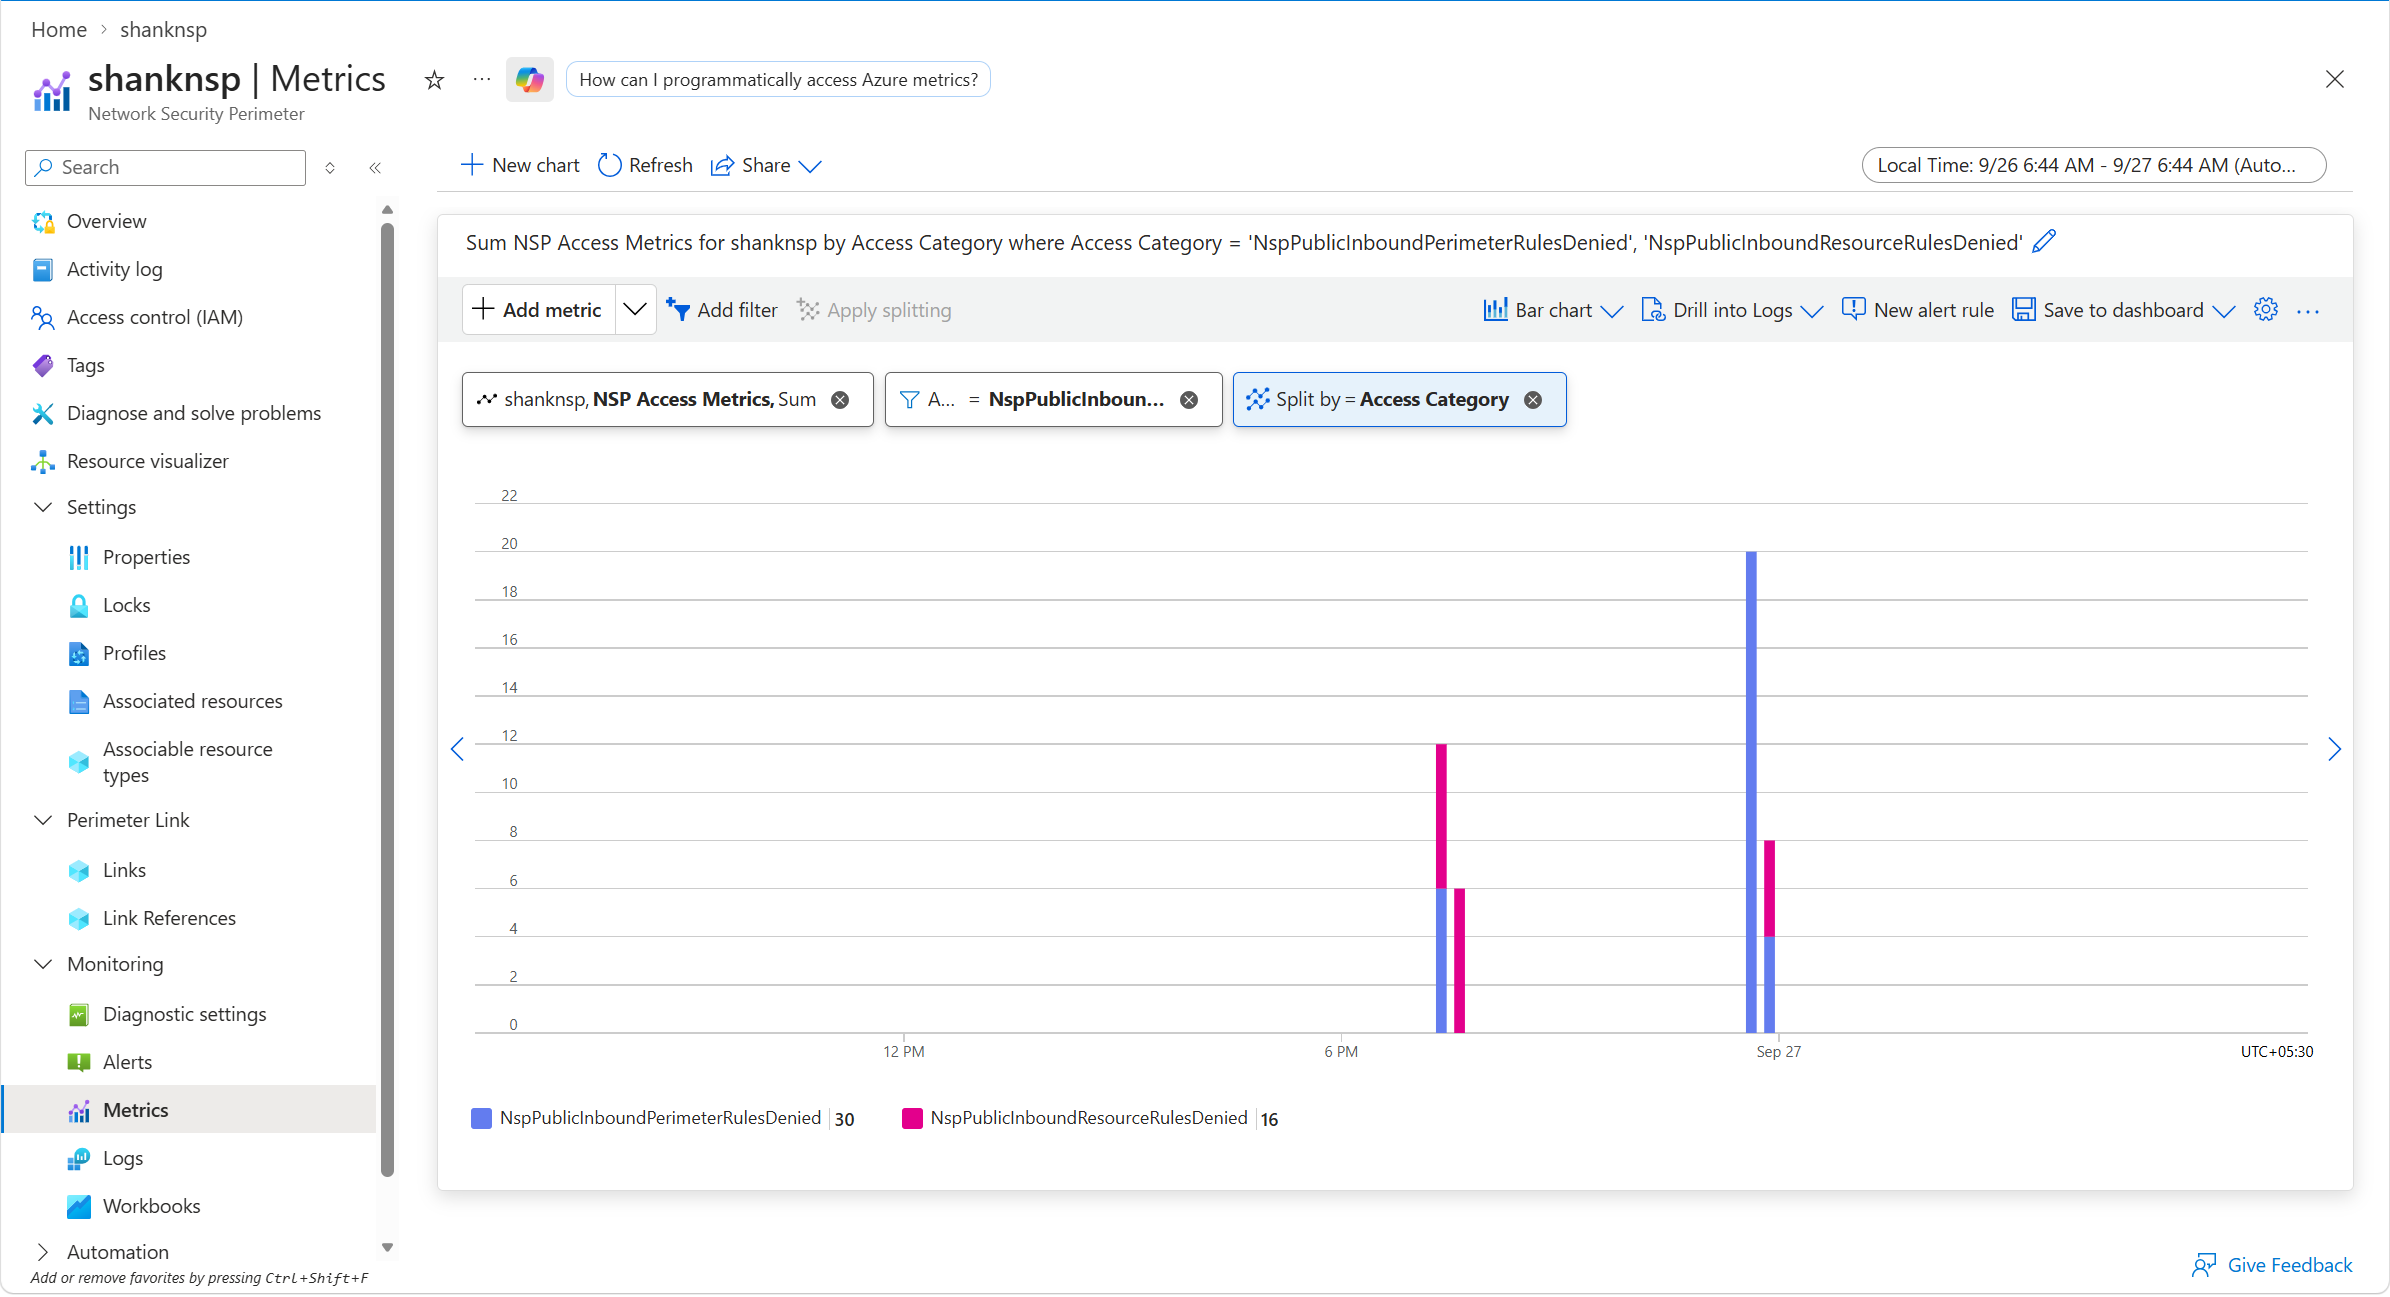
Monitor denied access requests
Denied access requests can indicate missing rules, application configuration changes, or previously unknown communication paths. Monitoring denied traffic can help identify workloads that might require extra perimeter configuration.
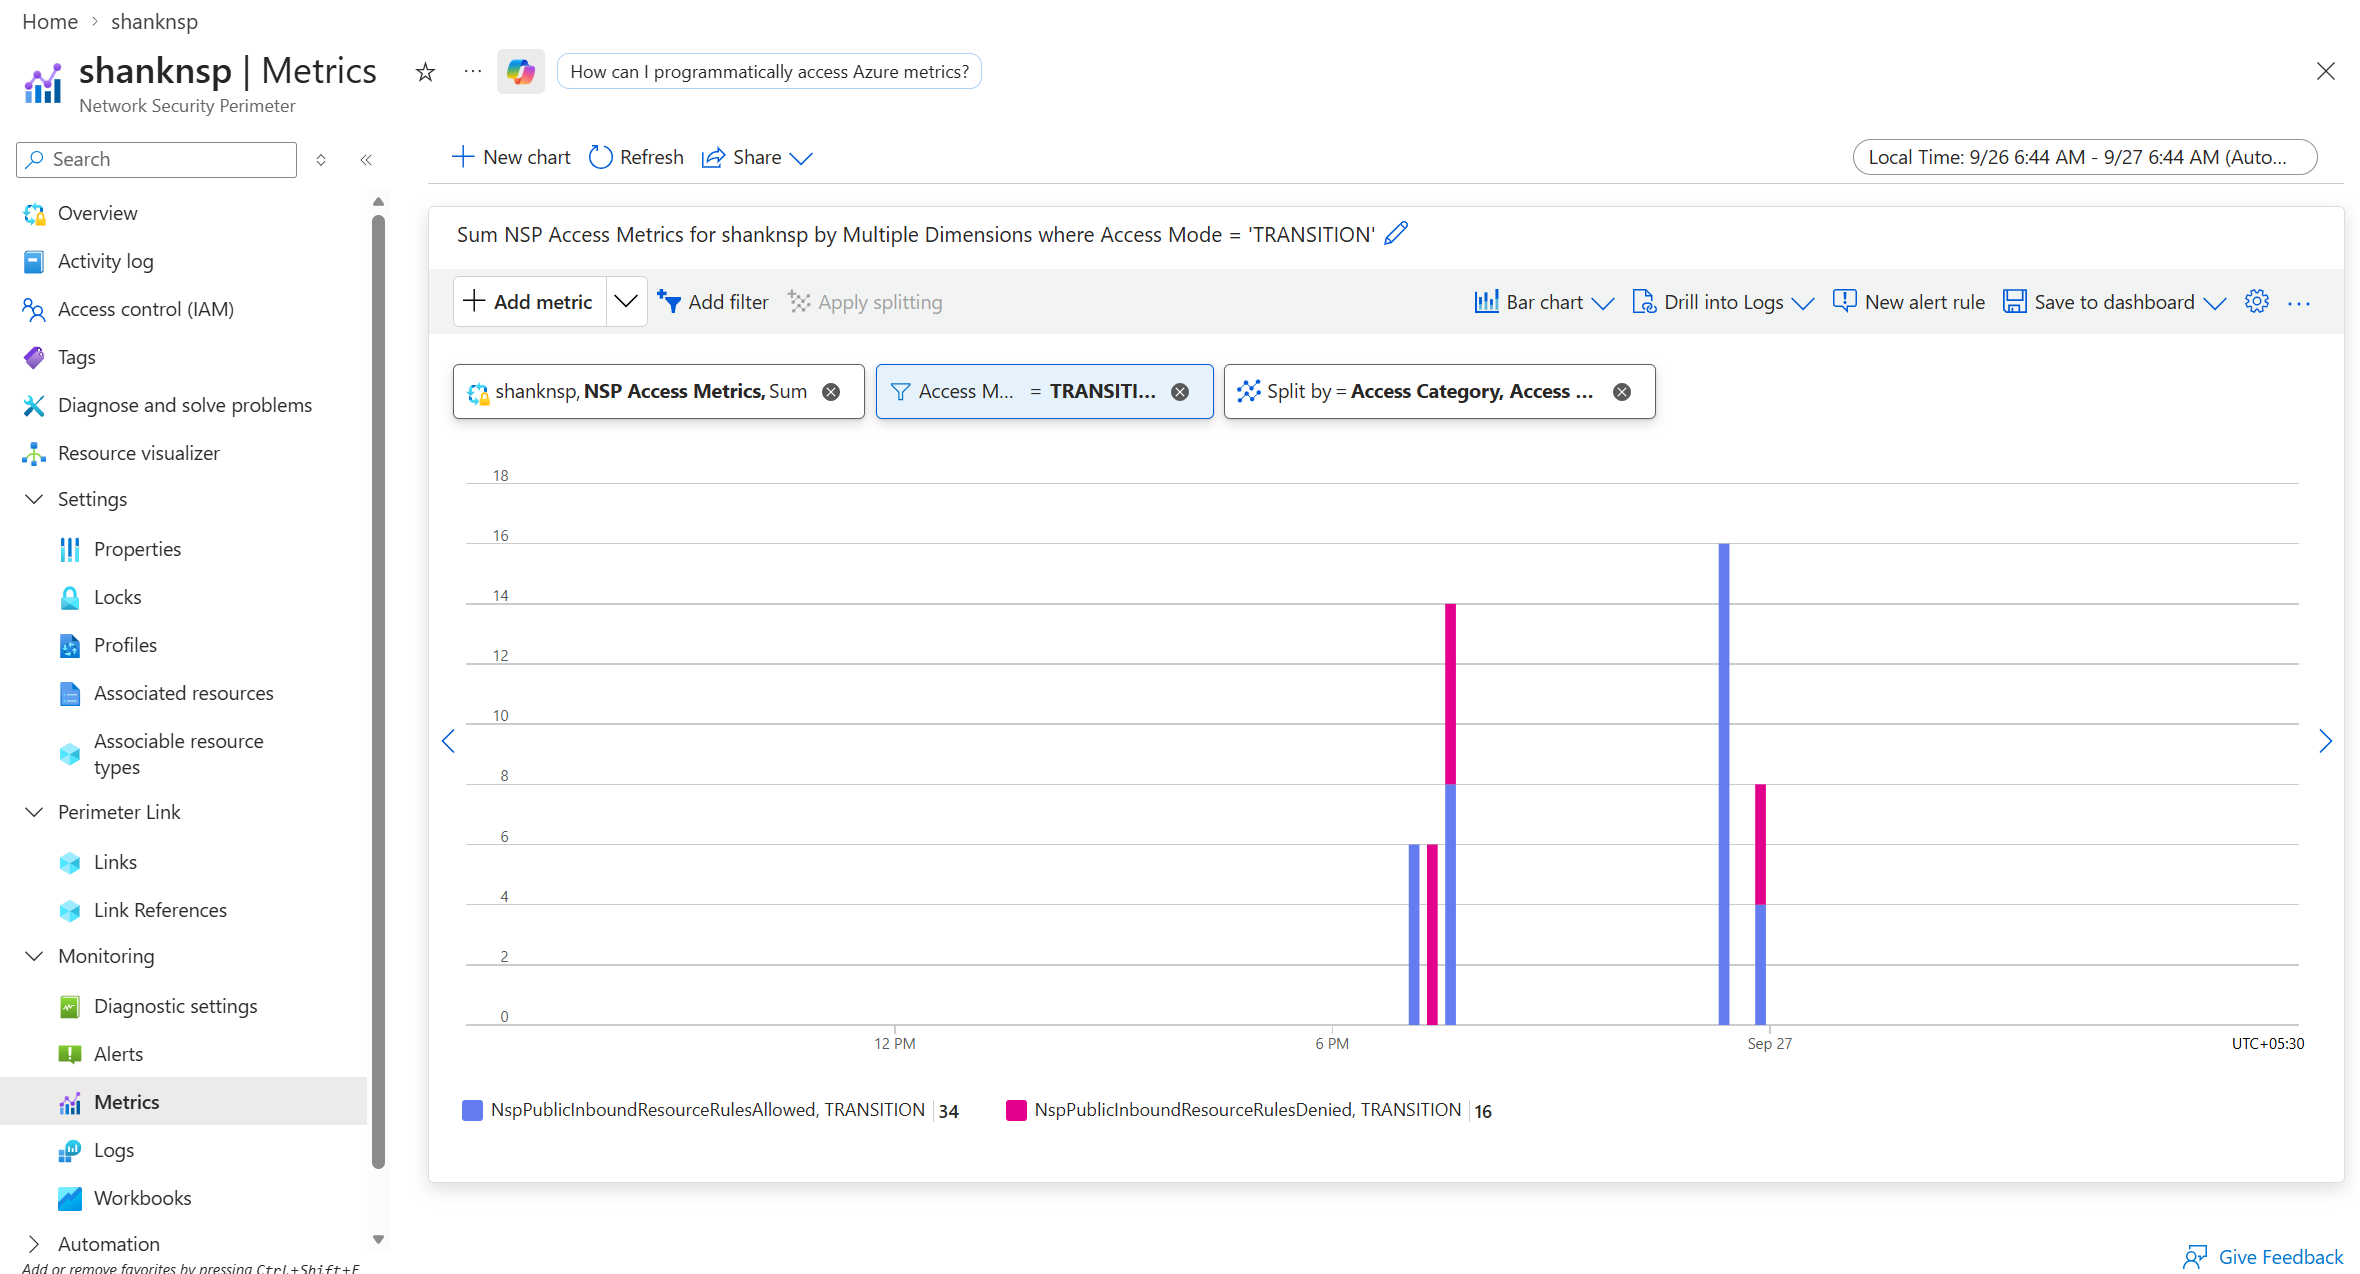
Understand traffic before enforcement
Always deploy network security perimeters in transition mode before enabling enforcement mode. Use metrics to establish a baseline of expected network activity and identify communication patterns to allow before moving to enforcement mode. When resource rules permit incoming requests, add NSP rules so the perimeter can learn the traffic patterns and report the relevant metrics.
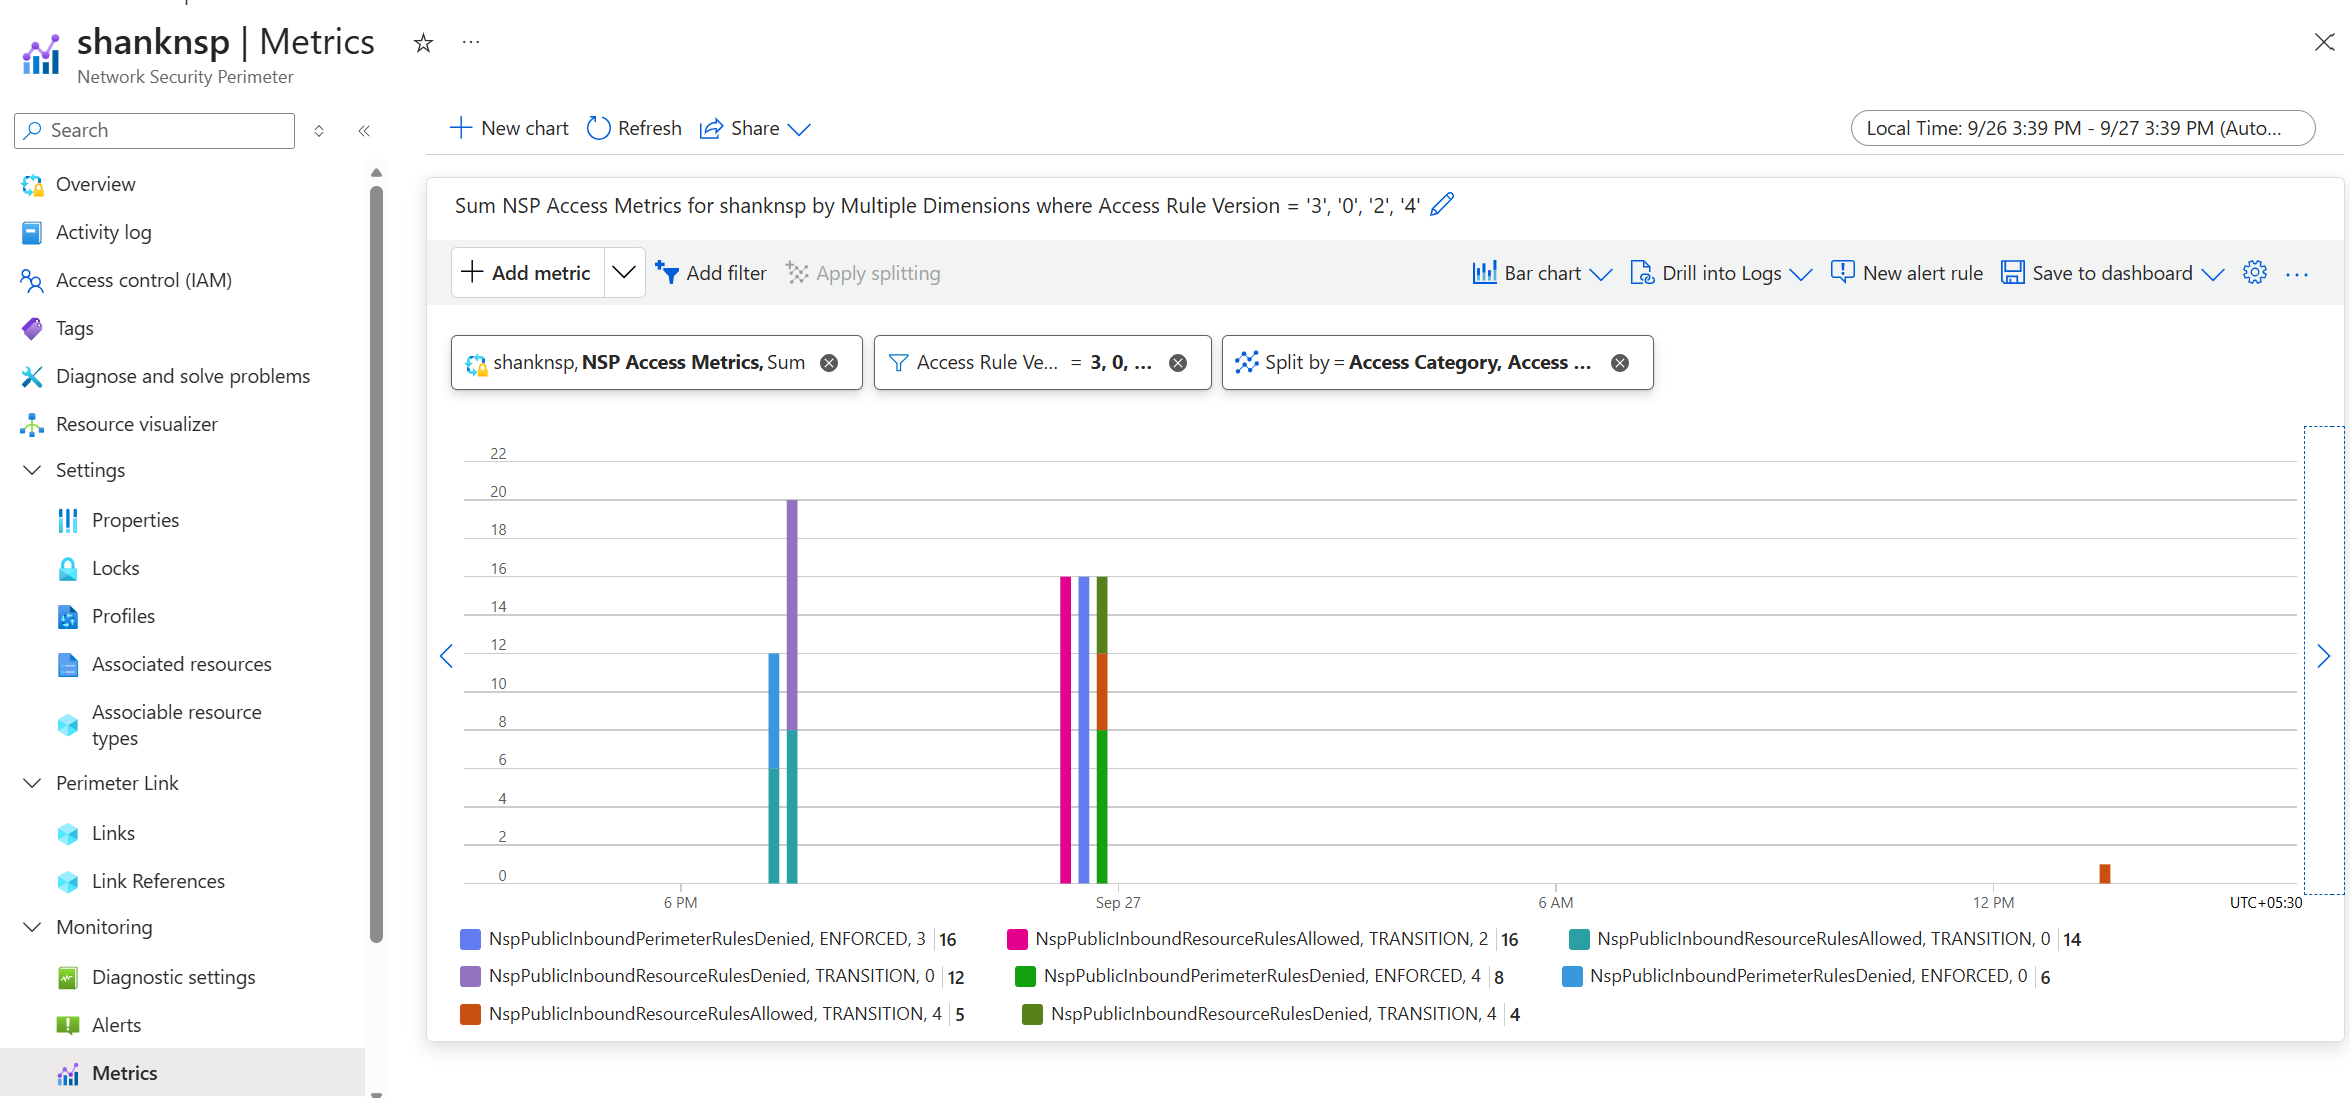
Identify unusual access activity
Trend analysis can help administrators identify unexpected increases in access requests, changes in application behavior, or access patterns that might require further investigation. A sudden spike in denied requests from specific IPs, subscriptions, or any other source can help identify a threat early and can alert the admin to take the necessary action to shield the resources by refining the access rules.
Filtering by access rule version helps you track which version of the access rules evaluated a connection request, enabling dashboard views that correlate traffic patterns and access decisions with rule updates.
Create alerts for operational monitoring
Use Azure Monitor metric alerts to notify administrators by email or mobile SMS for different kinds of signals ranging from all administrative actions to CRUD actions on the network security perimeter. This notification helps the administrators or the necessary points of contact to be aware of the activity in the network and take necessary action when needed.
Metrics versus diagnostic logs
While metrics and diagnostic logs are complementary monitoring tools, metrics provide a high-level operational view and support alerting, while diagnostic logs provide detailed event data for troubleshooting and investigation. The following table gives a high-level differentiation view of one over the other.
| Capability | Metrics | Diagnostic logs |
|---|---|---|
| Trend analysis | Yes | Limited |
| Dashboards and visualizations | Yes | Requires log queries |
| Azure Monitor metric alerts | Yes | No |
| Detailed request information | No | Yes |
| Forensic investigations | No | Yes |
| Operational monitoring | Yes | Yes |
| Readability | Instant | Destination needed |
| Cost implications | Free | Chargeable destinations |