Note
Access to this page requires authorization. You can try signing in or changing directories.
Access to this page requires authorization. You can try changing directories.
The Bloch sphere is a geometric representation of a single-qubit state. The north and south poles of the unit sphere represent the computational basis states $\ket{0}$ and $\ket{1}$. Other points on the surface of the sphere represent different superposition states of the qubit. Use the Bloch sphere to build intuition about how quantum gates affect the state of a qubit.
The Microsoft Quantum Development Kit (QDK) provides an interactive Bloch sphere visualizer in the QDK extension for Visual Studio Code (VS Code) and as a widget for Jupyter Notebook in the QDK Python package. Use the visualizer to build a gate sequence and display how the qubit state changes during the sequence.
For more information about the Bloch sphere and single-qubit states, see The qubit in quantum computing.
Prerequisites
To use the Bloch sphere visualizer in VS Code, install the following:
- The latest version of VS Code, or open VS Code for the Web.
- The latest version of the QDK extension in VS Code.
To use the Bloch sphere visualizer in Python with Jupyter Notebook, install the following:
Python 3.10 or later and pip.
The Python extension and Jupyter extension in VS Code.
The
qdkPython package with thejupyterextra.pip install --upgrade "qdk[jupyter]"
For complete QDK setup instructions, see Set up the Microsoft Quantum Development Kit.
Open the Bloch sphere visualizer
Use the Bloch sphere visualizer in VS Code or Jupyter Notebook.
Open the visualizer in VS Code
- In VS Code, select View > Command Palette.
- Enter QDK: Bloch sphere and select the command.
The visualizer opens in a new tab and starts in the $\ket{0}$ state.
Open the visualizer in Jupyter Notebook
In VS Code, open the View menu and select Command Palette.
Enter Create: New Jupyter Notebook and select the command.
In a notebook cell, import
BlochSphereand create the visualizer widget.from qdk.widgets import BlochSphere BlochSphere()
The widget opens in the cell output and starts in the $\ket{0}$ state.
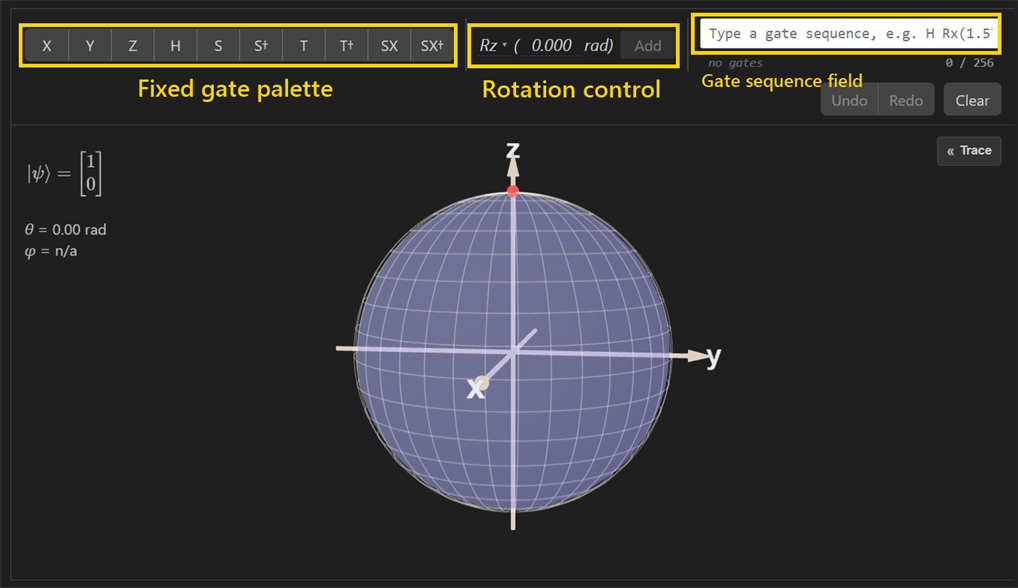
To initialize the visualizer with a gate program, pass the program when you create the widget. Separate each gate with a space. For example, the following code initializes the visualizer with three gates.
from IPython.display import display
from qdk.widgets import BlochSphere

display(BlochSphere("H T H"))
Build a gate sequence
Use the toolbar or the gate sequence field to build a gate sequence. The sphere and state information update as you add gates.
Add fixed gates
To append a gate to the sequence, select a gate from the fixed gate palette. The palette includes these gates:
- Pauli gates:
X,Y, andZ - Hadamard gate:
H - Phase gates and their adjoints:
S,S†,T, andT† - Square root of X gates:
SXandSX†
Add rotation gates
To add a rotation gate, follow these steps:
- In the rotation control, select
Rx,Ry, orRz. - Enter the rotation angle in radians or move the angle control to set the value.
- Select Add to append the rotation gate to the gate sequence.
A popup in the rotation control shows the Clifford+T fixed gate decomposition that approximates the rotation. To append the synthesized fixed gate sequence instead of the native rotation, select Add decomposition. A gate sequence can include native rotations, synthesized Clifford+T sequences, or both.
Enter a gate sequence manually
Enter or edit a complete sequence in the gate sequence field.
The field supports the fixed gates X, Y, Z, H, S, T, and SX. To enter an adjoint gate, use an apostrophe: S', T', and SX'. Separate gates with a space.
For rotations, use Rx(angle), Ry(angle), or Rz(angle), where the angle is in radians. For example:
H Rx(1.5708) S'
Explore the state and gate counts
The interactive sphere includes the following information and controls.
| Element | Description |
|---|---|
| Bloch sphere | Move the camera around the sphere to view the state from different angles. The sphere shows the x, y, and z axes. |
| State marker and trail | The marker shows the current single-qubit state. The trail shows how the gates in the program move the state across the sphere. |
| State values | The visualizer shows the current state in ket notation and its theta (θ) and phi (φ) angles. At either pole, the visualizer shows n/a for φ. When you select an earlier trace row, these values and the sphere show that intermediate state. |
| Gate counts | The toolbar shows the count for each gate type, the T-count, and the total gate count out of the 256-gate limit. |
| Edit controls | Select Undo or Redo to move backward or forward through edits. Select Clear to remove all gates and return to the initial state. |
Inspect and play the state trace
To open the trace window, select the Trace button. To collapse the window, select the Hide button.
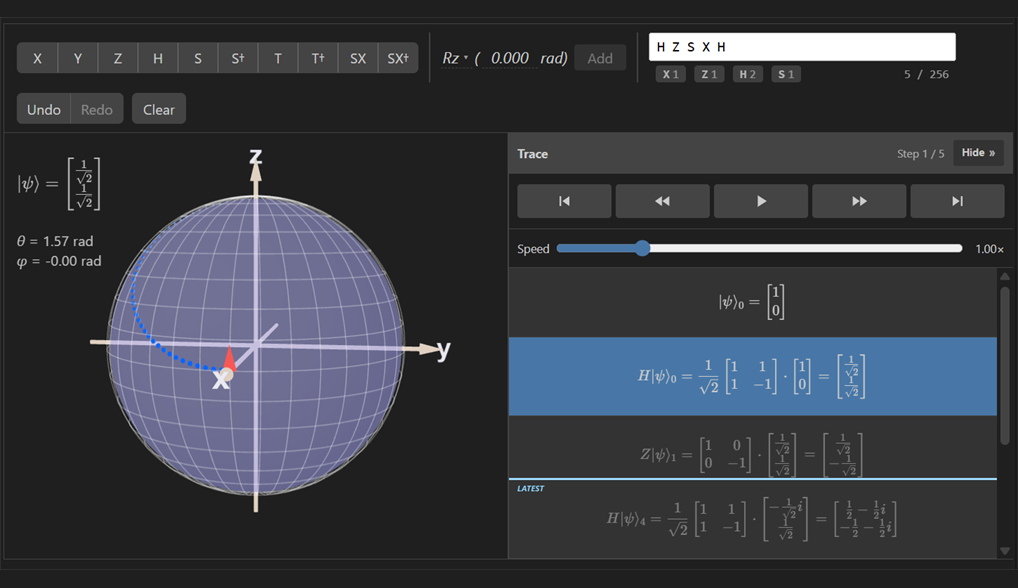
The trace lists the initial state and one row for each gate in the sequence. Each row shows the gate matrix and the resulting qubit state. Select a row to inspect that intermediate state on the sphere. If you select an earlier row and then add a gate, the visualizer discards the later steps and appends the new gate at that point.
Use the playback controls to animate or step through the gate program.
| Control | Action |
|---|---|
| Start | Select the initial state. |
| Back | Move back one step. |
| Play, Pause, or Replay | Play the sequence, pause on the current step, or replay after the animation finishes. |
| Forward | Move forward one step. |
| End | Select the final state. |
When you expand the trace, move the playback speed control to choose an animation speed.