Analyze performance in Azure AI Search
This article describes the tools, behaviors, and approaches for analyzing query and indexing performance in Azure AI Search.
Develop baseline numbers
In any large implementation, it's critical to do a performance benchmarking test of your Azure AI Search service before you roll it into production. You should test both the search query load that you expect, but also the expected data ingestion workloads (if possible, run both workloads simultaneously). Having benchmark numbers helps to validate the proper search tier, service configuration, and expected query latency.
To develop benchmarks, we recommend the azure-search-performance-testing (GitHub) tool.
To isolate the effects of a distributed service architecture, try testing on service configurations of one replica and one partition.
Note
For the Storage Optimized tiers (L1 and L2), you should expect a lower query throughput and higher latency than the Standard tiers.
Use resource logging
The most important diagnostic tool at an administrator's disposal is resource logging. Resource logging is the collection of operational data and metrics about your search service. Resource logging is enabled through Azure Monitor. There are costs associated with using Azure Monitor and storing data, but if you enable it for your service, it can be instrumental in investigating performance issues.
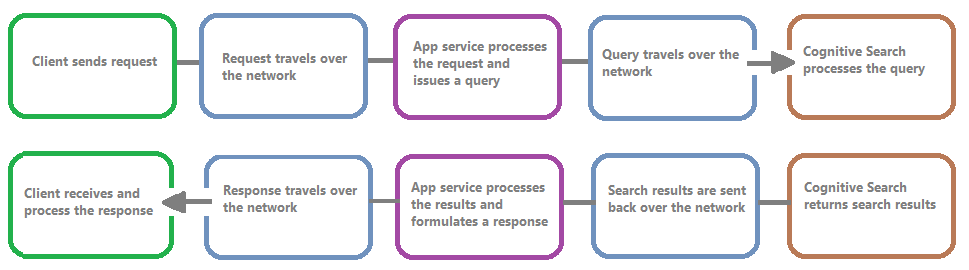
The following image shows the chain of events in a query request and response. Latency can occur at any one of them, whether during a network transfer, processing of content in the app services layer, or on a search service. A key benefit of resource logging is that activities are logged from the search service perspective, which means that the log can help you determine if the performance issue is due to problems with the query or indexing, or some other point of failure.
Resource logging gives you options for storing logged information. We recommend using Log Analytics so that you can execute advanced Kusto queries against the data to answer many questions about usage and performance.
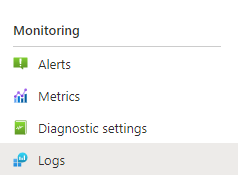
On your search service portal pages, you can enable logging through Diagnostic settings, and then issue Kusto queries against Log Analytics by choosing Logs. For more information about setting up, see Collect and analyze log data.
Throttling behaviors
Throttling occurs when the search service is at capacity. Throttling can occur during queries or indexing. From the client side, an API call results in a 503 HTTP response when it has been throttled. During indexing, there's also the possibility of receiving a 207 HTTP response, which indicates that one or more items failed to index. This error is an indicator that the search service is getting close to capacity.
As a rule of thumb, try to quantify the amount of throttling and any patterns. For example, if one search query out of 500,000 is throttled, it might not be worth investigating. However, if a large percentage of queries is throttled over a period, this would be a greater concern. By looking at throttling over a period, it also helps to identify time frames where throttling might more likely occur and help you decide how to best accommodate that.
A simple fix to most throttling issues is to throw more resources at the search service (typically replicas for query-based throttling, or partitions for indexing-based throttling). However, increasing replicas or partitions adds cost, which is why it's important to know the reason why throttling is occurring at all. Investigating the conditions that cause throttling will be explained in the next several sections.
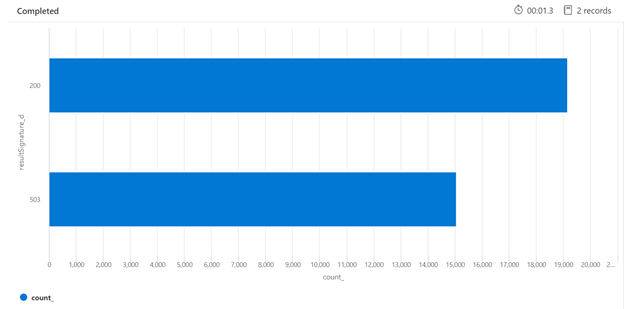
Below is an example of a Kusto query that can identify the breakdown of HTTP responses from the search service that has been under load. Over a 7-day period, the rendered bar chart shows that a relatively large percentage of the search queries were throttled, in comparison to the number of successful (200) responses.
AzureDiagnostics
| where TimeGenerated > ago(7d)
| summarize count() by resultSignature_d
| render barchart
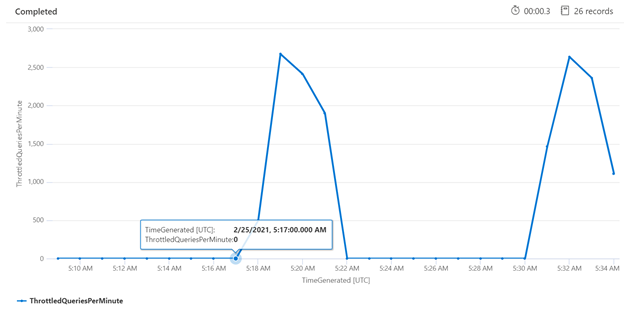
Examining throttling over a specific time period can help you identify the times where throttling might occur more frequently. In the below example, a time series chart is used to show the number of throttled queries that occurred over a specified time frame. In this case, the throttled queries correlated with the times in with the performance benchmarking was performed.
let ['_startTime']=datetime('2021-02-25T20:45:07Z');
let ['_endTime']=datetime('2021-03-03T20:45:07Z');
let intervalsize = 1m;
AzureDiagnostics
| where TimeGenerated > ago(7d)
| where resultSignature_d != 403 and resultSignature_d != 404 and OperationName in ("Query.Search", "Query.Suggest", "Query.Lookup", "Query.Autocomplete")
| summarize
  ThrottledQueriesPerMinute=bin(countif(OperationName in ("Query.Search", "Query.Suggest", "Query.Lookup", "Query.Autocomplete") and resultSignature_d == 503)/(intervalsize/1m), 0.01)
  by bin(TimeGenerated, intervalsize)
| render timechart
Measure individual queries
In some cases, it can be useful to test individual queries to see how they're performing. To do this, it's important to be able to see how long the search service takes to complete the work, as well as how long it takes to make the round-trip request from the client and back to the client. The diagnostics logs could be used to look up individual operations, but it might be easier to do this all from a REST client.
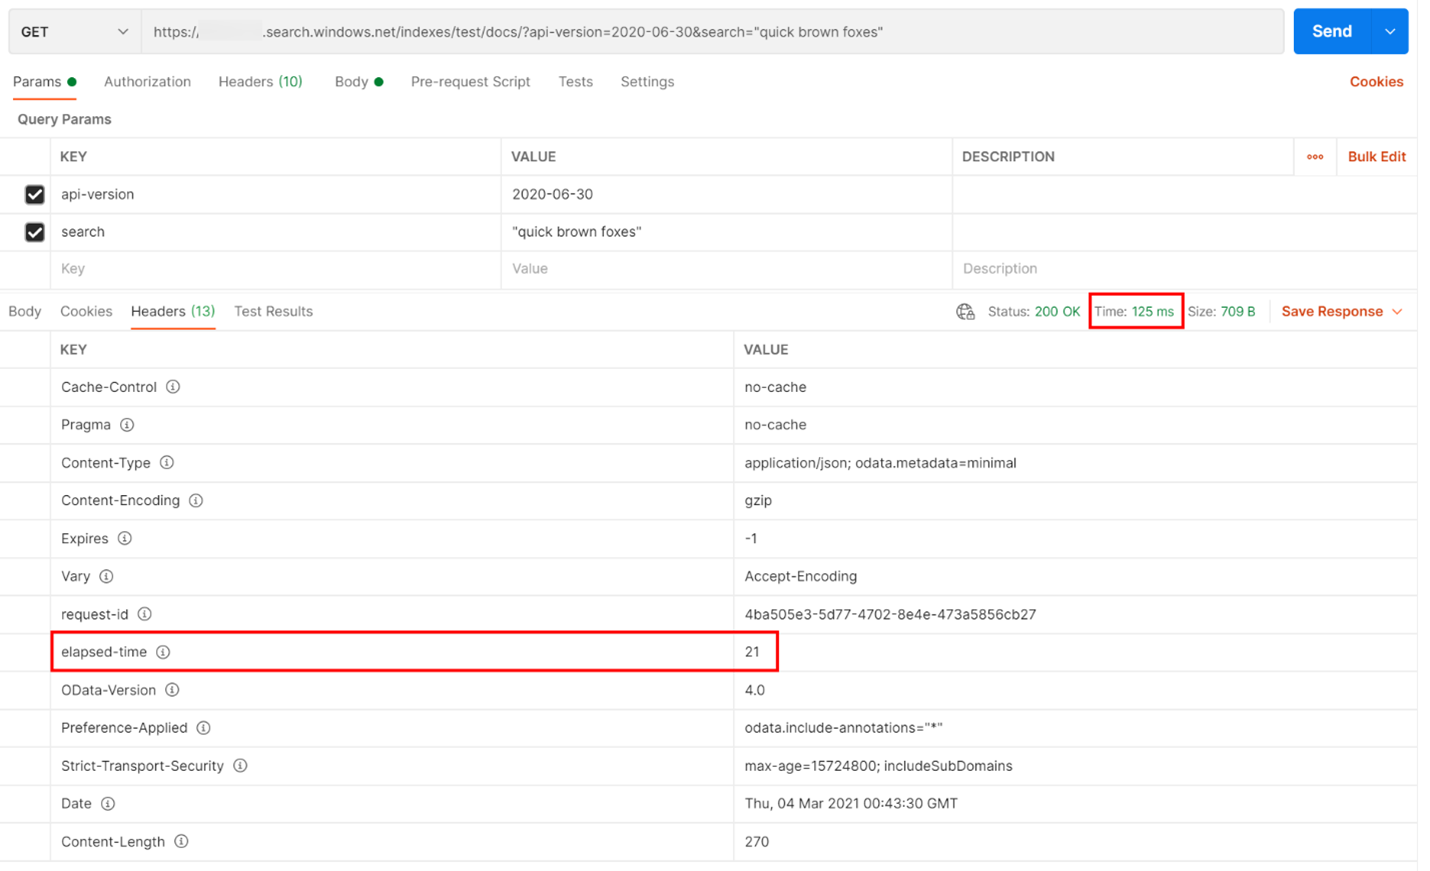
In the example below, a REST-based search query was executed. Azure AI Search includes in every response the number of milliseconds it takes to complete the query, visible in the Headers tab, in "elapsed-time". Next to Status at the top of the response, you'll find the round-trip duration, in this case, 418 milliseconds (ms). In the results section, the “Headers” tab was chosen. Using these two values, highlighted with a red box in the image below, we see the search service took 21 ms to complete the search query and the entire client round-trip request took 125 ms. By subtracting these two numbers we can determine that it took 104-ms additional time to transmit the search query to the search service and to transfer the search results back to the client.
This technique helps you isolate network latencies from other factors impacting query performance.
Query rates
One potential reason for your search service to throttle requests is due to the sheer number of queries being performed where volume is captured as queries per second (QPS) or queries per minute (QPM). As your search service receives more QPS, it will typically take longer and longer to respond to those queries until it can no longer keep up, as which it will send back a throttling 503 HTTP response.
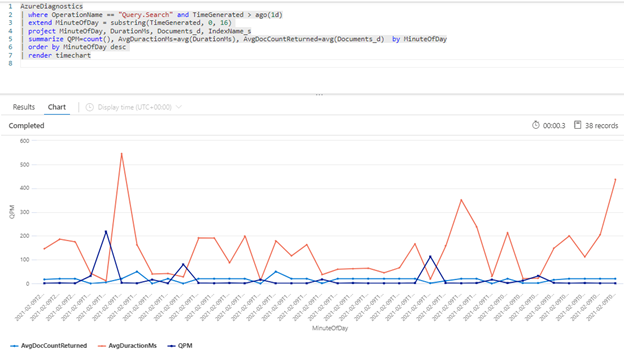
The following Kusto query shows query volume as measured in QPM, along with average duration of a query in milliseconds (AvgDurationMS) and the average number of documents (AvgDocCountReturned) returned in each one.
AzureDiagnostics
| where OperationName == "Query.Search" and TimeGenerated > ago(1d)
| extend MinuteOfDay = substring(TimeGenerated, 0, 16)
| project MinuteOfDay, DurationMs, Documents_d, IndexName_s
| summarize QPM=count(), AvgDuractionMs=avg(DurationMs), AvgDocCountReturned=avg(Documents_d)  by MinuteOfDay
| order by MinuteOfDay desc
| render timechart
Tip
To reveal the data behind this chart, remove the line | render timechart and then rerun the query.
Impact of indexing on queries
An important factor to consider when looking at performance is that indexing uses the same resources as search queries. If you're indexing a large amount of content, you can expect to see latency grow as the service tries to accommodate both workloads.
If queries are slowing down, look at the timing of indexing activity to see if it coincides with query degradation. For example, perhaps an indexer is running a daily or hourly job that correlates with the decreased performance of the search queries.
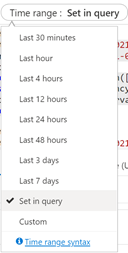
This section provides a set of queries that can help you visualize the search and indexing rates. For these examples, the time range is set in the query. Be sure to indicate Set in query when running the queries in Azure portal.
Average Query Latency
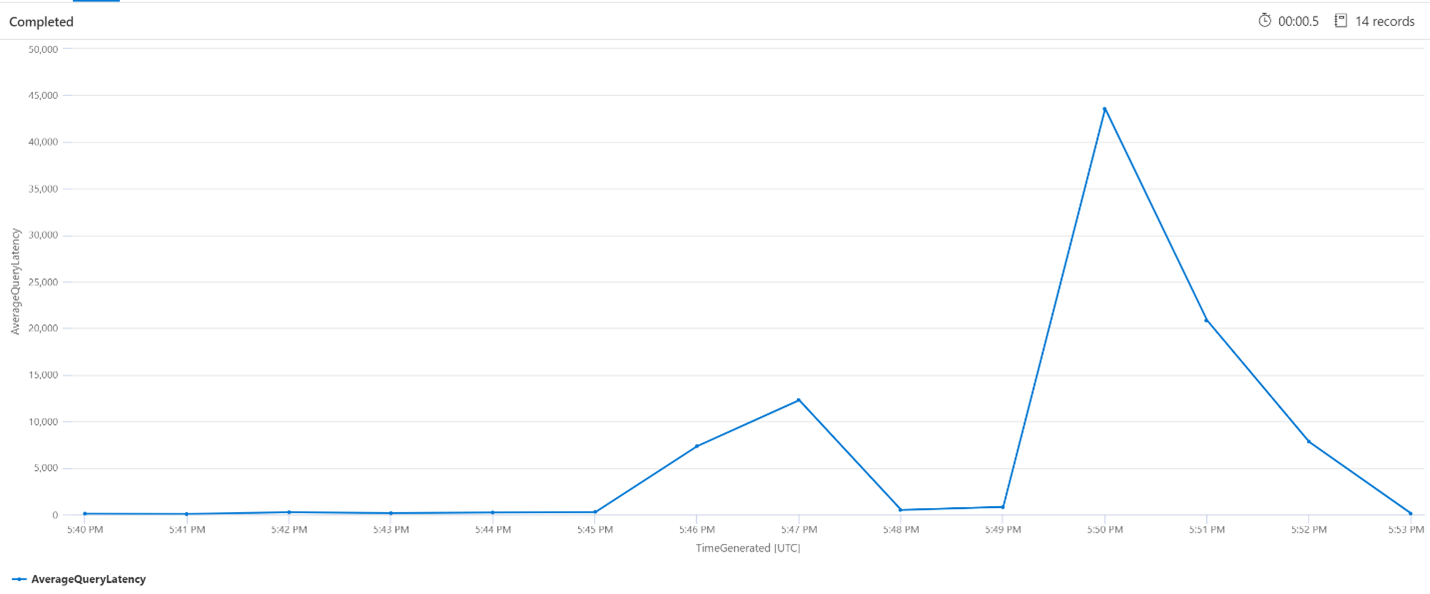
In the below query, an interval size of 1 minute is used to show the average latency of the search queries. From the chart, we can see that the average latency was low until 5:45pm and lasted until 5:53pm.
let intervalsize = 1m;
let _startTime = datetime('2021-02-23 17:40');
let _endTime = datetime('2021-02-23 18:00');
AzureDiagnostics
| where TimeGenerated between(['_startTime']..['_endTime']) // Time range filtering
| summarize AverageQueryLatency = avgif(DurationMs, OperationName in ("Query.Search", "Query.Suggest", "Query.Lookup", "Query.Autocomplete"))
    by bin(TimeGenerated, intervalsize)
| render timechart
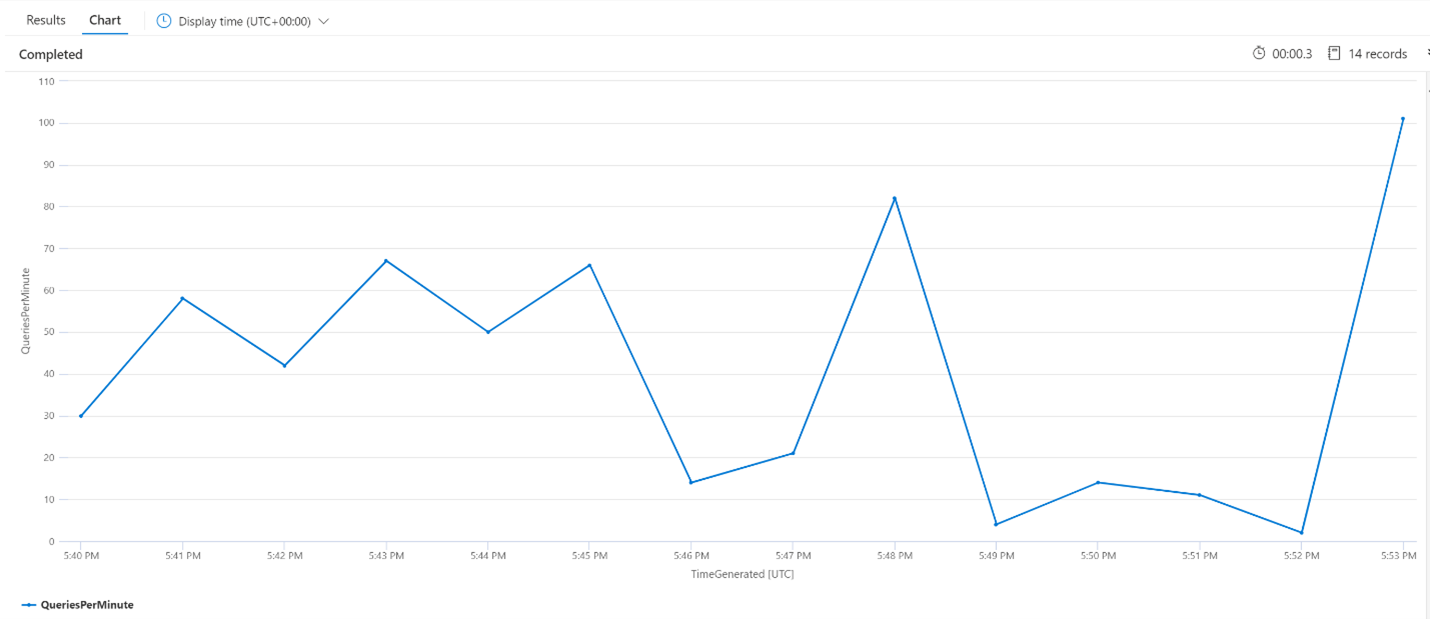
Average Queries Per Minute (QPM)
The following query looks at the average number of queries per minute to ensure that there wasn't a spike in search requests that might have affected the latency. From the chart, we can see there's some variance, but nothing to indicate a spike in request count.
let intervalsize = 1m;
let _startTime = datetime('2021-02-23 17:40');
let _endTime = datetime('2021-02-23 18:00');
AzureDiagnostics
| where TimeGenerated between(['_startTime'] .. ['_endTime']) // Time range filtering
| summarize QueriesPerMinute=bin(countif(OperationName in ("Query.Search", "Query.Suggest", "Query.Lookup", "Query.Autocomplete"))/(intervalsize/1m), 0.01)
  by bin(TimeGenerated, intervalsize)
| render timechart
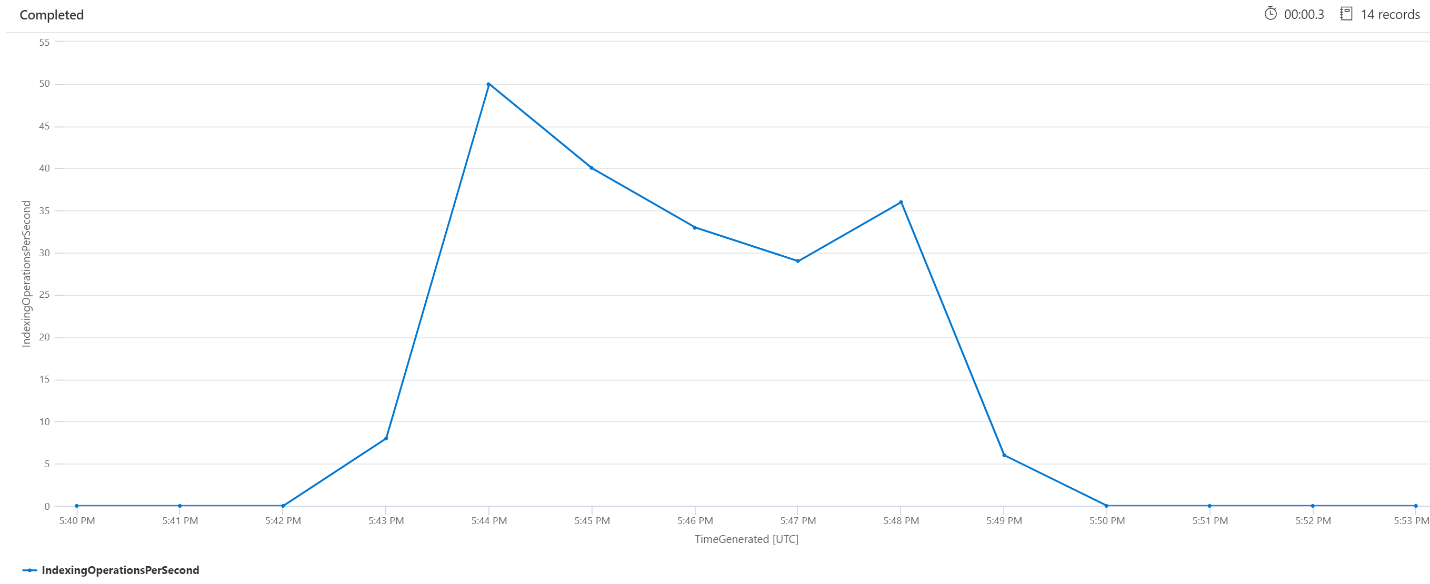
Indexing Operations Per Minute (OPM)
Here we'll look at the number of Indexing operations per minute. From the chart, we can see that a large amount of data was indexed started at 5:42 pm and ended at 5:50pm. This indexing began 3 minutes before the search queries started becoming latent and ended 3 minutes before the search queries were no longer latent.
From this insight, we can see that it took about 3 minutes for the search service to become busy enough for indexing to affect query latency. We can also see that after indexing completed, it took another 3 minutes for the search service to complete all the work from the newly indexed content, and for query latency to resolve.
let intervalsize = 1m;
let _startTime = datetime('2021-02-23 17:40');
let _endTime = datetime('2021-02-23 18:00');
AzureDiagnostics
| where TimeGenerated between(['_startTime'] .. ['_endTime']) // Time range filtering
| summarize IndexingOperationsPerSecond=bin(countif(OperationName == "Indexing.Index")/ (intervalsize/1m), 0.01)
  by bin(TimeGenerated, intervalsize)
| render timechart
Background service processing
It isn't unusual to see periodic spikes in query or indexing latency. Spikes might occur in response to indexing or high query rates, but could also occur during merge operations. Search indexes are stored in chunks - or shards. Periodically, the system merges smaller shards into large shards, which can help optimize service performance. This merge process also cleans up documents that have previously been marked for deletion from the index, resulting in the recovery of storage space.
Merging shards is fast, but also resource intensive and thus has the potential to degrade service performance. If you notice short bursts of query latency, and those bursts coincide with recent changes to indexed content, you can assume the latency is due to shard merge operations.
Next steps
Review these articles related to analyzing service performance.
Feedback
Coming soon: Throughout 2024 we will be phasing out GitHub Issues as the feedback mechanism for content and replacing it with a new feedback system. For more information see: https://aka.ms/ContentUserFeedback.
Submit and view feedback for