Note
Access to this page requires authorization. You can try signing in or changing directories.
Access to this page requires authorization. You can try changing directories.
To ensure that Microsoft Sentinel's threat detection provides complete coverage in your environment, take advantage of its execution management tools. These tools consist of insights on your scheduled analytics rules' execution, based on Microsoft Sentinel's health and audit data, and a facility to manually rerun previous executions of rules on specific time windows, for testing and/or troubleshooting purposes.
Important
Microsoft Sentinel's analytics rule insights and manual rerun are currently in PREVIEW. See the Supplemental Terms of Use for Microsoft Azure Previews for additional legal terms that apply to Azure features that are in beta, preview, or otherwise not yet released into general availability.
Summary
There are two execution management tools for scheduled analytics rules: built-in scheduled rule insights and the capability to rerun scheduled rules on-demand.
On the Analytics page, the Insights panel displays as another tab in the details pane, alongside the Info tab. The Insights panel provides information about a rule's activity and results. For example: failed executions, top health issues, alert count over time, and closing classifications of incidents created by the rule. These insights help your security analysts identify potential issues or misconfigurations with analytics rules, and allow them to discover and fix rule failures and optimize rule configurations for better performance and accuracy.
Also on the Analytics page, you have the ability to rerun analytics rules on-demand. This capability provides flexibility and control in validating the effectiveness of the rules. It can be useful in scenarios such as rule refinement, testing, validation, and others. Having the flexibility to initiate manual reruns can support efficient security operations, enable effective incident response, and enhance the overall detection and response capabilities of the system.
Use cases and benefits of rule rerun
Here are some scenarios that can benefit from replaying specific runs of analytics rules:
Rule refinement and tuning: Analytics rules may require periodic adjustments and fine-tuning based on the evolving threat landscape and changing organizational needs. By manually rerunning rules, your analysts can assess the impact of rule modifications and validate their effectiveness before deploying them in a production environment.
Testing and validation: When introducing new analytics rules, making significant changes to existing ones, or developing new incident playbooks, it is essential to thoroughly test their performance and accuracy. Manual rerunning allows you to simulate different scenarios, including end-to-end automated incident flow, and validate the rules against a consistent set of data inputs. This process ensures that the rules generate the expected alerts without producing excessive false positives.
Incident investigation: In the event of a security incident or suspicious activity, your analysts may want to surface additional details in the alerts already generated. They can do this by updating the rule and rerunning it on specific execution intervals (going back up to seven days) to gather additional information and identify related events. Manual rerunning allows your analysts to perform in-depth investigations and helps ensure comprehensive coverage.
Compliance and auditing: Some regulatory requirements or internal policies may necessitate rerunning analytics rules periodically or on-demand to demonstrate continuous monitoring and compliance. Manual rerunning provides the ability to meet such obligations by ensuring that rules are consistently applied and generate appropriate alerts.
Prerequisites
To use the execution management tools, you must have Microsoft Sentinel's health and audit feature enabled, and specifically the analytics rule health monitoring. Learn how to enable health and audit.
View analytics rule insights
To take advantage of these tools, start by examining the insights on a given rule.
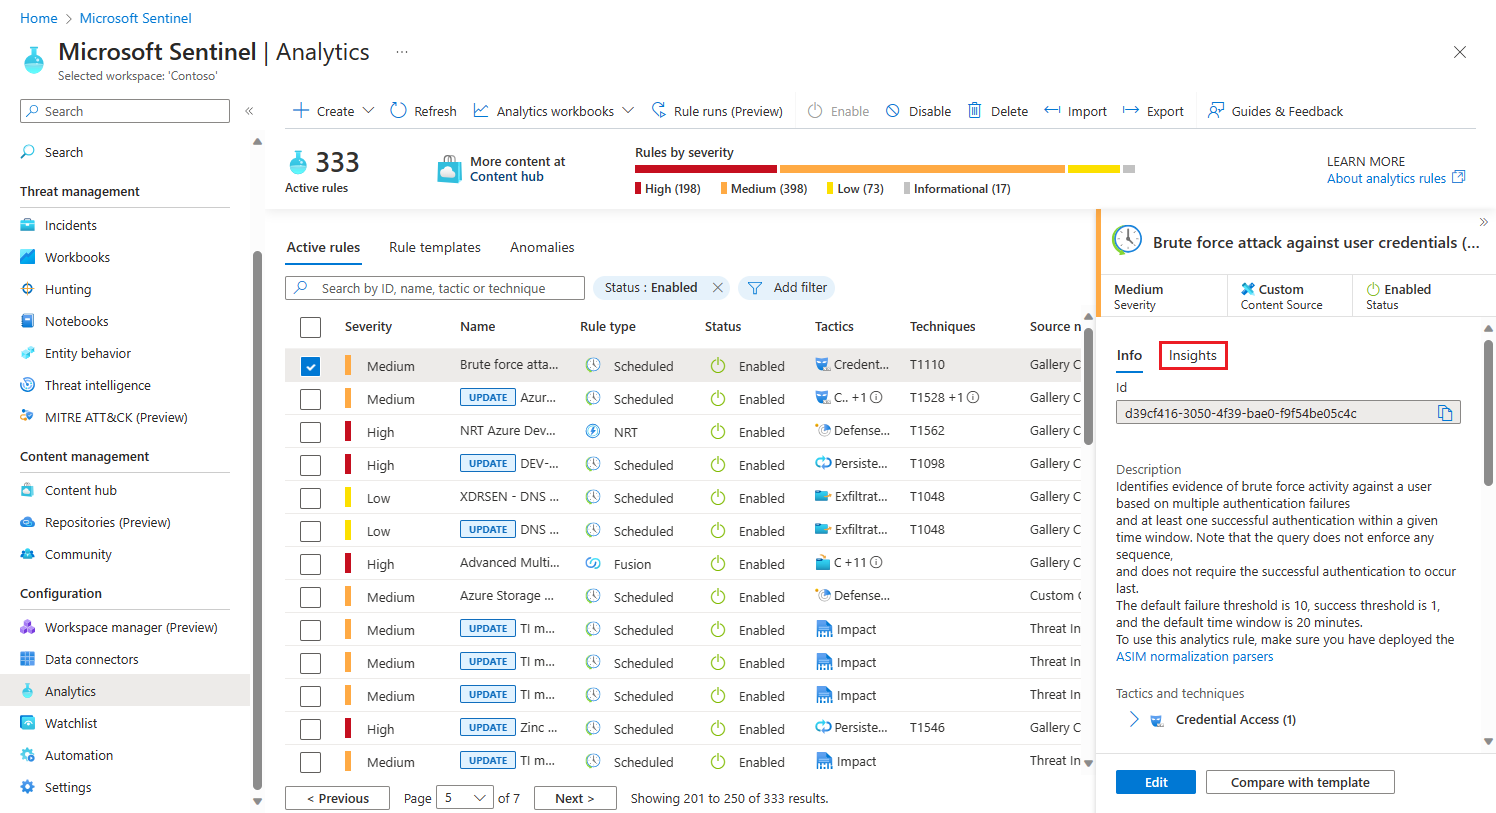
From the Microsoft Sentinel navigation menu, select Analytics.
Find and select a rule (Scheduled or NRT) whose insights you'd like to see.
Select the Insights tab in the details pane.
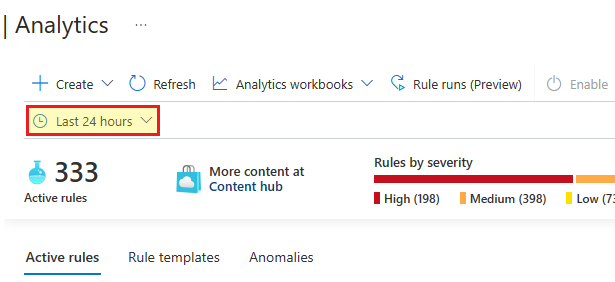
When you select the Insights tab, the time frame selector will appear. Select a time frame, or leave it as the default of the last 24 hours.
The Insights panel currently shows four kinds of insights. Each insight is followed by a View all link that takes you to the Logs page and displays the query that produced the insight along with the full raw results. Here are the insights:
Failed executions displays a list of failed runs of this rule in the given time frame. This insight is also followed by a link to the Rule runs panel, where you can see a list of all the times the rule has run, and you can replay specific runs of the rule.
Top health issues displays a list of the most common health issues for this rule during the given time frame. This insight is also followed by a View runs link that takes you to the Logs page where you'll see a query of all the times this rule has run.
Alert graph shows a chart of the number of alerts generated by this rule in the given time frame.
Incident classification shows a summary of the classification of closed incidents created by this rule during the given time frame.
Rerun analytics rules
There are several scenarios that might lead you to rerun a rule.
A rule failed to run due to a temporary condition that reverted to normal, or due to a misconfiguration. After you correct the misconfiguration or repair the condition, you'll want to then rerun the rule on the same time window (that is, on the same data) as the run that failed, to mitigate the gaps in coverage.
A rule succeeded in running, but didn't provide enough information in the alerts it generated. In this case you might want to edit the rule to provide more information, whether by changing the query or the enrichment settings. You'll want to then rerun the rule on the same time window (that is, on the same data) as the run that you want more information for.
You might be experimenting with writing or editing a rule and want to see how different settings would affect the alerts the rule generates. For a valid comparison, you want to rerun the rule on the same time window.
Here's how to rerun a rule:
From the Analytics page, select Rule runs (Preview) from the toolbar at the top. The Rule runs panel will open.
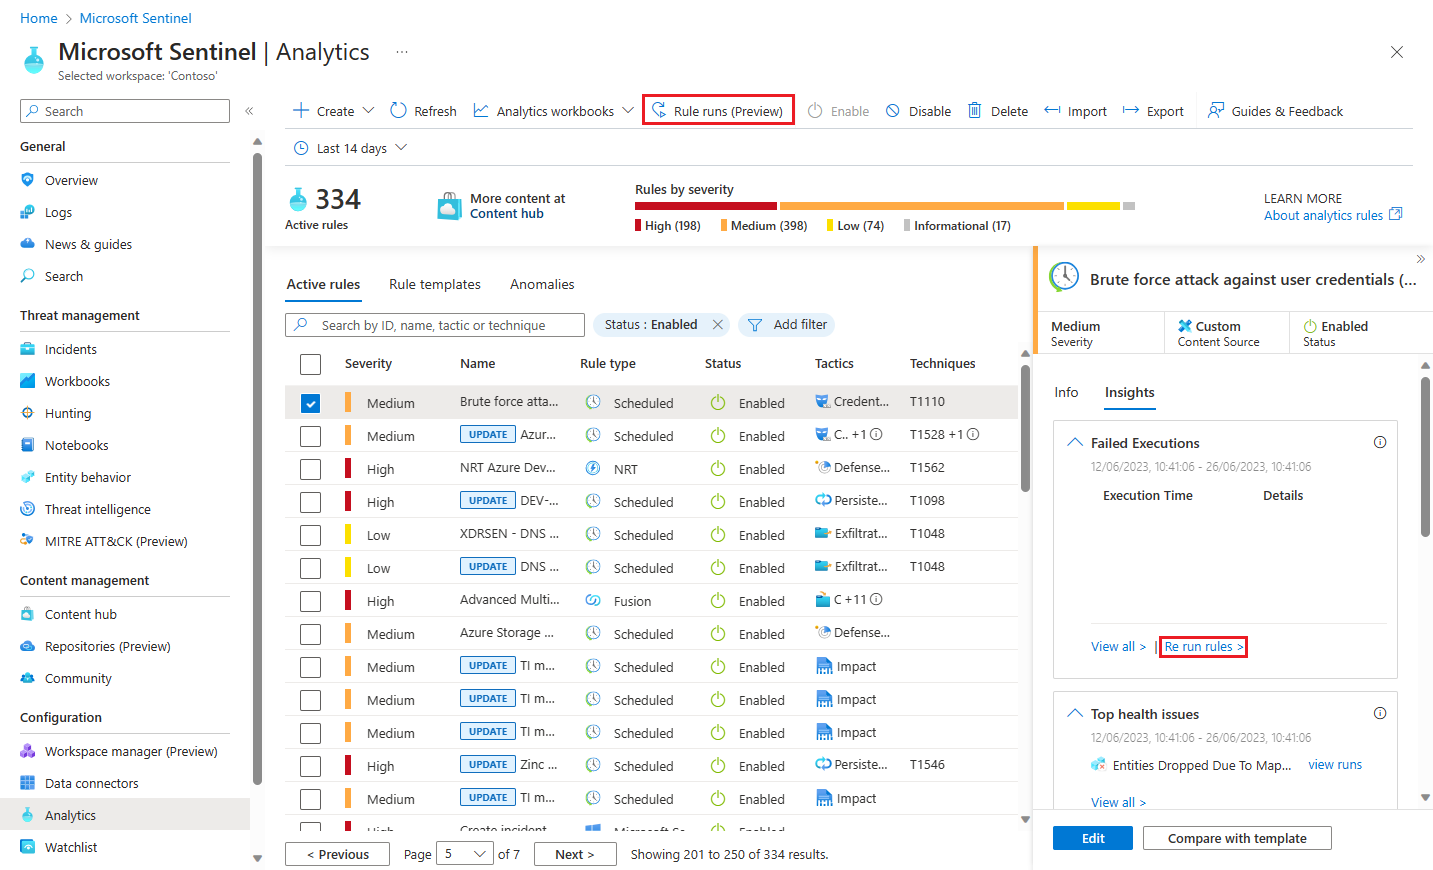
You can also get to the Rule runs panel by selecting Rerun rules from the Failed executions display on the Insights tab (see above).

Select the rule runs you want to replay, according to the time window in which they originally ran, as displayed in the Execution time column. You can choose more than one rule run.
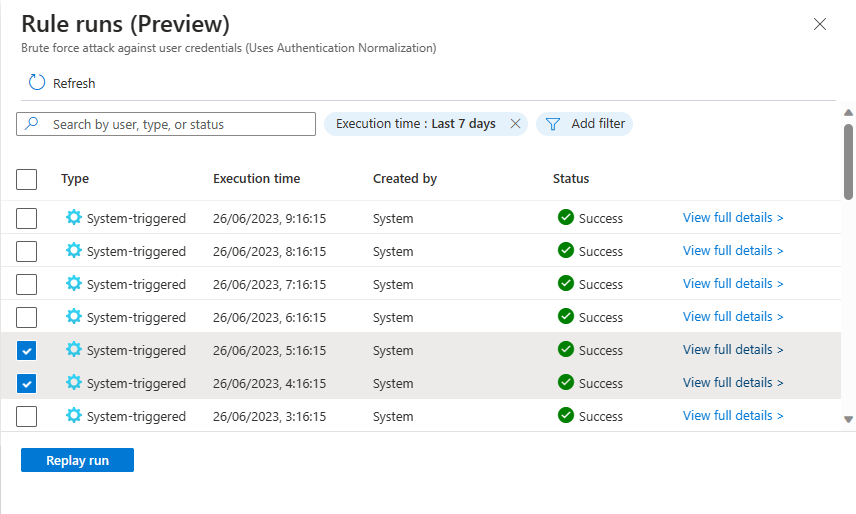
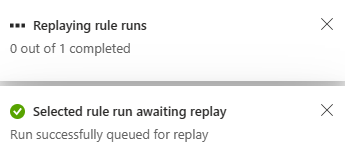
Select Replay run. Notifications will be displayed that show the progress of the requests and that the rules were queued for execution.
Select Refresh to view the updated status of the rule's runs. You'll see that your requests are displayed among them, with a status of In progress (it will eventually show as Success) and a type of User-triggered as opposed to System-triggered.
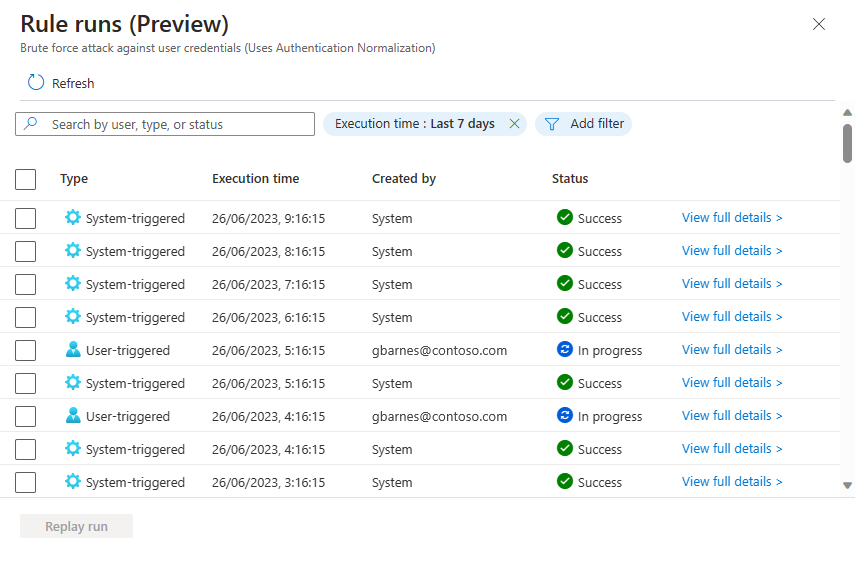
You'll also notice that the execution time of your requested reruns is the same as the original system-triggered run's execution, and not the execution time of your rerun. This is to show you which time window your rerun is referencing.
You can only replay system-triggered rule runs, not user-triggered ones.
Select View full details at the end of the line of any rule run to view its full, raw details in the Logs screen.
Next steps
- Monitor the health and audit the integrity of your analytics rules.
- Learn about auditing and health monitoring in Microsoft Sentinel.
- Turn on auditing and health monitoring in Microsoft Sentinel.
- See more information about the SentinelHealth and SentinelAudit table schemas.