Note
Access to this page requires authorization. You can try signing in or changing directories.
Access to this page requires authorization. You can try changing directories.
To ensure comprehensive, uninterrupted, and tampering-free threat detection in your Microsoft Sentinel service, keep track of your analytics rules' health and integrity. Keep them functioning optimally by monitoring their execution insights, by querying the health and audit logs, and by using manual rerun to test and optimize your rules.
Set up notifications of health and audit events for relevant stakeholders, who can then take action. For example, define and send email or Microsoft Teams messages, create new tickets in your ticketing system, and so on.
This article describes how to use Microsoft Sentinel's auditing and health monitoring features to keep track of your analytics rules' health and integrity from within Microsoft Sentinel.
For information on rule insights and manual rerunning of rules, see Monitor and optimize the execution of your scheduled analytics rules.
Summary
Microsoft Sentinel analytics rule health logs:
- This log captures events that record the running of analytics rules, and the end result of these runnings—if they succeeded or failed, and if they failed, why.
- The log also records, for each running of an analytics rule:
- How many events the rule's query captured.
- Whether the number of events passed the threshold defined in the rule, causing the rule to fire an alert.
These logs are collected in the SentinelHealth table in Log Analytics.
Microsoft Sentinel analytics rule audit logs:
- This log captures events that record changes made to any analytics rule, including the following details:
- The name of the rule that was changed.
- Which properties of the rule were changed.
- The state of the rule settings before and after the change.
- The user or identity that made the change.
- The source IP and date/time of the change.
- ...and more.
These logs are collected in the SentinelAudit table in Log Analytics.
- This log captures events that record changes made to any analytics rule, including the following details:
Use the SentinelHealth and SentinelAudit data tables
To get audit and health data from the tables described earlier, you must first turn on the Microsoft Sentinel health feature for your workspace. For more information, see Turn on auditing and health monitoring for Microsoft Sentinel.
Once the health feature is turned on, the SentinelHealth data table is created at the first success or failure event generated for your automation rules and playbooks.
Understanding SentinelHealth and SentinelAudit table events
The SentinelHealth table logs the following types of analytics rule health events:
- Scheduled analytics rule run.
- NRT analytics rule run.
For more information, see SentinelHealth table columns schema.
The SentinelAudit table logs the following types of analytics rule audit events:
- Create or update analytics rule.
- Analytics rule deleted.
For more information, see SentinelAudit table columns schema.
Run queries to detect health and integrity issues
For best results, build your queries on the prebuilt functions for these tables, _SentinelHealth() and _SentinelAudit(), instead of querying the tables directly. These functions maintain your queries' backward compatibility if changes are made to the schema of the tables.
As a first step, filter the tables for data related to analytics rules. Use the SentinelResourceType parameter.
_SentinelHealth()
| where SentinelResourceType == "Analytics Rule"
If you want, you can further filter the list for a particular kind of analytics rule. Use the SentinelResourceKind parameter for this.
| where SentinelResourceKind == "Scheduled"

# OR

| where SentinelResourceKind == "NRT"
Here are some sample queries to help you get started:
Find rules that are "autodisabled":
_SentinelHealth()
| where SentinelResourceType == "Analytics Rule"
| where Reason == "The analytics rule is disabled and was not executed."
Count the rules and runnings that succeeded or failed, by reason:
_SentinelHealth()
| where SentinelResourceType == "Analytics Rule"
| summarize Occurrence=count(), Unique_rule=dcount(SentinelResourceId) by Status, Reason
Find rule deletion activity:
_SentinelAudit()
| where SentinelResourceType =="Analytic Rule"
| where Description =="Analytics rule deleted"
Find activity on rules, by rule name and activity name:
_SentinelAudit()
| where SentinelResourceType =="Analytic Rule"
| summarize Count= count() by RuleName=SentinelResourceName, Activity=Description
Find activity on rules, by caller name (the identity that performed the activity):
_SentinelAudit()
| where SentinelResourceType =="Analytic Rule"
| extend Caller= tostring(ExtendedProperties.CallerName)
| summarize Count = count() by Caller, Activity=Description
See more information on the following items used in the preceding examples, in the Kusto documentation:
- where operator
- summarize operator
- tostring() function
- count() aggregation function
- dcount() aggregation function
For more information on KQL, see Kusto Query Language (KQL) overview.
Other resources:
Scheduled rules
When a schedule rule fails, it's retried five more times on the exact same window. The rule doesn't skip the window and miss an alert as long as one of the six attempts is successful.
Failure in one of the six attempts indicates a delay in the alert triggering. The following query calculates the exact delay:
_SentinelHealth()
| where SentinelResourceType == @"Analytics Rule"
| where SentinelResourceKind == "Scheduled"
| extend startTime = todatetime(ExtendedProperties["QueryStartTimeUTC"]), executionStart = todatetime(ExtendedProperties["executionStart"])
| extend delay = datetime_diff('minute', startTime, executionStart)
To look for complete failures (that is, a window that was skipped), use the following query:
_SentinelHealth()| where SentinelResourceType == @"Analytics Rule"
| where SentinelResourceKind == "Scheduled"
| where Status != "Success"
| extend startTime = tostring(ExtendedProperties["QueryStartTimeUTC"])
| summarize failuresByStartTime = count() by startTime, SentinelResourceId
| where failuresByStartTime == 6
| summarize count() by SentinelResourceId
This query looks for scheduled analytics rule runs where none of the six retries were successful. You can identify a retry by looking at the start time of the rule’s window since the retries always look at the original start time. This query gives you the amount of skipped windows for each analytic rule. We expect skipped windows to be rare. If you see that you have analytics rules with skipped windows, use the queries to understand the failure reason of these specific rules and the table of failures reasons and mitigations to fix them.
NRT rules
The retry mechanism for NRT rules behaves differently from scheduled rules. If a rule fails to run, the system also considers the failed window in the next run (one minute later). This behavior continues for up to 60 failures (one hour).
Since one failure of a specific run reflects only one-minute delay, don't look at single failures. Instead, use the following query to monitor the delay of each analytic rule:
_SentinelHealth()
| where SentinelResourceKind == "NRT"
| extend startTime = todatetime(ExtendedProperties["QueryStartTimeUTC"]), endTime = todatetime(ExtendedProperties["QueryEndTimeUTC"]), alertsCreated = toint(ExtendedProperties["AlertsGeneratedAmount"])
| where alertsCreated == 0
| extend ruleDelay = datetime_diff('minute', endTime, startTime)
| project TimeGenerated, ruleDelay, SentinelResourceId
| render timechart
You can also define an analytics rule to trigger alerts on significant delays (for example, if an NRT rule has a delay of more than 10 minutes).
Statuses, errors, and suggested steps
For either Scheduled analytics rule run or NRT analytics rule run, you might see any of the following statuses and descriptions:
Success: Rule executed successfully, generating
<n>alerts.Success: Rule executed successfully, but didn't reach the threshold (
<n>) required to generate an alert.Failure: These descriptions explain rule failure and what you can do about them.
Description Remediation An internal server error occurred while running the query. The query execution timed out. A table referenced in the query wasn't found. Verify that the relevant data source is connected. A semantic error occurred while running the query. Try resetting the analytics rule by editing and saving it (without changing any settings). A function called by the query is named with a reserved word. Remove or rename the function. A syntax error occurred while running the query. Try resetting the analytics rule by editing and saving it (without changing any settings). The workspace doesn't exist. This query uses too many system resources and was prevented from running. Review and tune the analytics rule. Consult our Kusto Query Language overview and best practices documentation. A function called by the query wasn't found. Verify the existence in your workspace of all functions called by the query. The workspace used in the query wasn't found. Verify that all workspaces in the query exist. You don't have permissions to run this query. Try resetting the analytics rule by editing and saving it (without changing any settings). You don't have access permissions to one or more of the resources in the query. The query referred to a storage path that wasn't found. The query was denied access to a storage path. Multiple functions with the same name are defined in this workspace. Remove or rename the redundant function and reset the rule by editing and saving it. This query didn't return any result. Multiple result sets in this query aren't allowed. Query results contain inconsistent number of fields per row. The rule's running was delayed due to long data ingestion times. The rule's running was delayed due to temporary issues. The alert wasn't enriched due to temporary issues. The alert wasn't enriched due to entity mapping issues. <number> entities were dropped in alert <name> due to the 32 KB alert size limit. <number> entities were dropped in alert <name> due to entity mapping issues. The query resulted in <number> events, which exceeds the maximum of <limit> results allowed for <rule type> rules with alert-per-row event-grouping configuration. Alert-per-row was generated for first <limit-1> events and an additional aggregated alert was generated to account for all events.
- <number> = number of events returned by the query
- <limit> = currently 150 alerts for scheduled rules, 30 for NRT rules
- <rule type> = Scheduled or NRT
Use the auditing and health monitoring workbook
To make the workbook available in your workspace, install the workbook solution from the Microsoft Sentinel content hub:
From the Microsoft Sentinel portal, select Content hub (Preview) from the Content management menu.
In the Content hub, enter health in the search bar, and select Analytics Health & Audit from among the Workbook solutions under Standalone in the results.
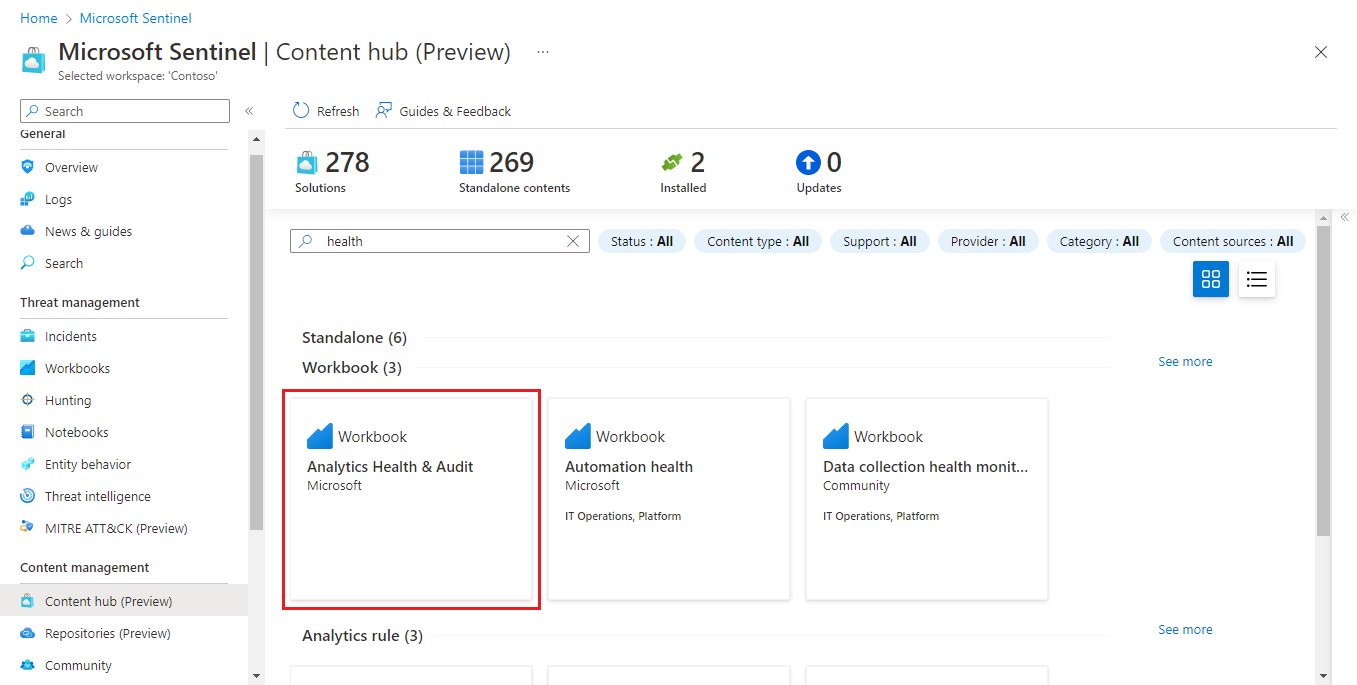
Select Install from the details pane, then select Save that appears in its place.
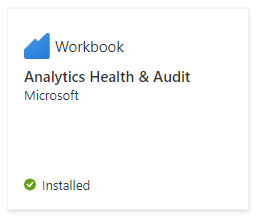
When the solution indicates it's installed, select Workbooks from the Threat management menu.
In the Workbooks gallery, select the Templates tab, enter health in the search bar, and select Analytics Health & Audit from among the results.
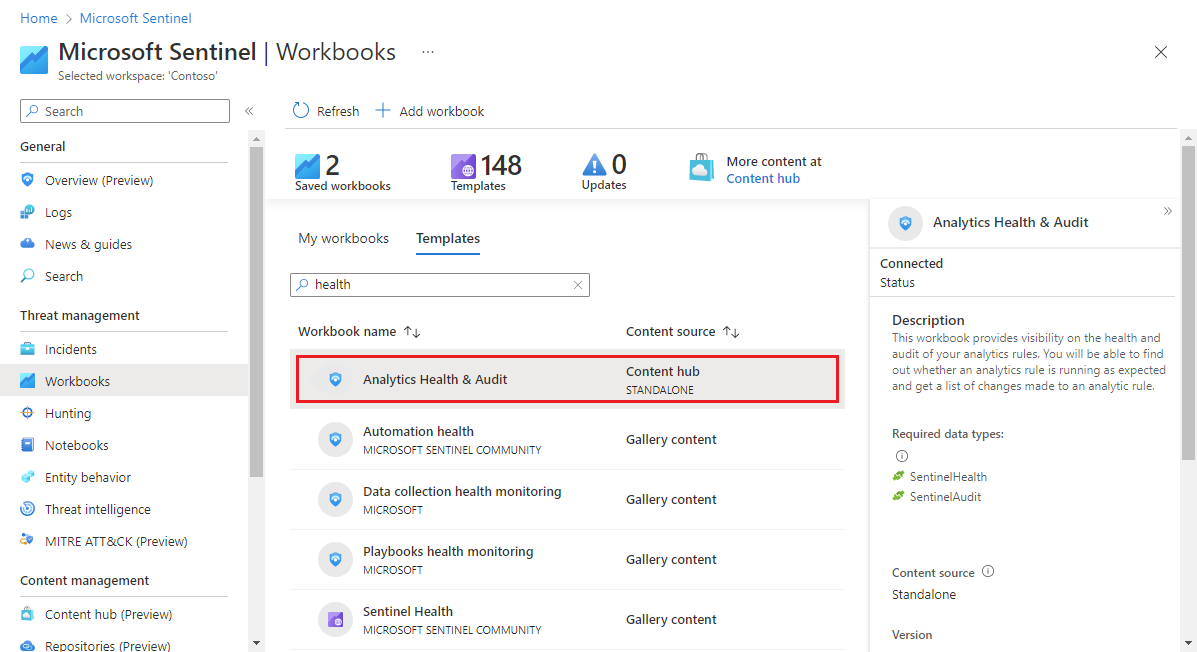
Select Save in the details pane to create an editable and usable copy of the workbook. When the copy is created, select View saved workbook.
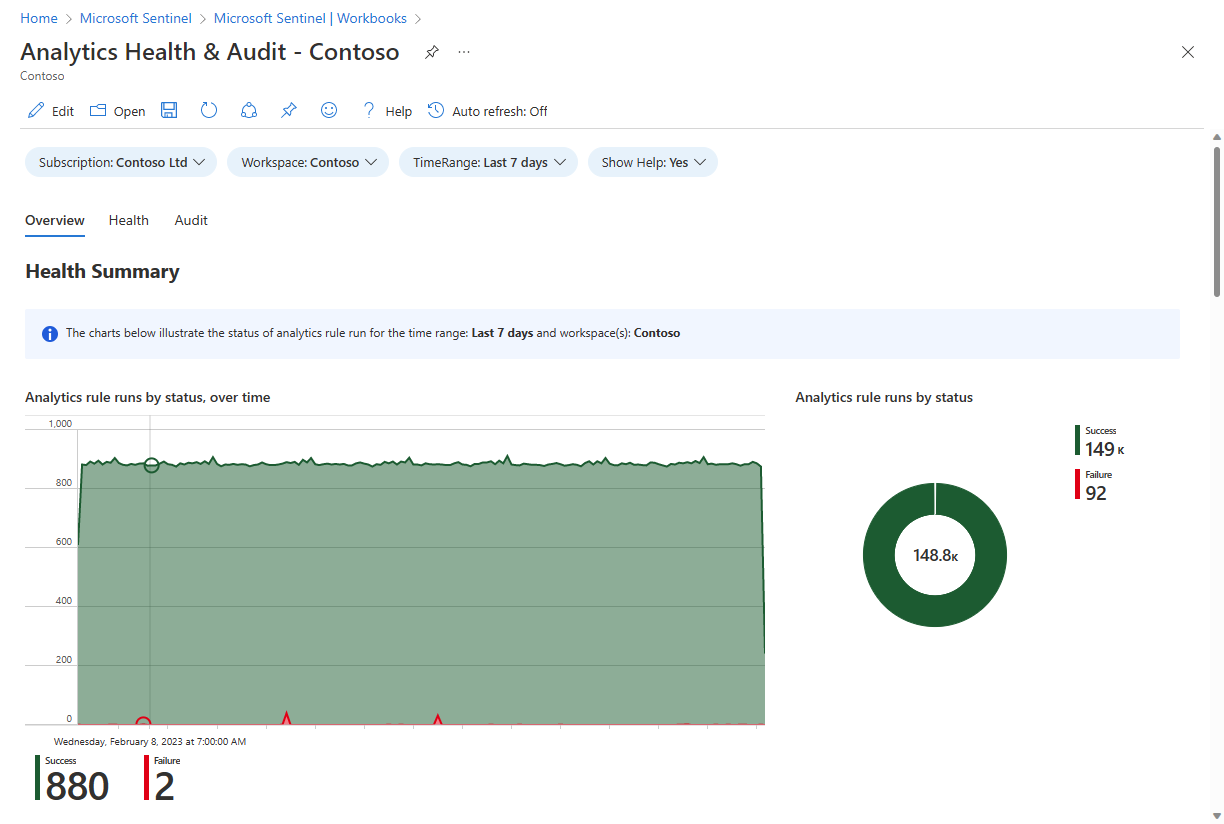
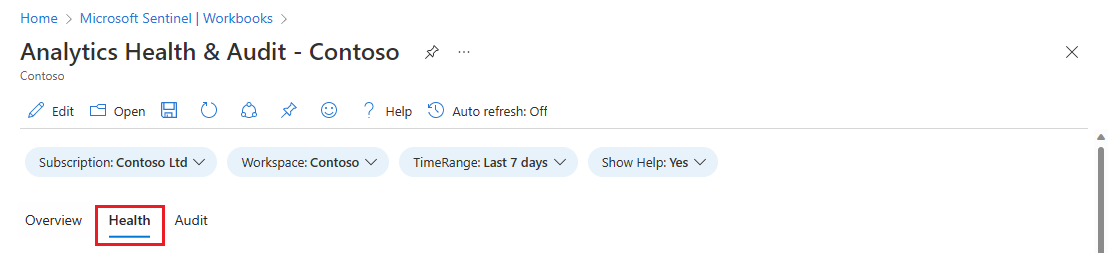
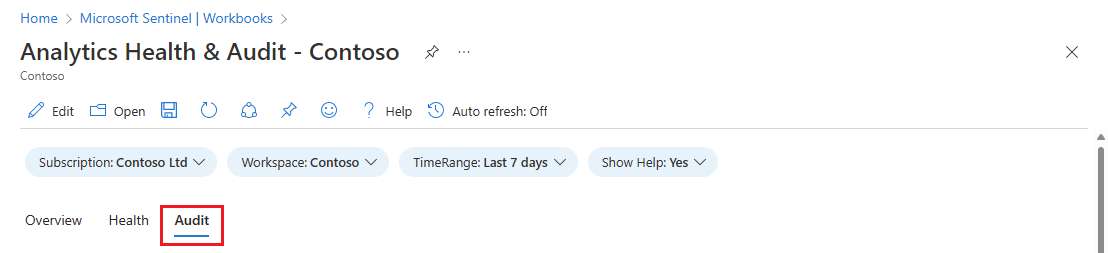
Once in the workbook, first select the subscription and workspace you want to view (they might already be selected), then define the TimeRange to filter the data according to your needs. Use the Show help toggle to display in-place explanation of the workbook.
This workbook has three tabbed sections:
Overview tab
The Overview tab shows health and audit summaries:
- Health summaries of the status of analytics rule runs in the selected workspace: number of runs, successes and failures, and failure event details.
- Audit summaries of activities on analytics rules in the selected workspace: number of activities over time, number of activities by type, and number of activities of different types by rule.
Health tab
The Health tab lets you explore specific health events.
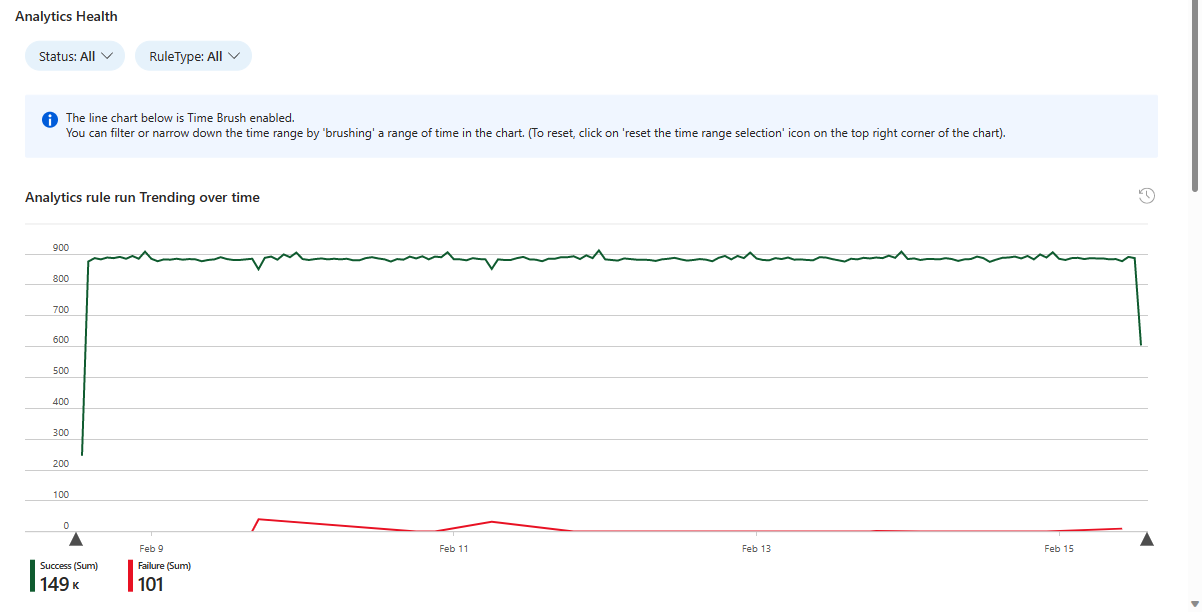
- Filter the whole page data by status (success or failure) and rule type (scheduled or NRT).
- See the trends of successful and failed rule runs (depending on the status filter) over the selected time period. You can "time brush" the trend graph to see a subset of the original time range.
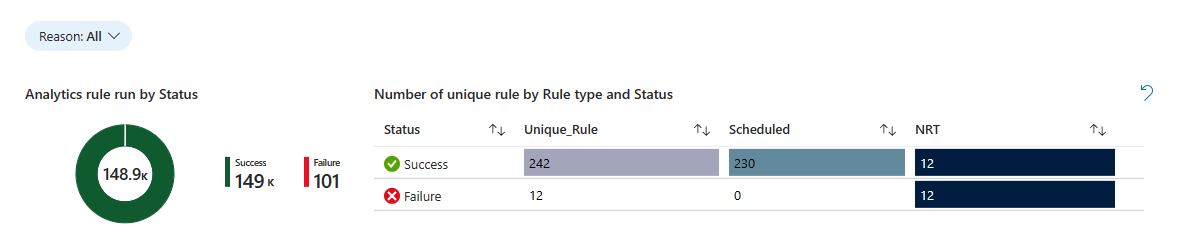
- Filter the rest of the page by reason.
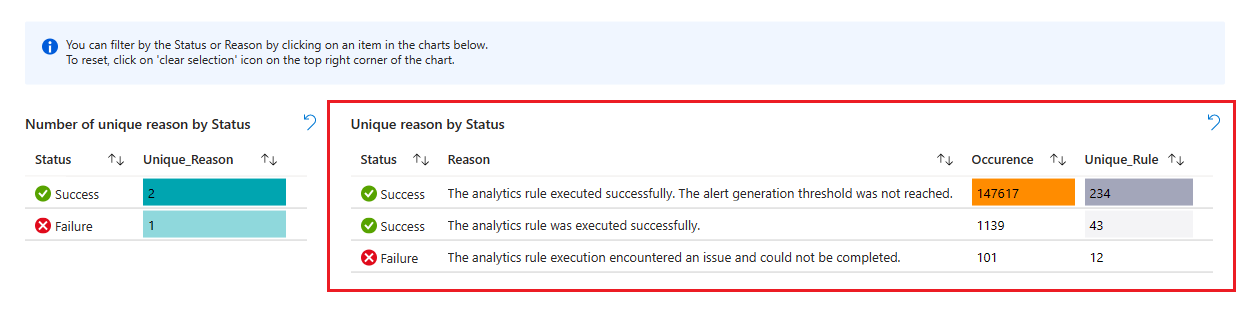
- See the total number of runs for all the analytics rules, displayed proportionally by status in a pie chart.
- Following that is a table showing the number of unique analytics rules that ran, broken down by rule type and status.
- Select a status to filter the remaining charts for that status.
- Clear the filter by selecting the "Clear selection" icon (it looks like an "Undo" icon) in the upper right corner of the chart.
- See each status, with the number of possible reasons for that status. (Only reasons represented in the runs in the selected time frame are shown.)
- Select a status to filter the remaining charts for that status.
- Clear the filter by selecting the "Clear selection" icon (it looks like an "Undo" icon) in the upper right corner of the chart.
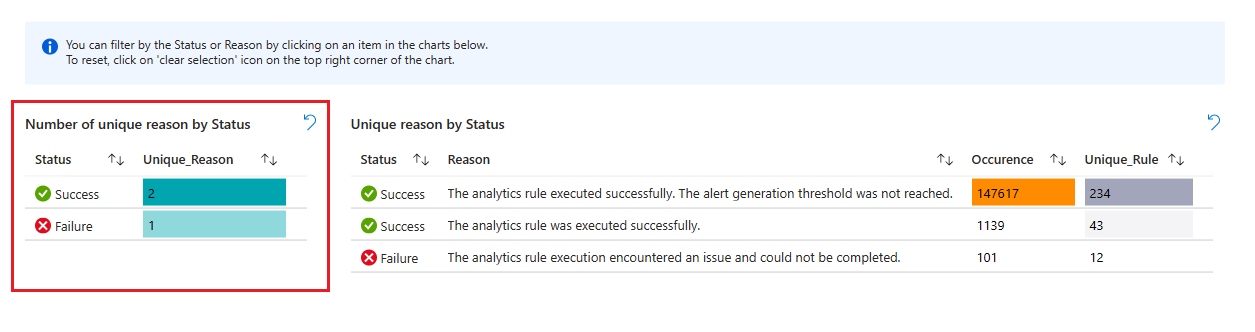
- Next, see a list of those reasons, with the number of total rule runs combined and the number of unique rules that were run.
- Select a reason to filter the following charts for that reason.
- Clear the filter by selecting the "Clear selection" icon (it looks like an "Undo" icon) in the upper right corner of the chart.
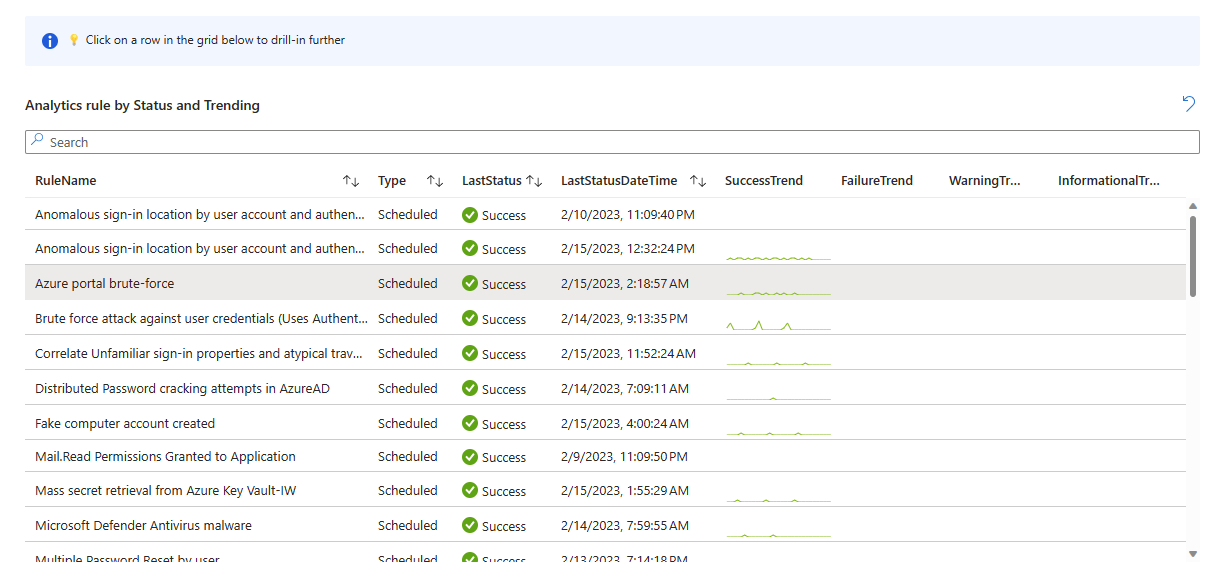
- After that is a list of the unique analytics rules that ran, with the latest results and trendlines of their success and failure (depending on the status selected to filter the list).
- Select a rule to drill down and show a new table with all the runnings of that rule (in the selected time frame).
- Clear that table by selecting the "Clear selection" icon (it looks like an "Undo" icon) in the upper right corner of the chart.
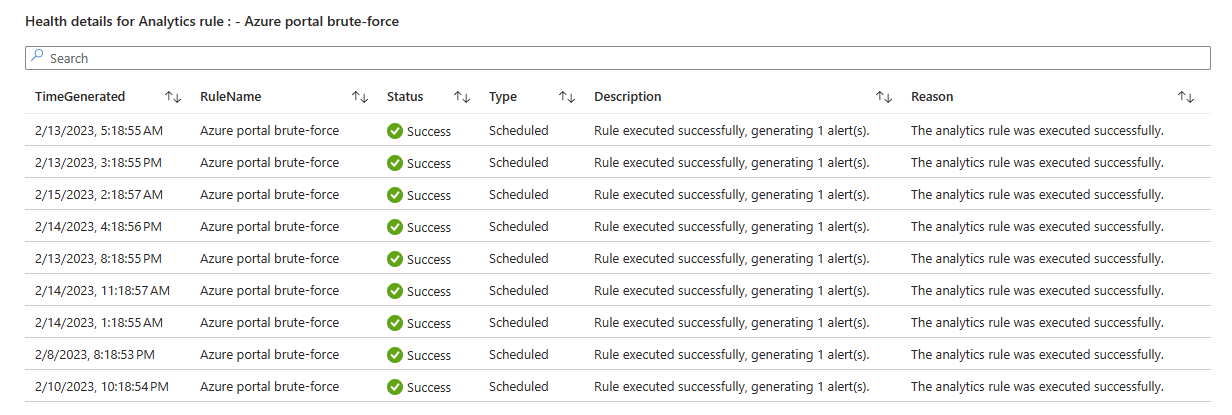
- If you select a rule in the list, a new table appears with the health details for the selected rule.
Audit tab
The Audit tab lets you drill down to particular audit events.
- Filter the whole page data by audit rule type (scheduled/Fusion).
- See the trends of audited activity on analytics rules over the selected time period. You can "time brush" the trend graph to see a subset of the original time range.
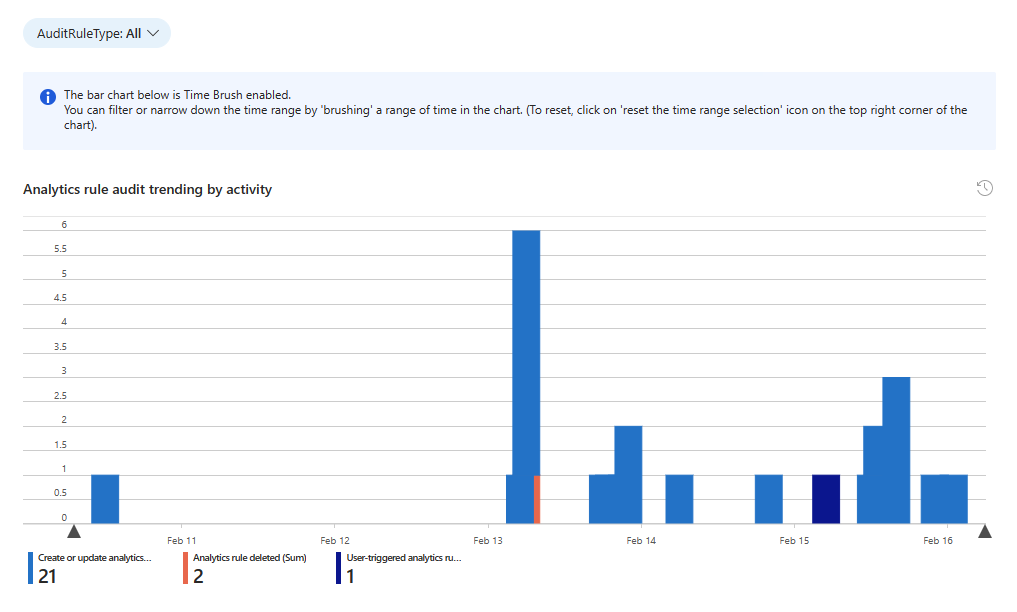
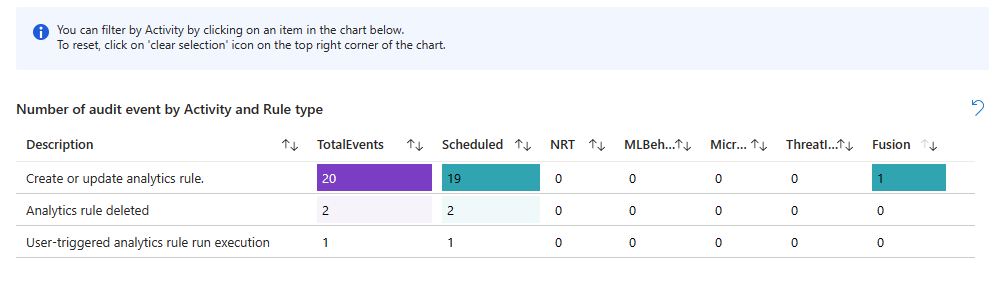
- See the numbers of audited events, broken down by activity and rule type.
- Select an activity to filter the following charts for that activity.
- Clear the filter by selecting the "Clear selection" icon (it looks like an "Undo" icon) in the upper right corner of the chart.
- See the number of audited events by rule name.
- Select a rule name to filter the following table for that rule, and to drill down and show a new table with all the activity on that rule (in the selected time frame). (See after the following screenshot.)
- Clear the filter by selecting the "Clear selection" icon (it looks like an "Undo" icon) in the upper right corner of the chart.
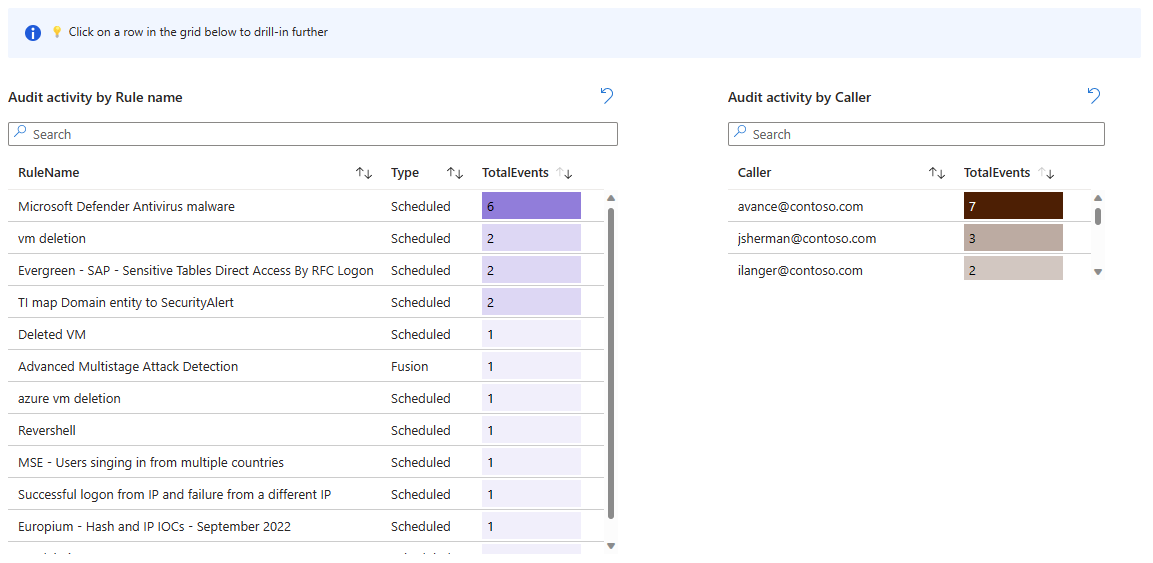
- See the number of audited events by caller (the identity that performed the activity).
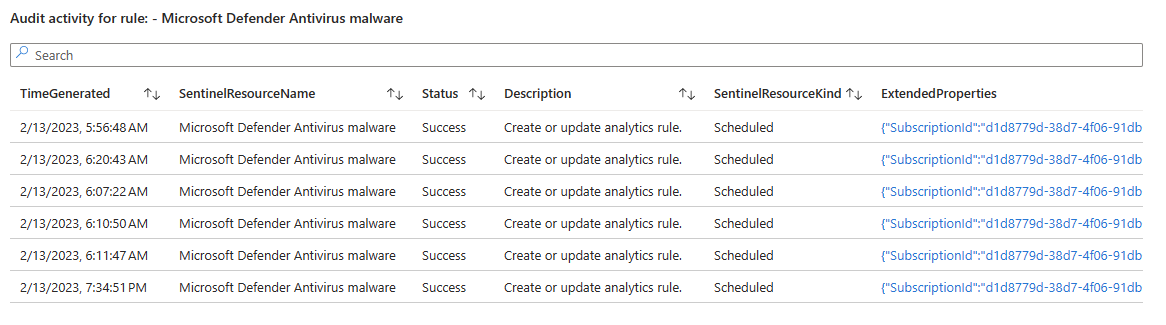
- If you selected a rule name in the preceding chart, another table appears showing the audited activities on that rule. Select the value that appears as a link in the ExtendedProperties column to open a side panel displaying the changes made to the rule.
Next steps
- Monitor and optimize analytics rule execution in Microsoft Sentinel.
- Learn about auditing and health monitoring in Microsoft Sentinel.
- Turn on auditing and health monitoring in Microsoft Sentinel.
- Monitor the health of your automation rules and playbooks.
- Monitor the health of your data connectors.
- See more information about the SentinelHealth and SentinelAudit table schemas.