Monitor the health and role of your SAP systems
After you deploy the SAP solution, you want to ensure proper functioning and performance of your SAP systems, and keep track of your system health, connectivity, and performance. This article describes how to use the following features, which allow you to perform this monitoring from within Microsoft Sentinel:
- Use the SAP data connector page. Review the System Health area under the Microsoft Sentinel for SAP connector to get information on the health of your connected SAP systems.
- Use the Data collection health check alert rule. Get proactive alerts on the health of the SAP agent's data collection.
Important
Monitoring the health of your SAP systems is currently in PREVIEW. The Azure Preview Supplemental Terms include additional legal terms that apply to Azure features that are in beta, preview, or otherwise not yet released into general availability.
Use the SAP data connector
From the Microsoft Sentinel portal, select Data connectors.
In the search bar, type Microsoft Sentinel for SAP.
Select the Microsoft Sentinel for SAP connector and select Open connector page.
In the Configuration > Configure an SAP system and assign it to a collector agent area, view details about the health of your SAP systems. For example:
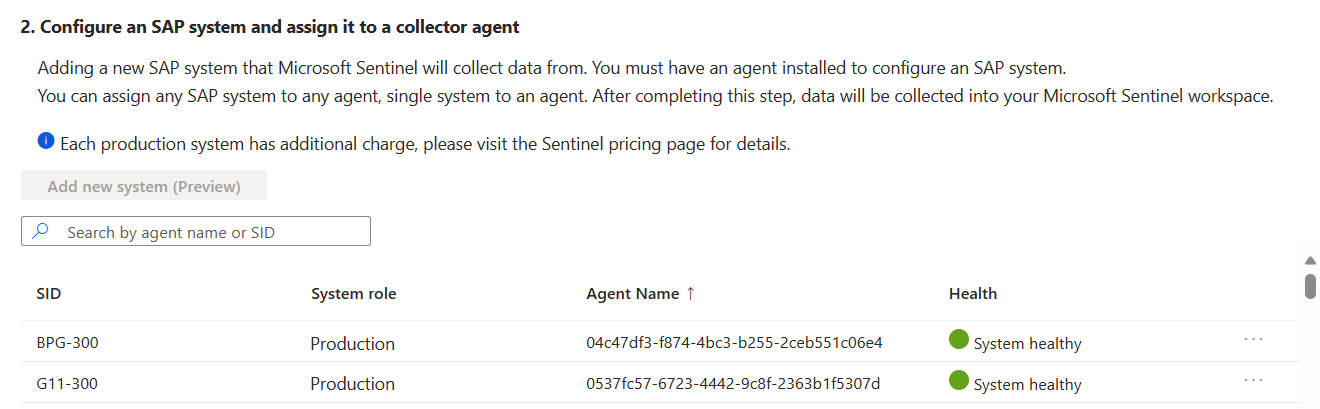

For more information, see Deploy and configure the container hosting the SAP data connector agent.
System health status and details
The following table describes the different fields in the Configure an SAP system and assign it to a collector agent area.
| Field | Description | Values | Notes |
|---|---|---|---|
| SID | The name of the connected SAP system ID (SID). | ||
| System role | Indicates whether the system is productive or not. The data connector agent retrieves the value by reading the SAP T000 table. This value also impacts billing. To change the role, an SAP admin needs to change the configuration in the SAP system. | • Production. The system is defined by the SAP admin as a production system. • Unknown (Production). Microsoft Sentinel couldn't retrieve the system status. Microsoft Sentinel regards this type of system as a production system for both security and billing purposes. • Non production. Indicates roles like developing, testing, and customizing. • Agent update available. Displayed in addition to the health status to indicate that a newer SAP connector version exists. In this case, we recommended that you update the connector. |
If the system role is Production (unknown), check the Microsoft Sentinel role definitions and permissions on the SAP system, and validate that the system allows Microsoft Sentinel to read the content of the T000 table. Next, consider updating the SAP connector to the latest version. |
| Agent name | Unique ID of the installed data connector agent. | ||
| Health | Indicates whether the SID is healthy. To troubleshoot health issues, review the container execution logs and review other troubleshooting steps. | • System healthy (green icon): Indicates that Microsoft Sentinel identified both logs and a heartbeat from the system. • System Connected – unauthorized to collect role, production assumed (yellow icon): Microsoft Sentinel doesn't have sufficient permissions to define whether the system is a production system. In this case, Microsoft Sentinel defines the system as a production system. To allow Microsoft Sentinel to receive the system status, review the Notes column. • Connected with errors (yellow icon): Microsoft Sentinel detected errors when fetching the system role. In this case, Microsoft Sentinel received data regarding whether the system is or isn't a production system. • System not connected: Microsoft Sentinel was unable to connect to the SAP system, and cannot fetch the system role. In this case, Microsoft Sentinel received data regarding whether the system is or isn't a production system. Other statuses, like System unreachable for over 1 day, indicate the connectivity status. |
If the system health status is System Connected – unauthorized to collect role, production assumed, check the Microsoft Sentinel role definitions and permissions on the SAP system, and validate that the system allows Microsoft Sentinel to read the content of the T000 table. Next, consider updating the SAP connector to the latest version. |
Use an alert rule template
The Microsoft Sentinel for SAP solution includes an alert rule template designed to give you insight into the health of your SAP agent's data collection. To turn on the analytics rule:
- From the Microsoft Sentinel portal, select Analytics.
- Under Rule templates, locate the SAP - Data collection health check alert rule.
The analytics rule:
- Evaluates signals sent from the agent.
- Evaluates telemetry data.
- Evaluates alerts on log continuation and other system connectivity issues, if any are found.
- Learns the log ingestion history, and therefore works better with time.
The rule needs at least seven days of loading history to detect the different seasonality patterns. We recommend a value of 14 days for the alert rule Look back parameter to allow detection of weekly activity profiles.
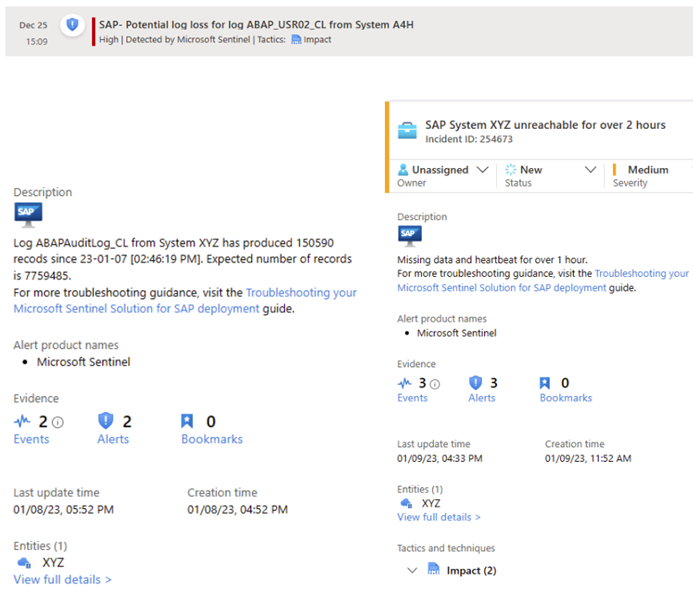
Once activated, the rule judges the recent telemetry and log volume observed on the workspace according to the history learned. The rule then alerts on potential issues, dynamically assigning severities according to the scope of the problem.
This screenshot shows an example of an alert generated by the SAP - Data collection health check alert rule.
Next steps
- Learn about the Microsoft Sentinel Solution for SAP.
- Learn how to deploy the Microsoft Sentinel Solution for SAP
- Learn about auditing and health monitoring in other areas of Microsoft Sentinel.
Feedback
Coming soon: Throughout 2024 we will be phasing out GitHub Issues as the feedback mechanism for content and replacing it with a new feedback system. For more information see: https://aka.ms/ContentUserFeedback.
Submit and view feedback for