Note
Access to this page requires authorization. You can try signing in or changing directories.
Access to this page requires authorization. You can try changing directories.
Use summary rules in Microsoft Sentinel to aggregate large sets of data in the background for a smoother security operations experience across all log tiers. Summary data is precompiled in custom log tables and provide fast query performance, including queries run on data derived from low-cost log tiers. Summary rules can help optimize your data for:
- Analysis and reports, especially over large data sets and time ranges, as required for security and incident analysis, month-over-month or annual business reports, and so on.
- Cost savings on verbose logs, which you can retain for as little or as long as you need in a less expensive log tier, and send as summarized data only to an Analytics table for analysis and reports.
- Security and data privacy, by removing or obfuscating privacy details in summarized shareable data and limiting access to tables with raw data.
Microsoft Sentinel stores summary rule results in custom tables with the Analytics data plan. For more information on data plans and storage costs, see Log table plans.
This article explains how to create summary rules or deploy pre-built summary rule templates in Microsoft Sentinel, and provides examples of common scenarios for using summary rules.
Important
After March 31, 2027, Microsoft Sentinel will no longer be supported in the Azure portal and will be available only in the Microsoft Defender portal. All customers using Microsoft Sentinel in the Azure portal will be redirected to the Defender portal and will use Microsoft Sentinel in the Defender portal only. Starting in July 2025, many new customers are automatically onboarded and redirected to the Defender portal.
If you're still using Microsoft Sentinel in the Azure portal, we recommend that you start planning your transition to the Defender portal to ensure a smooth transition and take full advantage of the unified security operations experience offered by Microsoft Defender. For more information, see It’s Time to Move: Retiring Microsoft Sentinel’s Azure portal for greater security.
Prerequisites
To create summary rules in Microsoft Sentinel:
Microsoft Sentinel must be enabled in at least one workspace, and actively consume logs.
You must be able to access Microsoft Sentinel with Microsoft Sentinel Contributor permissions. For more information, see Roles and permissions in Microsoft Sentinel.
To create summary rules in the Microsoft Defender portal, you must first onboard your workspace to the Defender portal. For more information, see Connect Microsoft Sentinel to the Microsoft Defender portal.
We recommend that you experiment with your summary rule query in the Logs page before creating your rule. Verify that the query doesn't reach or near the query limit, and check that the query produces the intended schema and expected results. If the query is close to the query limits, consider using a smaller binSize to process less data per bin. You can also modify the query to return fewer records or remove fields with higher volume.
Create a new summary rule
Create a new summary rule to aggregate a specific large set of data into a dynamic table. Configure your rule frequency to determine how often your aggregated data set is updated from the raw data.
Open the Summary rule wizard:
In the Defender portal, select Microsoft Sentinel > Configuration > Summary rules.
In the Azure portal, from the Microsoft Sentinel navigation menu, under Configuration, select Summary rules. For example:

Select + Create and enter the following details:
Name. Enter a meaningful name for your rule.
Description. Enter an optional description.
Destination table. Define the custom log table where your data is aggregated:
If you select Existing custom log table, select the table you want to use.
If you select New custom log table, enter a meaningful name for your table. Your full table name uses the following syntax:
<tableName>_CL.
We recommend that you enable SummaryLogs diagnostic settings on your workspace to get visibility for historical runes and failures. If SummaryLogs diagnostic settings aren't enabled, you're prompted to enable them in the Diagnostic settings area.
If SummaryLogs diagnostic settings are already enabled, but you want to modify the settings, select Configure advanced diagnostic settings. When you come back to the Summary rule wizard page, make sure to select Refresh to refresh your setting details.
Important
The SummaryLogs diagnostic setting has additional costs. For more information, see Diagnostic settings in Azure Monitor.
Select Next: Set summary logic > to continue.
On the Set summary logic page, enter your summary query. For example, to summarize data from Google Cloud Platform, you might want to enter:
GCPAuditLogs
| where ServiceName == 'pubsub.googleapis.com'
| summarize count() by Severity
For for more information, see Sample summary rule scenarios and Kusto Query Language (KQL) in Azure Monitor.
Select Preview results to show an example of the data you'd collect with the configured query.
In the Query scheduling area, define the following details:
- How often you want the rule to run
- Whether you want the rule to run with any sort of delay, in minutes
- When you want the rule to start running
Times defined in the scheduling are based on the
timegeneratedcolumn in your dataSelect Next: Review + create > > Save to complete the summary rule.

Existing summary rules are listed on the Summary rules page, where you can review your rule status. For each rule, select the options menu at the end of the row to take any of the following actions:
- View the rule's current data in the Logs page, as if you were to run the query immediately
- View the run history for the selected rule
- Disable or enable the rule.
- Edit the rule configuration
To delete a rule, select the rule row and then select Delete in the toolbar at the top of the page.
Note
Azure Monitor also supports creating summary rules via API or an Azure Resource Monitor (ARM) template. For more information, see Create or update a summary rule.
Deploy pre-built summary rule templates
Summary rule templates are pre-built summary rules that you can deploy as-is or customize to your needs.
To deploy a summary rule template:
Open the Content hub and filter Content type by Summary rules to view the available summary rule templates.
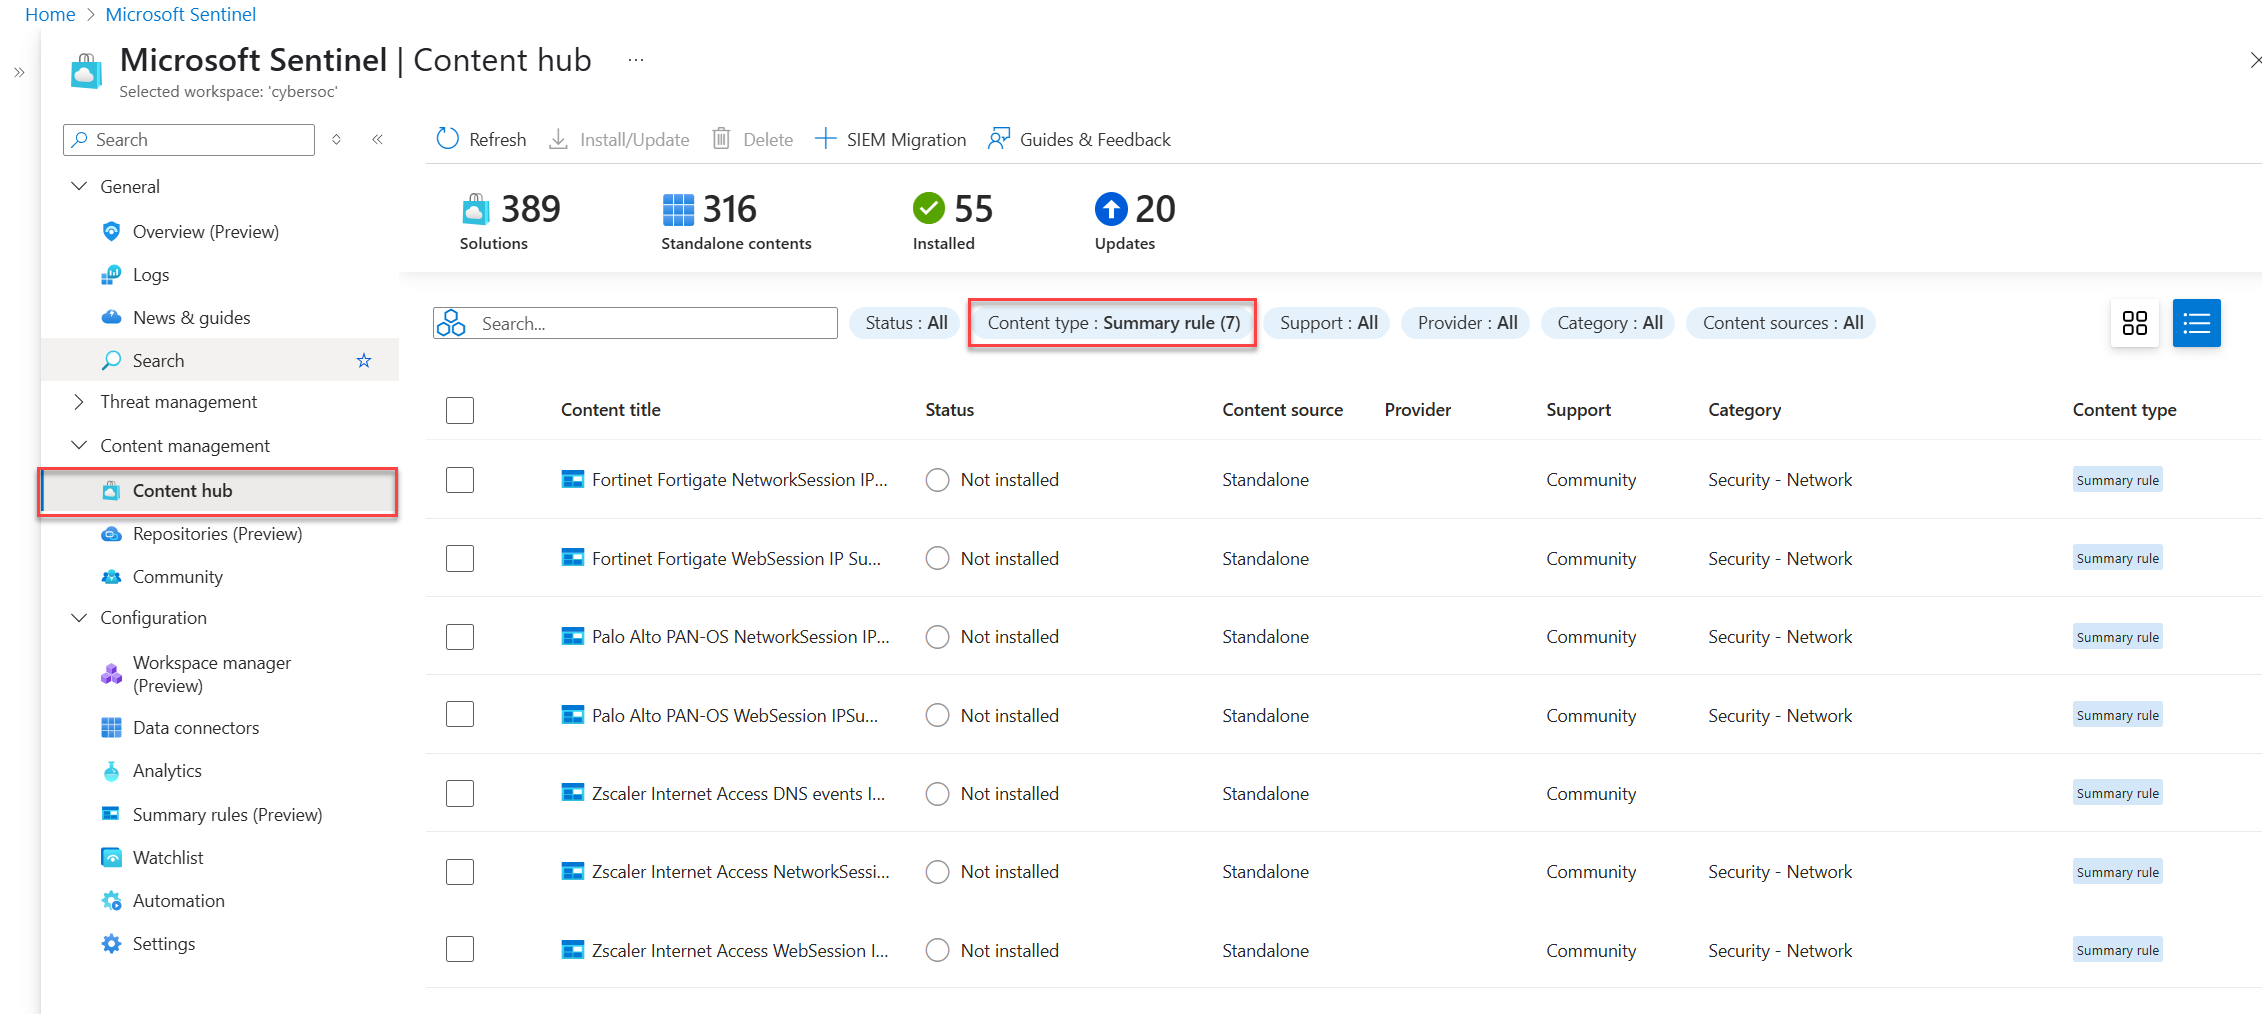
Select a summary rule template.
A panel with information about the summary rule template opens, displaying fields such as description, summary query, and destination table.
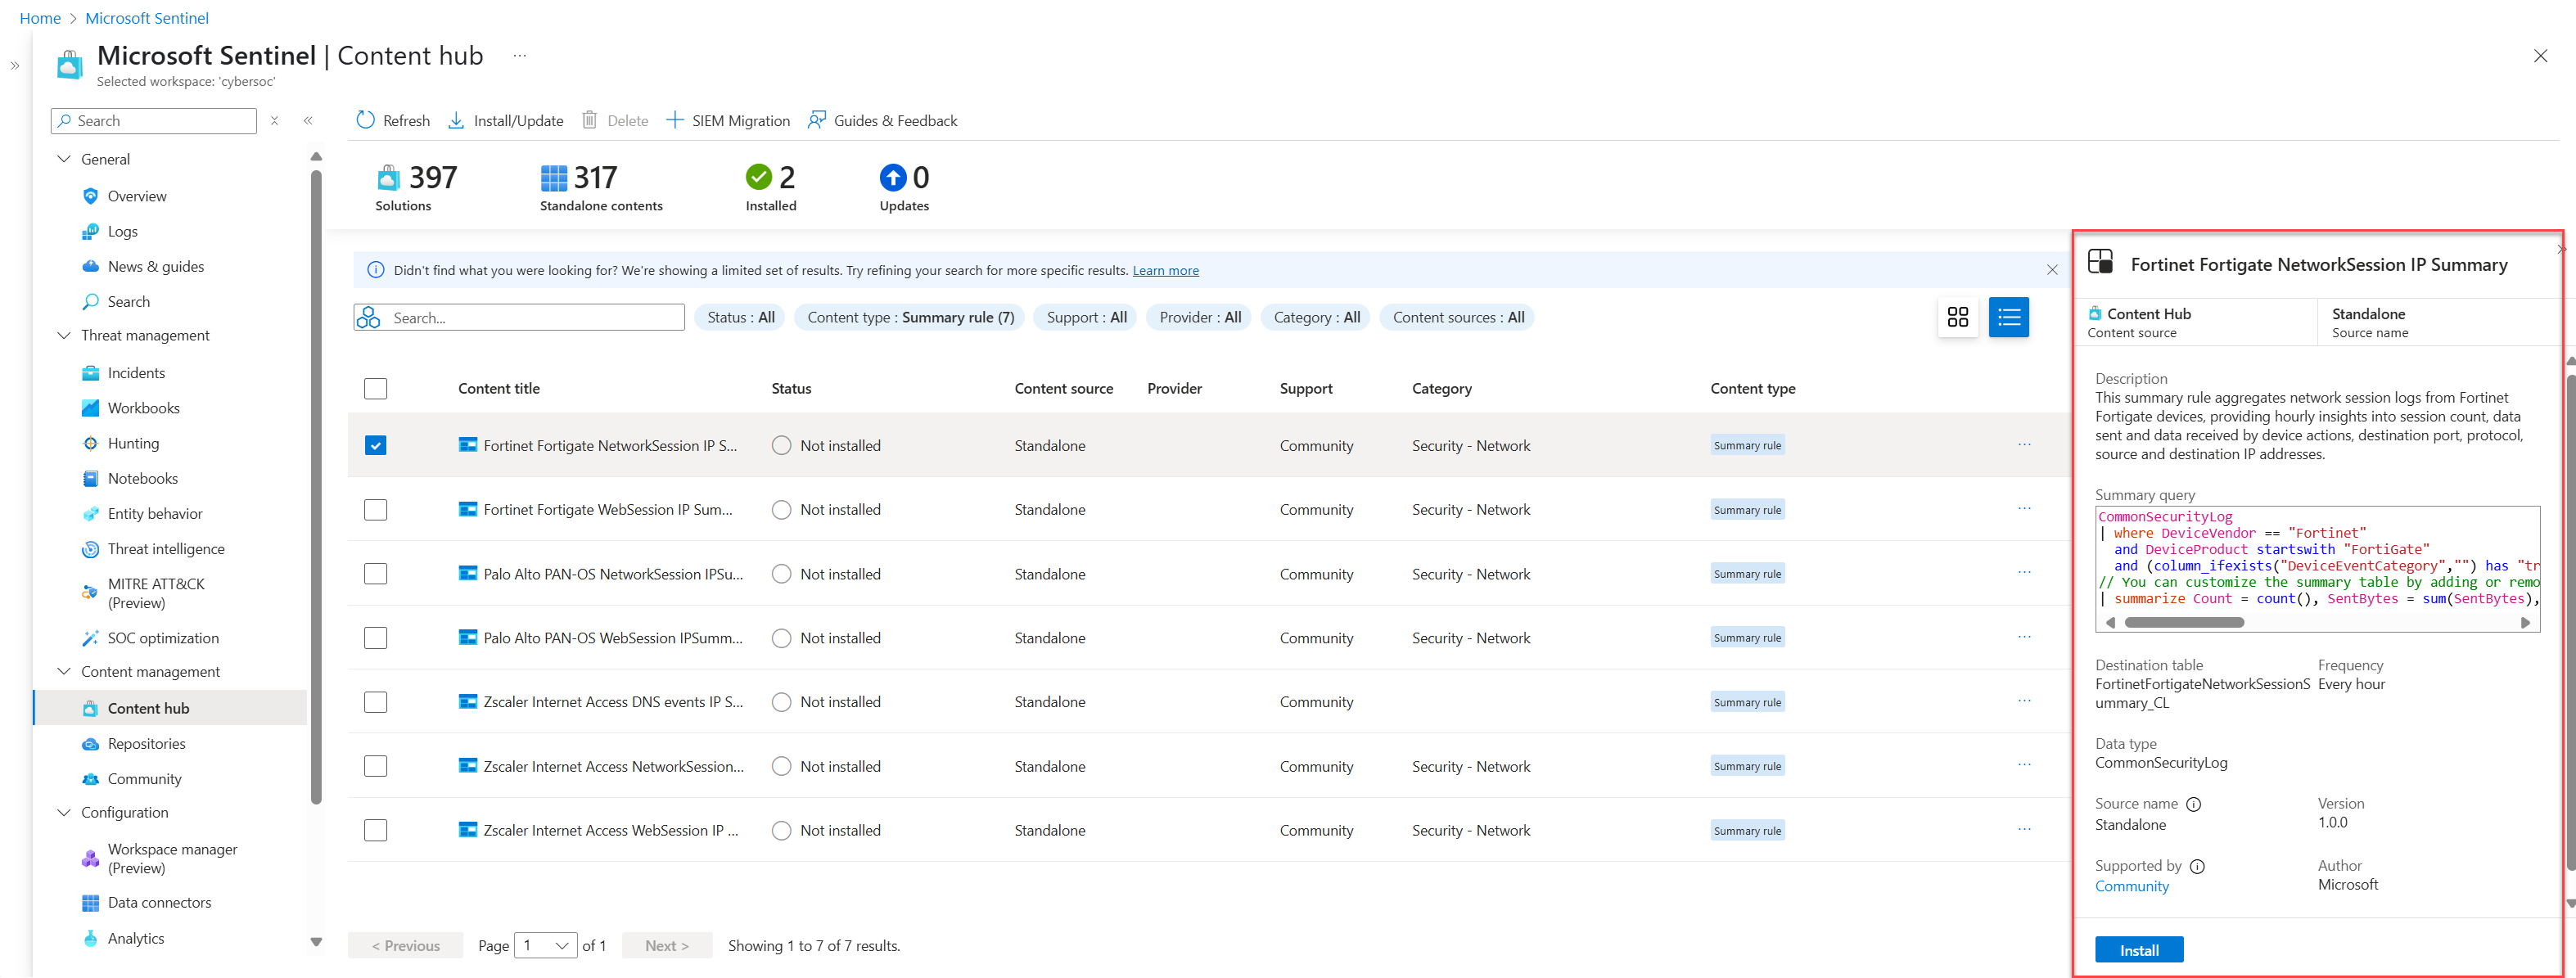
Select Install to install the template.
Select the Templates tab on the Summary rules page, and select the summary rule you installed.
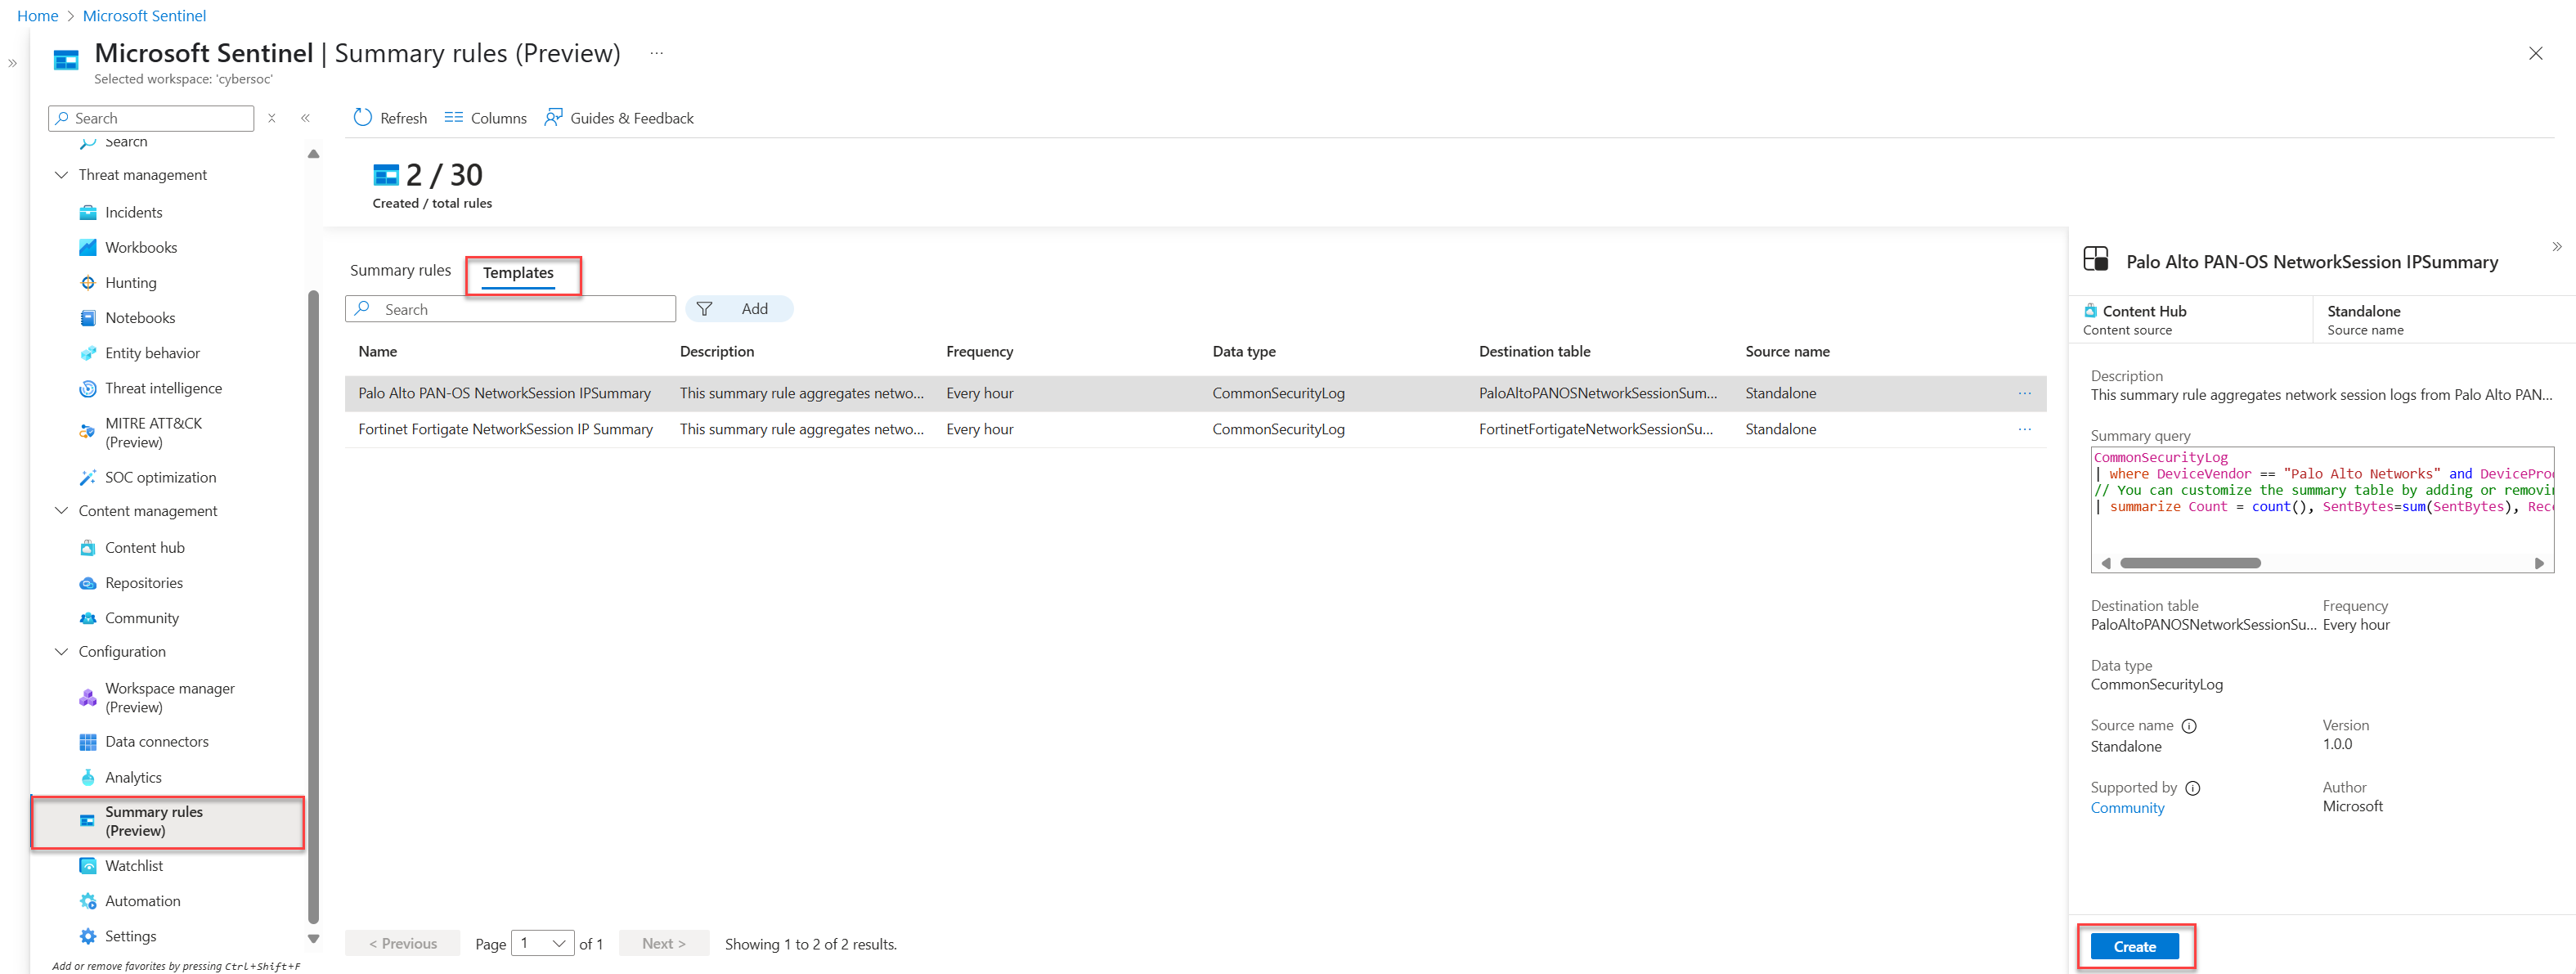
Select Create to open the Summary rule wizard, where all of the fields are prepopulated.
Go through the Summary rule wizard and select Save to deploy the summary rule.
For more information about the Summary rule wizard, see Create a new summary rule.


Sample summary rule scenarios in Microsoft Sentinel
This section reviews common scenarios for creating summary rules in Microsoft Sentinel, and our recommendations for how to configure each rule. For more information and examples, see Summarize insights from raw data in an Auxiliary table to an Analytics table in Microsoft Sentinel and Log sources to use for Auxiliary Logs ingestion.
Quickly find a malicious IP address in your network traffic
Scenario: You're a threat hunter, and one of your team's goals is to identify all instances of when a malicious IP address interacted in the network traffic logs from an active incident, in the last 90 days.
Challenge: Microsoft Sentinel currently ingests multiple terabytes of network logs a day. You need to move through them quickly to find matches for the malicious IP address.
Solution: We recommend using summary rules to do the following:
Create a summary data set for each IP address related to the incident, including the
SourceIP,DestinationIP,MaliciousIP,RemoteIP, each listing important attributes, such asIPType,FirstTimeSeen, andLastTimeSeen.The summary dataset enables you to quickly search for a specific IP address and narrow down the time range where the IP address is found. You can do this even when the searched events happened more than 90 days ago, which is beyond their workspace retention period.
In this example, configure the summary to run daily, so that the query adds new summary records every day until it expires.
Create an analytics rule that runs for less than two minutes against the summary dataset, quickly drilling into the specific time range when the malicious IP address interacted with the company network.
Make sure to configure run intervals of up to five minutes at a minimum, to accommodate different summary payload sizes. This ensures that there's no loss even when there's an event ingestion delay.
For example:
let csl_columnmatch=(column_name: string) {
summarized_CommonSecurityLog
| where isnotempty(column_name)
| extend
    Date = format_datetime(TimeGenerated, "yyyy-MM-dd"),
    IPaddress = column_ifexists(column_name, ""),
    FieldName = column_name
| extend IPType = iff(ipv4_is_private(IPaddress) == true, "Private", "Public")
| where isnotempty(IPaddress)
| project Date, TimeGenerated, IPaddress, FieldName, IPType, DeviceVendor
| summarize count(), FirstTimeSeen = min(TimeGenerated), LastTimeSeen = min(TimeGenerated) by Date, IPaddress, FieldName, IPType, DeviceVendor
};
union csl_columnmatch("SourceIP")
    , csl_columnmatch("DestinationIP")
    , csl_columnmatch("MaliciousIP")
    , csl_columnmatch("RemoteIP")
// Further summarization can be done per IPaddress to remove duplicates per day on larger timeframe for the first run
| summarize make_set(FieldName), make_set(DeviceVendor) by IPType, IPaddress
Run a subsequent search or correlation with other data to complete the attack story.
Generate alerts on threat intelligence matches against network data
Generate alerts on threat intelligence matches against noisy, high volume, and low-security value network data.
Scenario: You need to build an analytics rule for firewall logs to match domain names in the system that have been visited against a threat intelligence domain name list.
Most of the data sources are raw logs that are noisy and have high volume, but have lower security value, including IP addresses, Azure Firewall traffic, Fortigate traffic, and so on. There's a total volume of about 1 TB per day.
Challenge: Creating separate rules requires multiple logic apps, requiring extra setup and maintenance overhead and costs.
Solution: We recommend using summary rules to do the following:
Create a summary rule:
Extend your query to extract key fields, such as the source address, destination address, and destination port from the CommonSecurityLog_CL table, which is the CommonSecurityLog with the Auxiliary plan.
Perform an inner lookup against the active Threat Intelligence Indicators to identify any matches with our source address. This allows you to cross-reference your data with known threats.
Project relevant information, including the time generated, activity type, and any malicious source IPs, along with the destination details. Set the frequency you want the query to run, and the destination table, such as MaliciousIPDetection . The results in this table are in the analytic tier and are charged accordingly.
Create an alert:
Creating an analytics rule in Microsoft Sentinel that alerts based on results from the MaliciousIPDetection table. This step is crucial for proactive threat detection and incident response.
Sample summary rule:
CommonSecurityLog_CL
| extend sourceAddress = tostring(parse_json(Message).sourceAddress), destinationAddress = tostring(parse_json(Message).destinationAddress), destinationPort = tostring(parse_json(Message).destinationPort)
| lookup kind=inner (ThreatIntelligenceIndicator | where Active == true ) on $left.sourceAddress == $right.NetworkIP
| project TimeGenerated, Activity, Message, DeviceVendor, DeviceProduct, sourceMaliciousIP =sourceAddress, destinationAddress, destinationPort