Note
Access to this page requires authorization. You can try signing in or changing directories.
Access to this page requires authorization. You can try changing directories.
In this article, learn how to monitor Azure Site Recovery, using Site Recovery inbuilt monitoring. You can monitor:
- The health and status of machines replicated by Site Recovery
- Test failover status of machines.
- Issues and errors affecting configuration and replication.
- Infrastructure components such as on-premises servers.
Before you start
You might want to review common monitoring questions before you start.
Monitor in the dashboard
In the vault, select Overview. The Recovery Services dashboard consolidates all monitoring information for the vault in a single location. There are pages for both Site Recovery and the Azure Backup service, and you can switch between them.
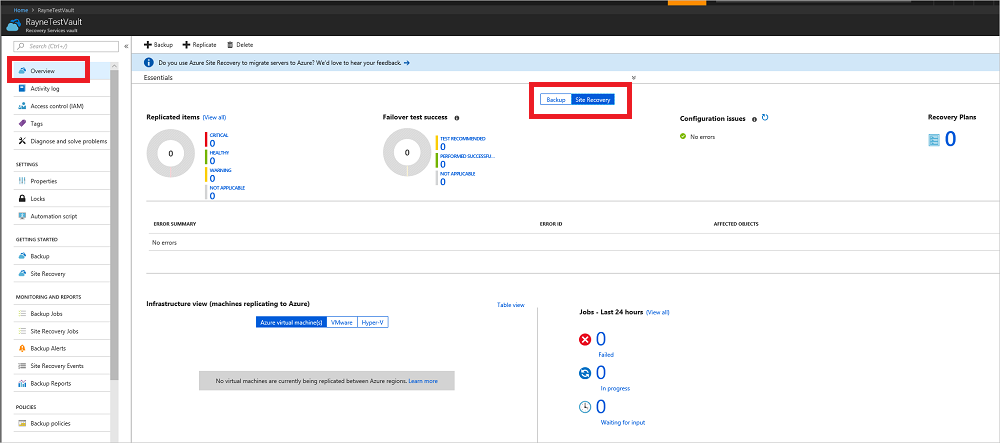
From the dashboard, drill down into different areas.
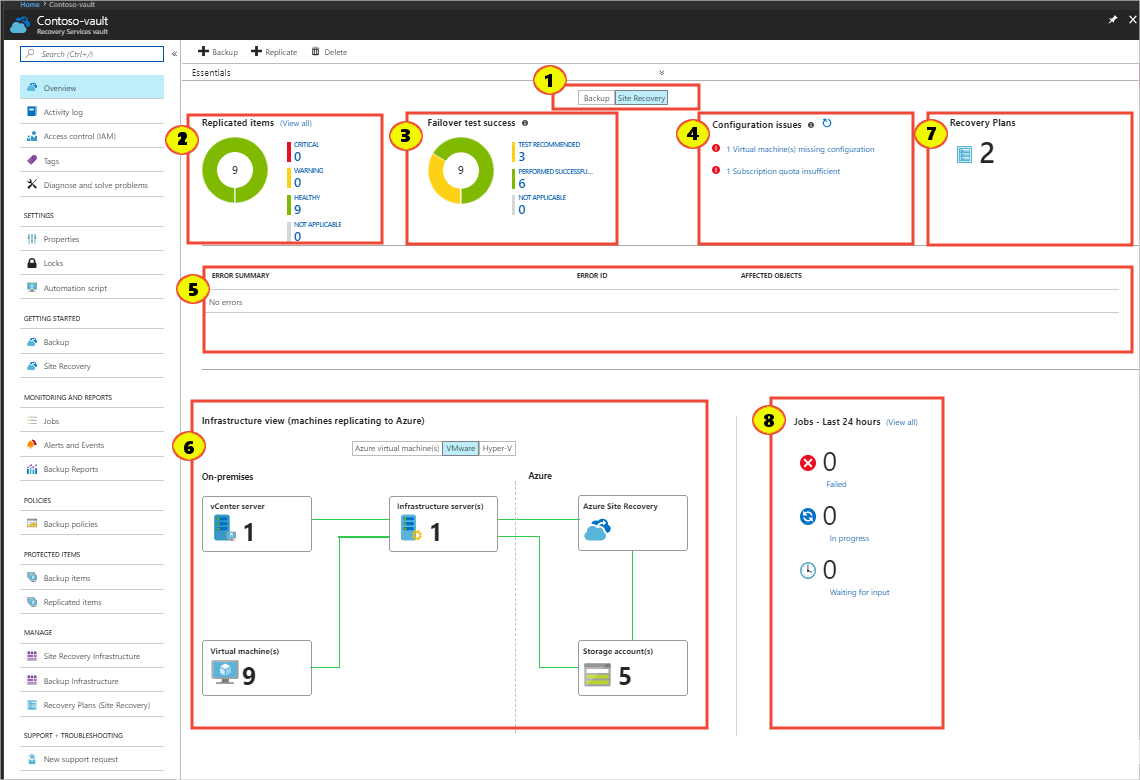
In Replicated items, select View All to see all the servers in the vault.
Select the status details in each section to drill down.
In Infrastructure view, sort monitoring information by the type of machines you're replicating.


Monitor replicated items
In Replicated items, monitor the health of all machines in the vault that have replication enabled.
| State | Details |
|---|---|
| Healthy | Replication is progressing normally. No error or warning symptoms are detected. |
| Warning | One or more warning symptoms that might impact replication are detected. |
| Critical | One or more critical replication error symptoms have been detected. These error symptoms are typically indicators that replication stuck, or not progressing as fast as the data change rate. |
| Not applicable | Servers that aren't currently expected to be replicating. This might include machines that have been failed over. |
Monitor test failovers
In Failover test success, monitor the failover status for machines in the vault.
- We recommend that you run a test failover on replicated machines at least once every six months. It's a way to check that failover is working as expected, without disrupting your production environment.
- A test failover is considered successful only after the failover and post-failover cleanup have completed successfully.
| State | Details |
|---|---|
| Test recommended | Machines that haven't had a test failover since protection was enabled. |
| Performed successfully | Machines with or more successful test failovers. |
| Not applicable | Machines that aren't currently eligible for a test failover. For example, machines that are failed over, have initial replication/test failover/failover in progress. |
Monitor configuration issues
In Configuration issues, monitor any issues that might impact your ability to fail over successfully.
- Configuration issues (except for software update availability), are detected by a periodic validator operation that runs every 12 hours by default. You can force the validator operation to run immediately by selecting the refresh icon next to the Configuration issues section heading.
- Select the links to get more details. For issues impacting specific machines, select needs attention in the Target configurations column. Details include remediation recommendations.
| State | Details |
|---|---|
| Missing configurations | A necessary setting is missing, such as a recovery network or a resource group. |
| Missing resources | A specified resource can't be found or isn't available in the subscription. For example, the resource was deleted or migrated. Monitored resources included the target resource group, target VNet/subnet, log/target storage account, target availability set, target IP address. |
| Subscription quota | The available subscription resource quota balance is compared against the balance needed to fail over all of the machines in the vault. If there aren't enough resources, an insufficient quota balance is reported. Quotas are monitoring for VM core count, VM family core count, network interface card (NIC) count. |
| Software updates | The availability of new software updates, and information about expiring software versions. |
Monitor errors
In Error summary, monitor currently active error symptoms that might impact replication of servers in the vault, and monitor the number of impacted machines.
- Errors impacting on-premises infrastructure components are shown at the beginning of the section. For example, non-receipt of a heartbeat from the Azure Site Recovery Provider on the on-premises configuration server, or Hyper-V host.
- Next, replication error symptoms impacting replicated servers are shown.
- The table entries are sorted by decreasing order of the error severity, and then by decreasing count order of the impacted machines.
- The impacted server count is a useful way to understand whether a single underlying issue might impact multiple machines. For example, a network glitch could potentially impact all machines that replicate to Azure.
- Multiple replication errors can occur on a single server. In this case, each error symptom counts that server in the list of its impacted servers. After the issue is fixed, replication parameters improve, and the error is cleared from the machine.
Monitor the infrastructure.
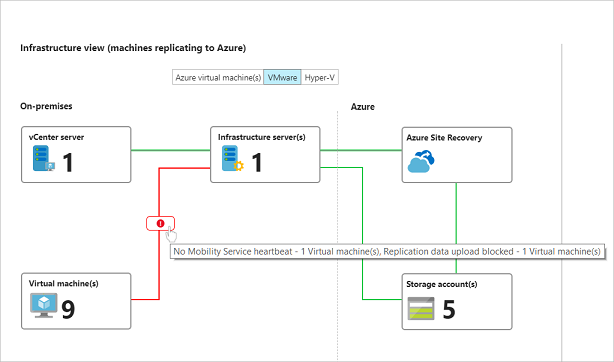
In Infrastructure view, monitor the infrastructure components involved in replication, and connectivity health between servers and the Azure services.
A green line indicates that connection is healthy.
A red line with the overlaid error icon indicates the existence of one or more error symptoms that impact connectivity.
Hover the mouse pointer over the error icon to show the error and the number of impacted entities and select the icon for a filtered list of impacted entities.

Tips for monitoring the infrastructure
Make sure that the on-premises infrastructure components (configuration server, process servers, VMM servers, Hyper-V hosts, VMware machines) are running the latest versions of the Site Recovery Provider and/or agents.
To use all the features in the infrastructure view, you should be running Update rollup 22 for these components.
To use the infrastructure view, select the appropriate replication scenario in your environment. You can drill down in the view for more details. The following table shows which scenarios are represented.
Scenario State View available? Replication between on-premises sites All states No Azure VM replication between Azure regions Replication enabled/initial replication in progress Yes Azure VM replication between Azure regions Failed over/fail back No VMware replication to Azure Replication enabled/initial replication in progress Yes VMware replication to Azure Failed over/failed back No Hyper-V replication to Azure Failed over/failed back No To see the infrastructure view for a single replicating machine, in the vault menu, select Replicated items, and select a server.
Monitor recovery plans
In Recovery plans, monitor the number of plans, create new plans, and modify existing ones.
Monitor jobs
In Jobs, monitor the status of Site Recovery operations.
- Most operations in Azure Site Recovery are executed asynchronously, with a tracking job being created and used to track progress of the operation.
- The job object has all the information you need to track the state and the progress of the operation.
Monitor jobs as follows:
In the dashboard > Jobs section, you can see a summary of jobs that have completed, are in progress, or waiting for input, in the last 24 hours. You can select any state to get more information about the relevant jobs.
Select View all to see all jobs in the last 24 hours.
Note
You can also access job information from the vault menu > Site Recovery Jobs.
In the Site Recovery Jobs list, a list of jobs is displayed. On the top menu you can get error details for a specific job, filter the jobs list based on specific criteria, and export selected job details to Excel.
You can drill into a job by selecting it.
Monitor virtual machines
In Replicated items, get a list of replicated machines.
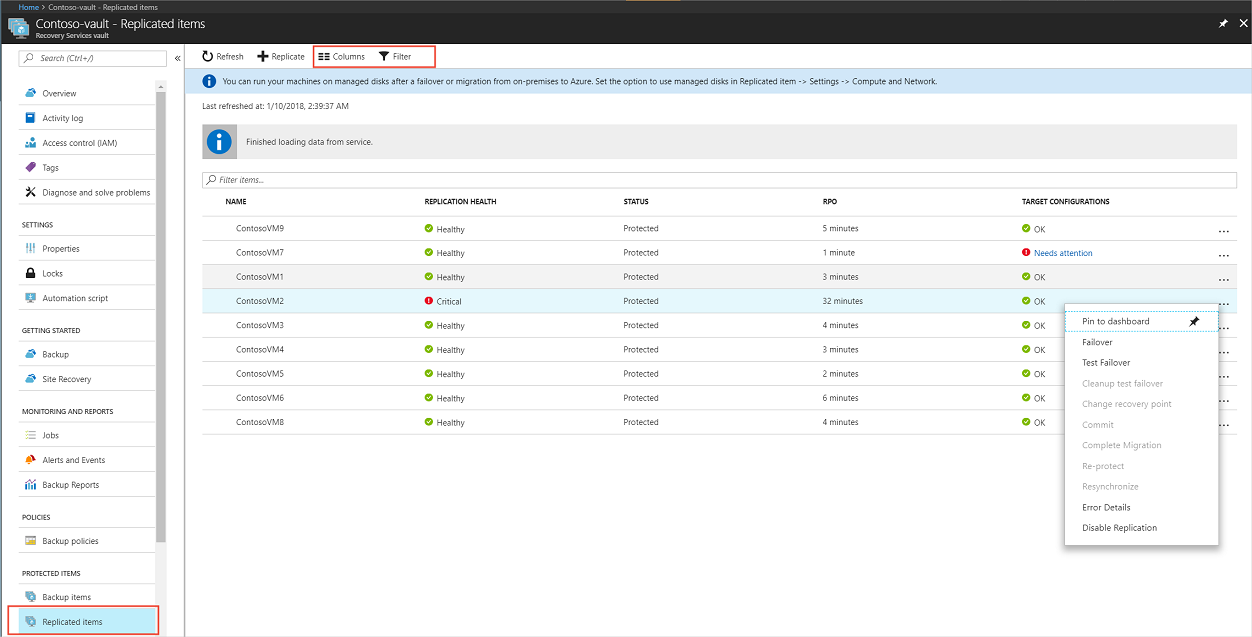
You can view and filter information. On the action menu at the top, you can perform actions for a particular machine, including running a test failover, or viewing specific errors.
Select Columns to show additional columns, For example to show RPO, target configuration issues, and replication errors.
Select Filter to view information based on specific parameters such as replication health, or a particular replication policy.
Select a machine to initiate operations such as test failover for it, or to view specific error details associated with it.
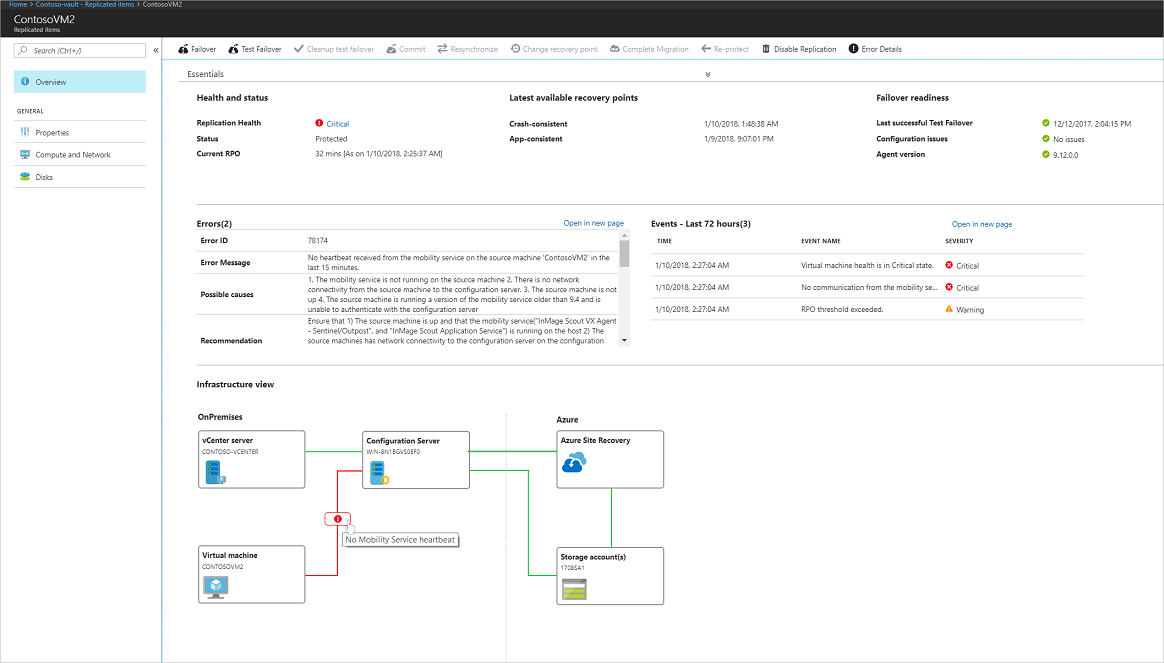
Select a machine to drill into more details for it. Details include:
- Replication information: Current status and health of the machine.
- RPO (recovery point objective): Current RPO for the virtual machine and the time at which the RPO was last computed.
- Recovery points: Latest available recovery points for the machine.
- Failover readiness: Indicates whether a test failover was run for the machine, the agent version running on the machine (for machines running the Mobility service), and any configuration issues.
- Errors: List of replication error symptoms currently observed on the machine, and possible causes/actions.
- Events: A chronological list of recent events impacting the machine. Error details show the currently observable error symptoms, while events is a historical record of issues that have impacted the machine.
- Infrastructure view: Shows state of infrastructure for the scenario when machines are replicating to Azure.


Subscribe to email notifications
You can subscribe to receive email notifications for these critical events:
- Critical state for replicated machine.
- No connectivity between the on-premises infrastructure components and Site Recovery service. Connectivity between Site Recovery and on-premises servers registered in a vault is detected using a heartbeat mechanism.
- Failover failures.
Note
Enabling email notification for ASR does not incur any additional costs.
Subscribe as follows:
In the vault > Monitoring section, select Site Recovery Events.
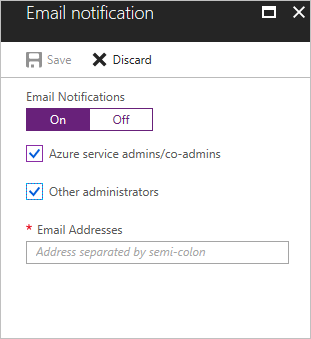
Select Email notifications.
In Email notification, turn on notifications and specify who to send to. You can send to all subscription admins be sent notifications, and optionally specific email addresses.

Built-in Azure Monitor alerts for Azure Site Recovery
Azure Site Recovery also provides default alerts via Azure Monitor, which enables you to have a consistent experience for alert management across different Azure services. With Azure Monitor based alerts, you can route alerts to any notification channel supported by Azure Monitor, such as email, Webhook, Logic app, and more. You can also use other alert management capabilities offered by Azure Monitor, for example, suppressing notifications during a planned maintenance window.
Note
We recommended that you wait for 24 hours for the registration to take effect before testing out the feature.
Alerts scenarios
Azure Site Recovery sends a default alert (surfaced via Azure Monitor) whenever any of the following critical events occur:
- Enable disaster recovery failure alerts for Azure VM, Hyper-V, and VMware replication.
- Replication health critical alerts for Azure VM, Hyper-V, and VMware replication.
- Azure Site Recovery agent version expiry alerts for Azure VM and Hyper-V replication.
- Azure Site Recovery agent not reachable alerts for Hyper-V replication.
- Failover failure alerts for Azure VM, Hyper-V, and VMware replication.
- Auto certification expiry alerts for Azure VM replication.
To test the working of the alerts for a test VM using Azure Site Recovery, you can disable public network access for the cache storage account so that a Replication Health turned to critical alert is generated.
Note
Alerts are generated by default, without any need for rule configuration. However, to enable notifications (for example, email notifications) for these generated alerts, you must create an alert processing rule as described in the following sections.
Manage Azure Site Recovery alerts in Recovery Services Vault
You can view the alerts settings under Recovery Services Vault > Settings > Properties > Monitoring Settings. The built-in alerts for Site Recovery are enabled by default, but you can disable either or both categories of Site Recovery alerts. Select the checkbox to opt out of classic alerts for Site Recovery and only use built-in alerts. If not done, duplicate alerts are generated for classic and built-in.
Manage Azure Site Recovery alerts in Business Continuity Center
To manage your alerts settings, go to Business Continuity Center > Monitoring + Reporting > Alerts option. Select Manage alerts > Manage built-in alert settings for resources option.

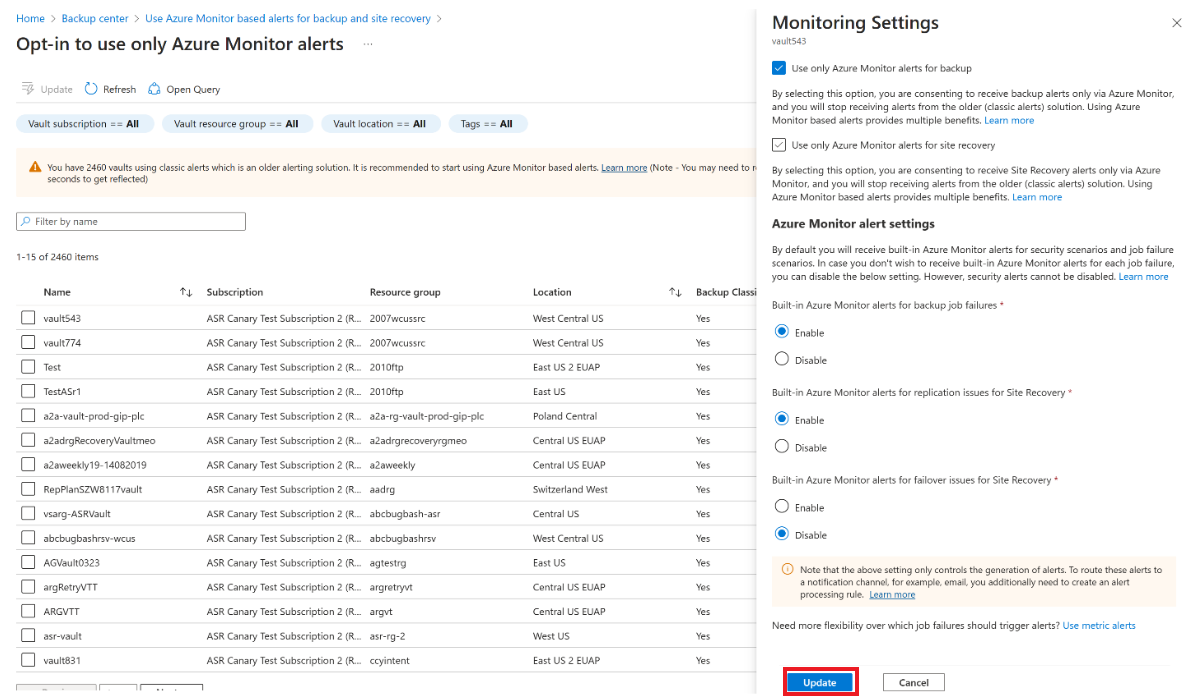
Get an at-scale view of all vaults across all subscriptions using Classic Alerts for Backup and Site Recovery. You can update the alert settings for each vault by selecting Update. You can also select only get Azure Monitor alerts and disable classic alerts. You can also choose to disable certain categories of built-in alerts that are enabled by default. Update settings and select Update to save.

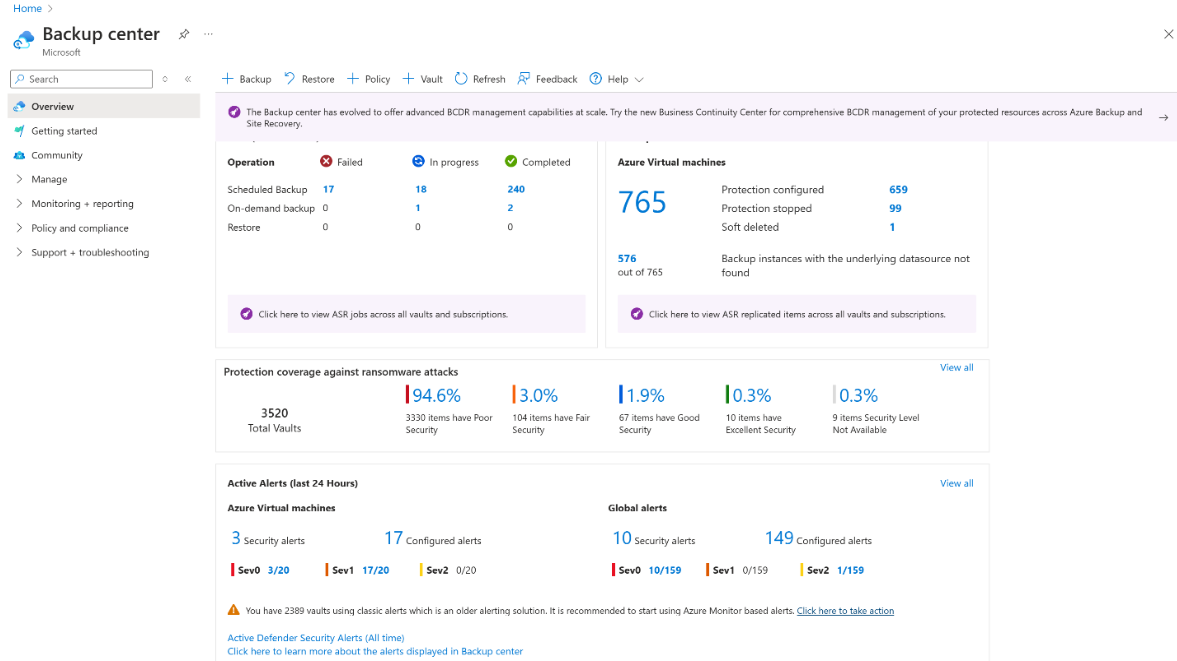
Manage Azure Site Recovery alerts in Backup Center
Important
This section describes an older alerting solution (referred to as classic alerts). We recommend you to switch to using Azure Monitor based alerts as it offers multiple benefits. For more information on how to switch, see Switch Azure Monitor Based alerts.
To manage your alerts settings, do the following:
- Select Click here to take action to manage built-in alerts for site recovery.
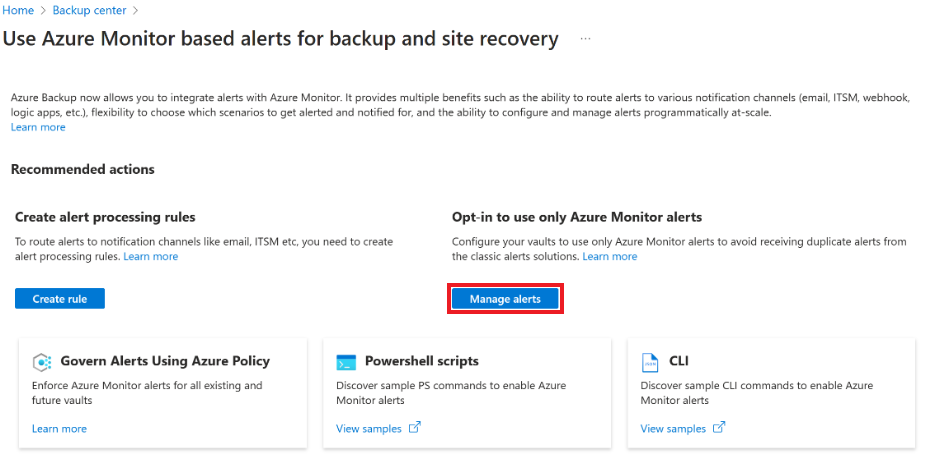
- Select Manage alerts to view alert configurations. Select Create rule to create alert processing rules to route alerts to different notification channels.
- Check which vaults have classic alerts configured for Backup and Site Recovery. The two columns Backup Classic Alerts and Site Recovery Classic Alerts show Yes if classic alerts are on. We recommend, to switch to Azure Monitor based alerts for a better monitoring experience by selecting Update.
- Select the options to only get Azure Monitor alerts and disable classic alerts. You can also choose to disable certain categories of built-in alerts that are enabled by default. Security alerts can't be disabled. Update settings and select Update to save.


View the generated Azure Site Recovery alerts in Recovery Services vault
Follow these steps to view the alerts generated for a particular vault via the vault experience:
- On the Azure portal, go to the Recovery Services vault that you are using.
- Select the Alerts section and filter for Monitor Service = Azure Site Recovery to see Azure Site Recovery specific alerts. You can customize the values of the other filters to see alerts of a specific time range up to 30 days, for vaults, subscriptions, severity and alert state (user response).
- Select any alert of your interest to see further details such as the affected VM, possible causes, recommended action, etc.
- Once the event is mitigated, you can modify its state to Closed or Acknowledged.
View the generated Azure Site Recovery alerts in Azure Monitor
Once alerts are generated, you can view and manage them from the Azure Monitor portal. Follow these steps:
On the Azure portal, go to Azure Monitor > Alerts.
Set the filter for Monitor Service = Azure Site Recovery to see Azure Site Recovery specific alerts. You can also customize the values of other filters to see alerts of a specific time range up to 30 days or for vaults, subscriptions, severity and alert state (user response).
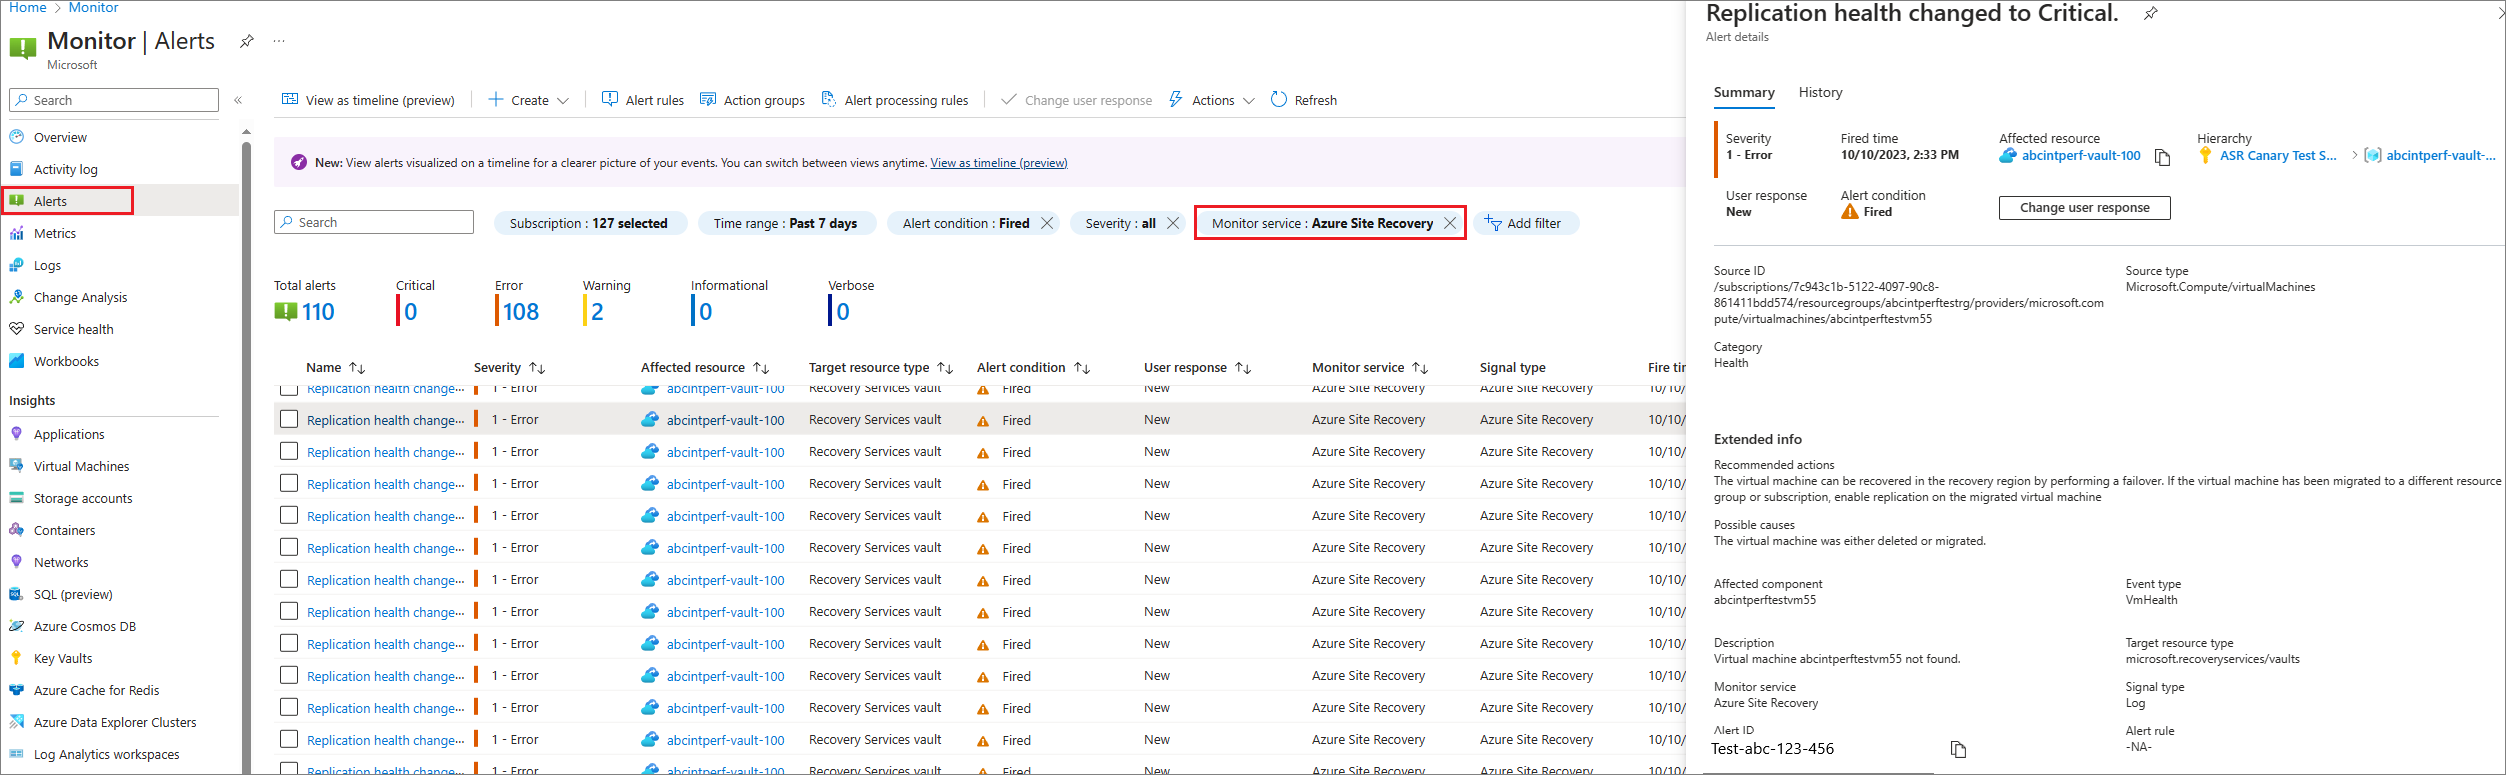
Select any alert of your interest to see further details. For example, the affected VM, possible causes, recommended action, etc.
Once the event is mitigated, you can modify its state to Closed or Acknowledged.


View the generated Azure Site Recovery alerts in Business Continuity Center
You can manage your alerts settings under Business Continuity Center > Monitoring + Reporting > Alerts blade. This shows you the alerts in order of Severity and Category. Select the hyperlink or View affected resources to get a detailed view of the alerts.

Select View alert to get alert details and take action.

Like Azure Monitor, Business Continuity Center, and Recovery Services Vault you can view alerts from Backup Center as well.
Configure email notifications for alerts
To configure email notifications for built-in Azure Monitor alerts for Azure Site Recovery, you must create an alert processing rule in Azure Monitor. The alert processing rule will specify which alerts should be sent to a particular notification channel (action group).
Follow these steps to create an alert processing rule:
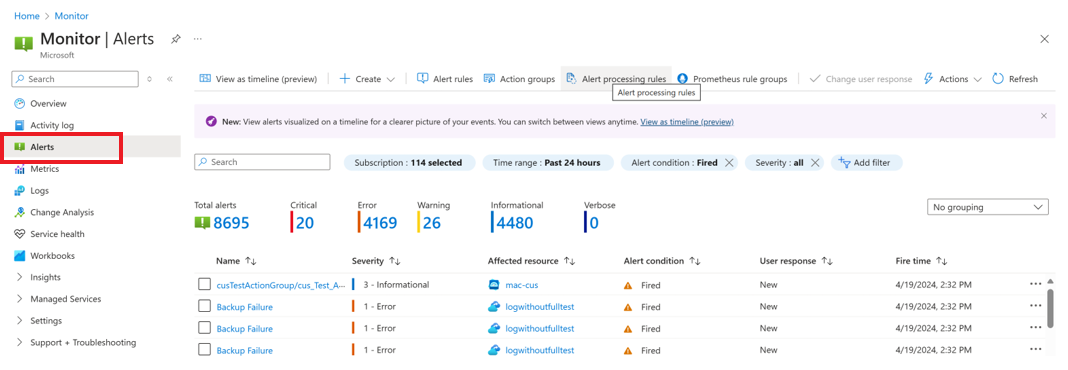
Go to Azure Monitor > Alerts and select Alert processing rules on the top pane.
Select Create.
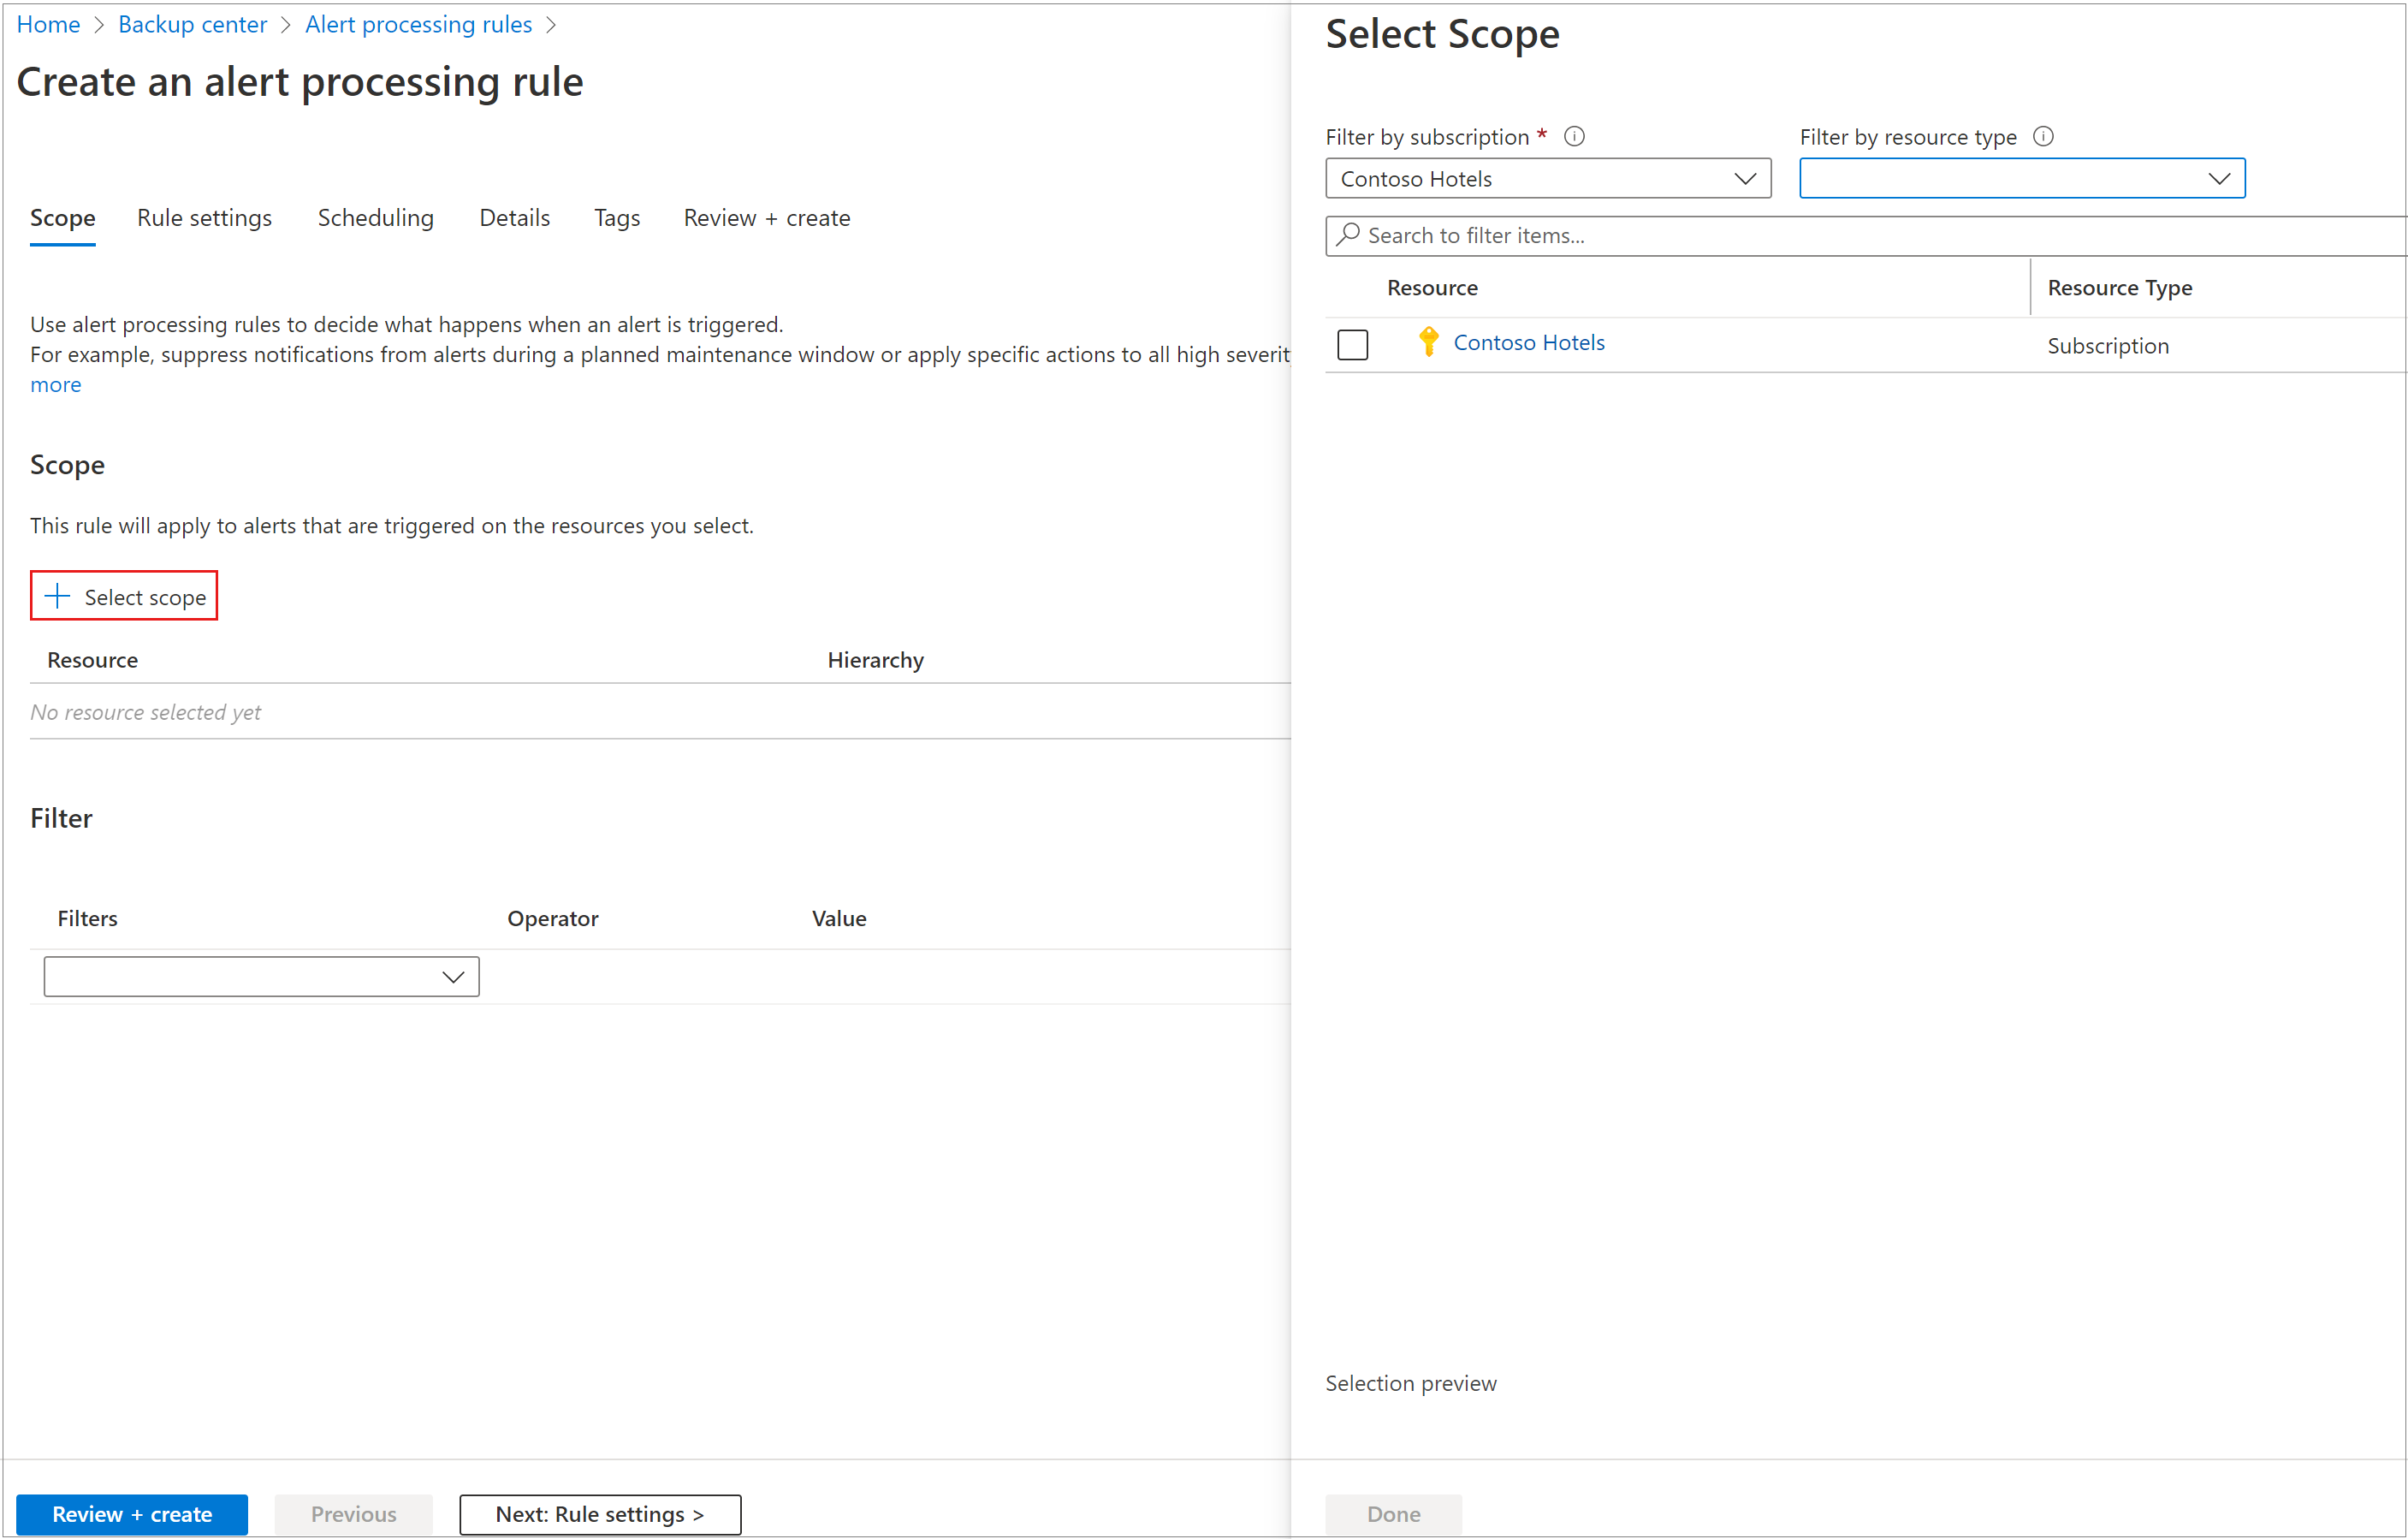
Under Scope > Select scope of the alert processing rule, you can apply the rule for all the resources within a subscription. Other customizations can be made to the scope by applying filters. For example, generating notification for alert of a certain severity.
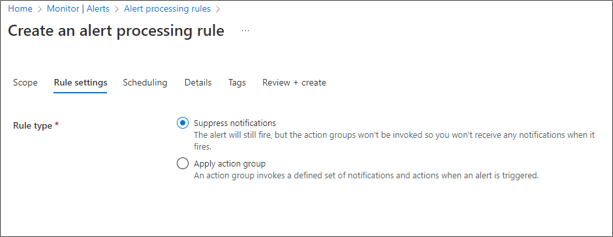
In Rule settings, select Apply action group and Create action group (or use an existing one). It is the destination to which the notification for an alert should be sent. For example, an email address.
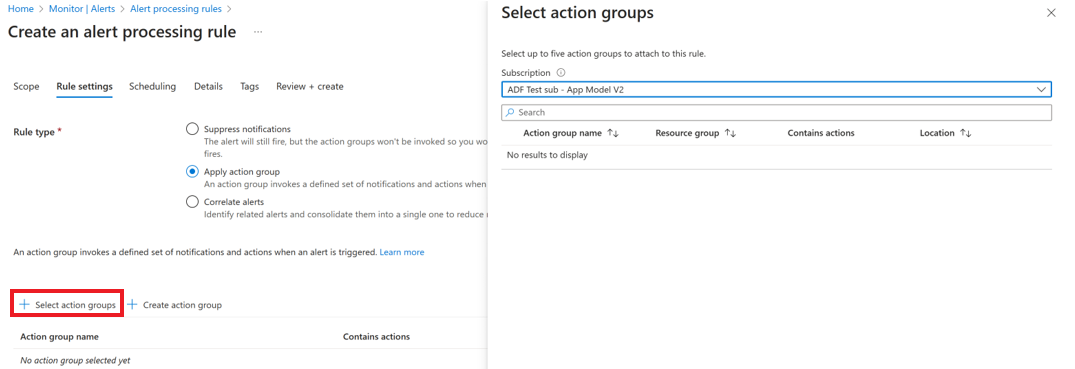
For the creation of an action group, in the Basics tab select the name of the action group, the subscription, and the resource group under which it must be created.
Under the Notifications tab, select the destination of the notification Email/ SMS Message/ Push/ Voice and enter the recipient's email ID and other details as necessary.
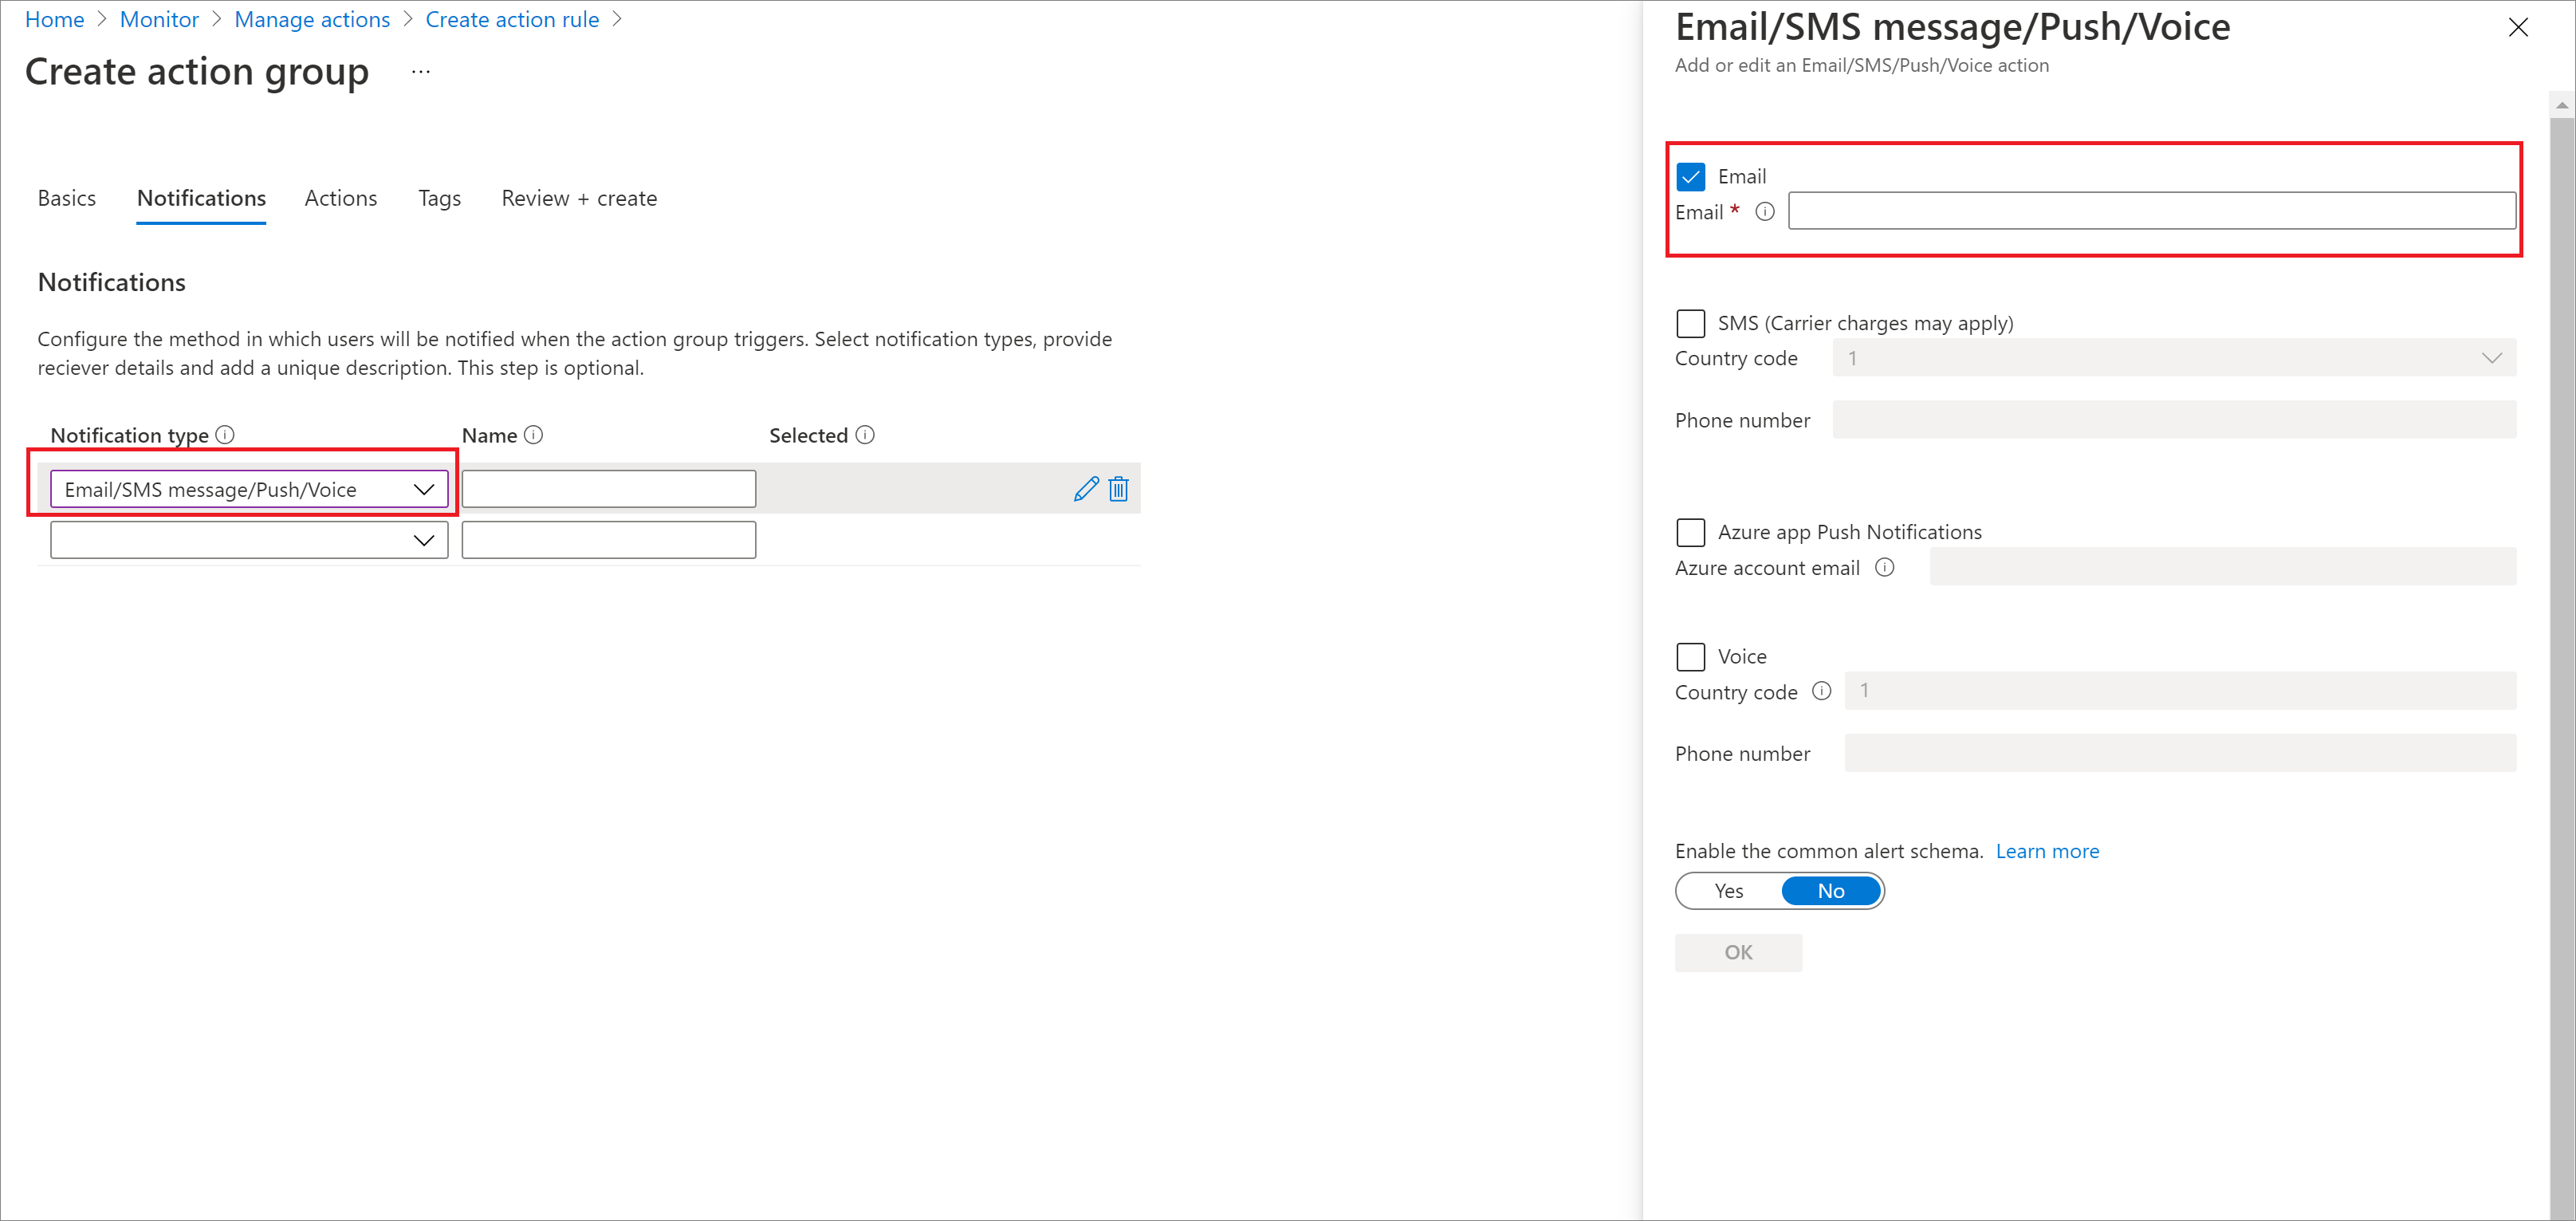
Select Review+Create > Create to deploy the action group. The creation of the action group leads you back to the alert processing rule creation.
Note
The created action group appears in the Rule settings page.
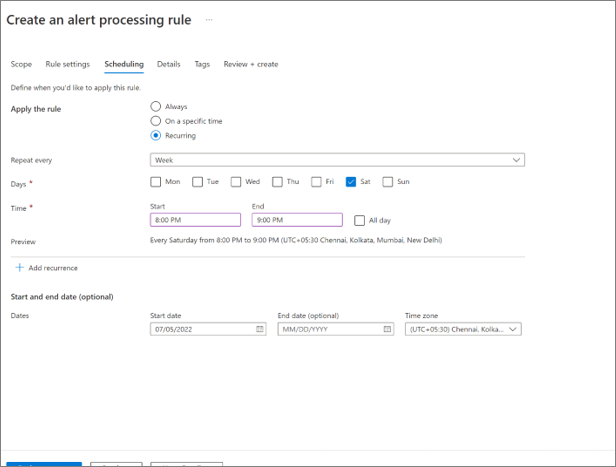
In the Scheduling tab select Always.
Under the Details tab specify the subscription, resource group and name of the alert processing rule being created.
Add Tags if needed and select Review+Create > Create. The alert processing rule will be active in a few minutes.


Configure notifications to non-email channels
With Azure Monitor action groups, you can route alerts to other notification channels like webhooks, logic apps, functions, etc. Learn more about supported action groups in Azure Monitor.
Configure notifications through programmatic interfaces
You can use the following interfaces supported by Azure Monitor to manage action groups and alert processing rules:
Suppress notifications during a planned maintenance window
There might be scenarios like maintenance windows during which Azure Site Recovery operations are expected to fail. If you have a requirement to suppress notifications during such periods, you can set up a suppression alert processing rule to run for a specific period.
To create a suppression alert processing rule, use the same process followed for creating a notification-based alert processing rule described in the earlier section, with the following differences:
Under Rule Settings, select Suppress notifications. If there is both a suppression alert processing rule and an action group alert processing rule applied on the same scope, the suppression rule takes precedence.
Under Scheduling, enter the window of time for which you want the alerts to be suppressed.


Pricing
With built-in Azure Monitor alerts, alerts for critical operations or failures are generated by default. You can view these alerts in the portal or via non-portal interfaces at no extra cost. However, to route these alerts to a notification channel (such as email), you incur a minor cost for notifications beyond the free tier (of 1000 emails per month). Learn more about Azure Monitor pricing.
Next steps
Learn about monitoring Site Recovery with Azure Monitor.