Note
Access to this page requires authorization. You can try signing in or changing directories.
Access to this page requires authorization. You can try changing directories.
Note
The Basic, Standard, and Enterprise plans entered a retirement period on March 17, 2025. For more information, see the Azure Spring Apps retirement announcement.
With Spring Boot Native Image applications, use the Azure Monitor OpenTelemetry Distro / Application Insights in Spring Boot native image Java application project instead of the Application Insights Java agent.
This article applies to: ✅ Basic/Standard ✅ Enterprise
This article explains how to monitor applications by using the Application Insights Java agent in Azure Spring Apps.
With this feature you can:
- Search tracing data with different filters.
- View a dependency map of Spring applications.
- Check request performance.
- Monitor real-time live metrics.
- Check request failures.
- Check application metrics.
- Check application logs.
Application Insights can provide many observable perspectives, including:
- Application map
- Performance
- Failures
- Metrics
- Live Metrics
- Availability
- Logs
Using the Application Insights feature
When the Application Insights feature is enabled, you can:
In the navigation pane, select Application Insights to view the Overview page of Application Insights. The Overview page shows you an overview of all running applications.
Select Application Map to see the status of calls between applications.
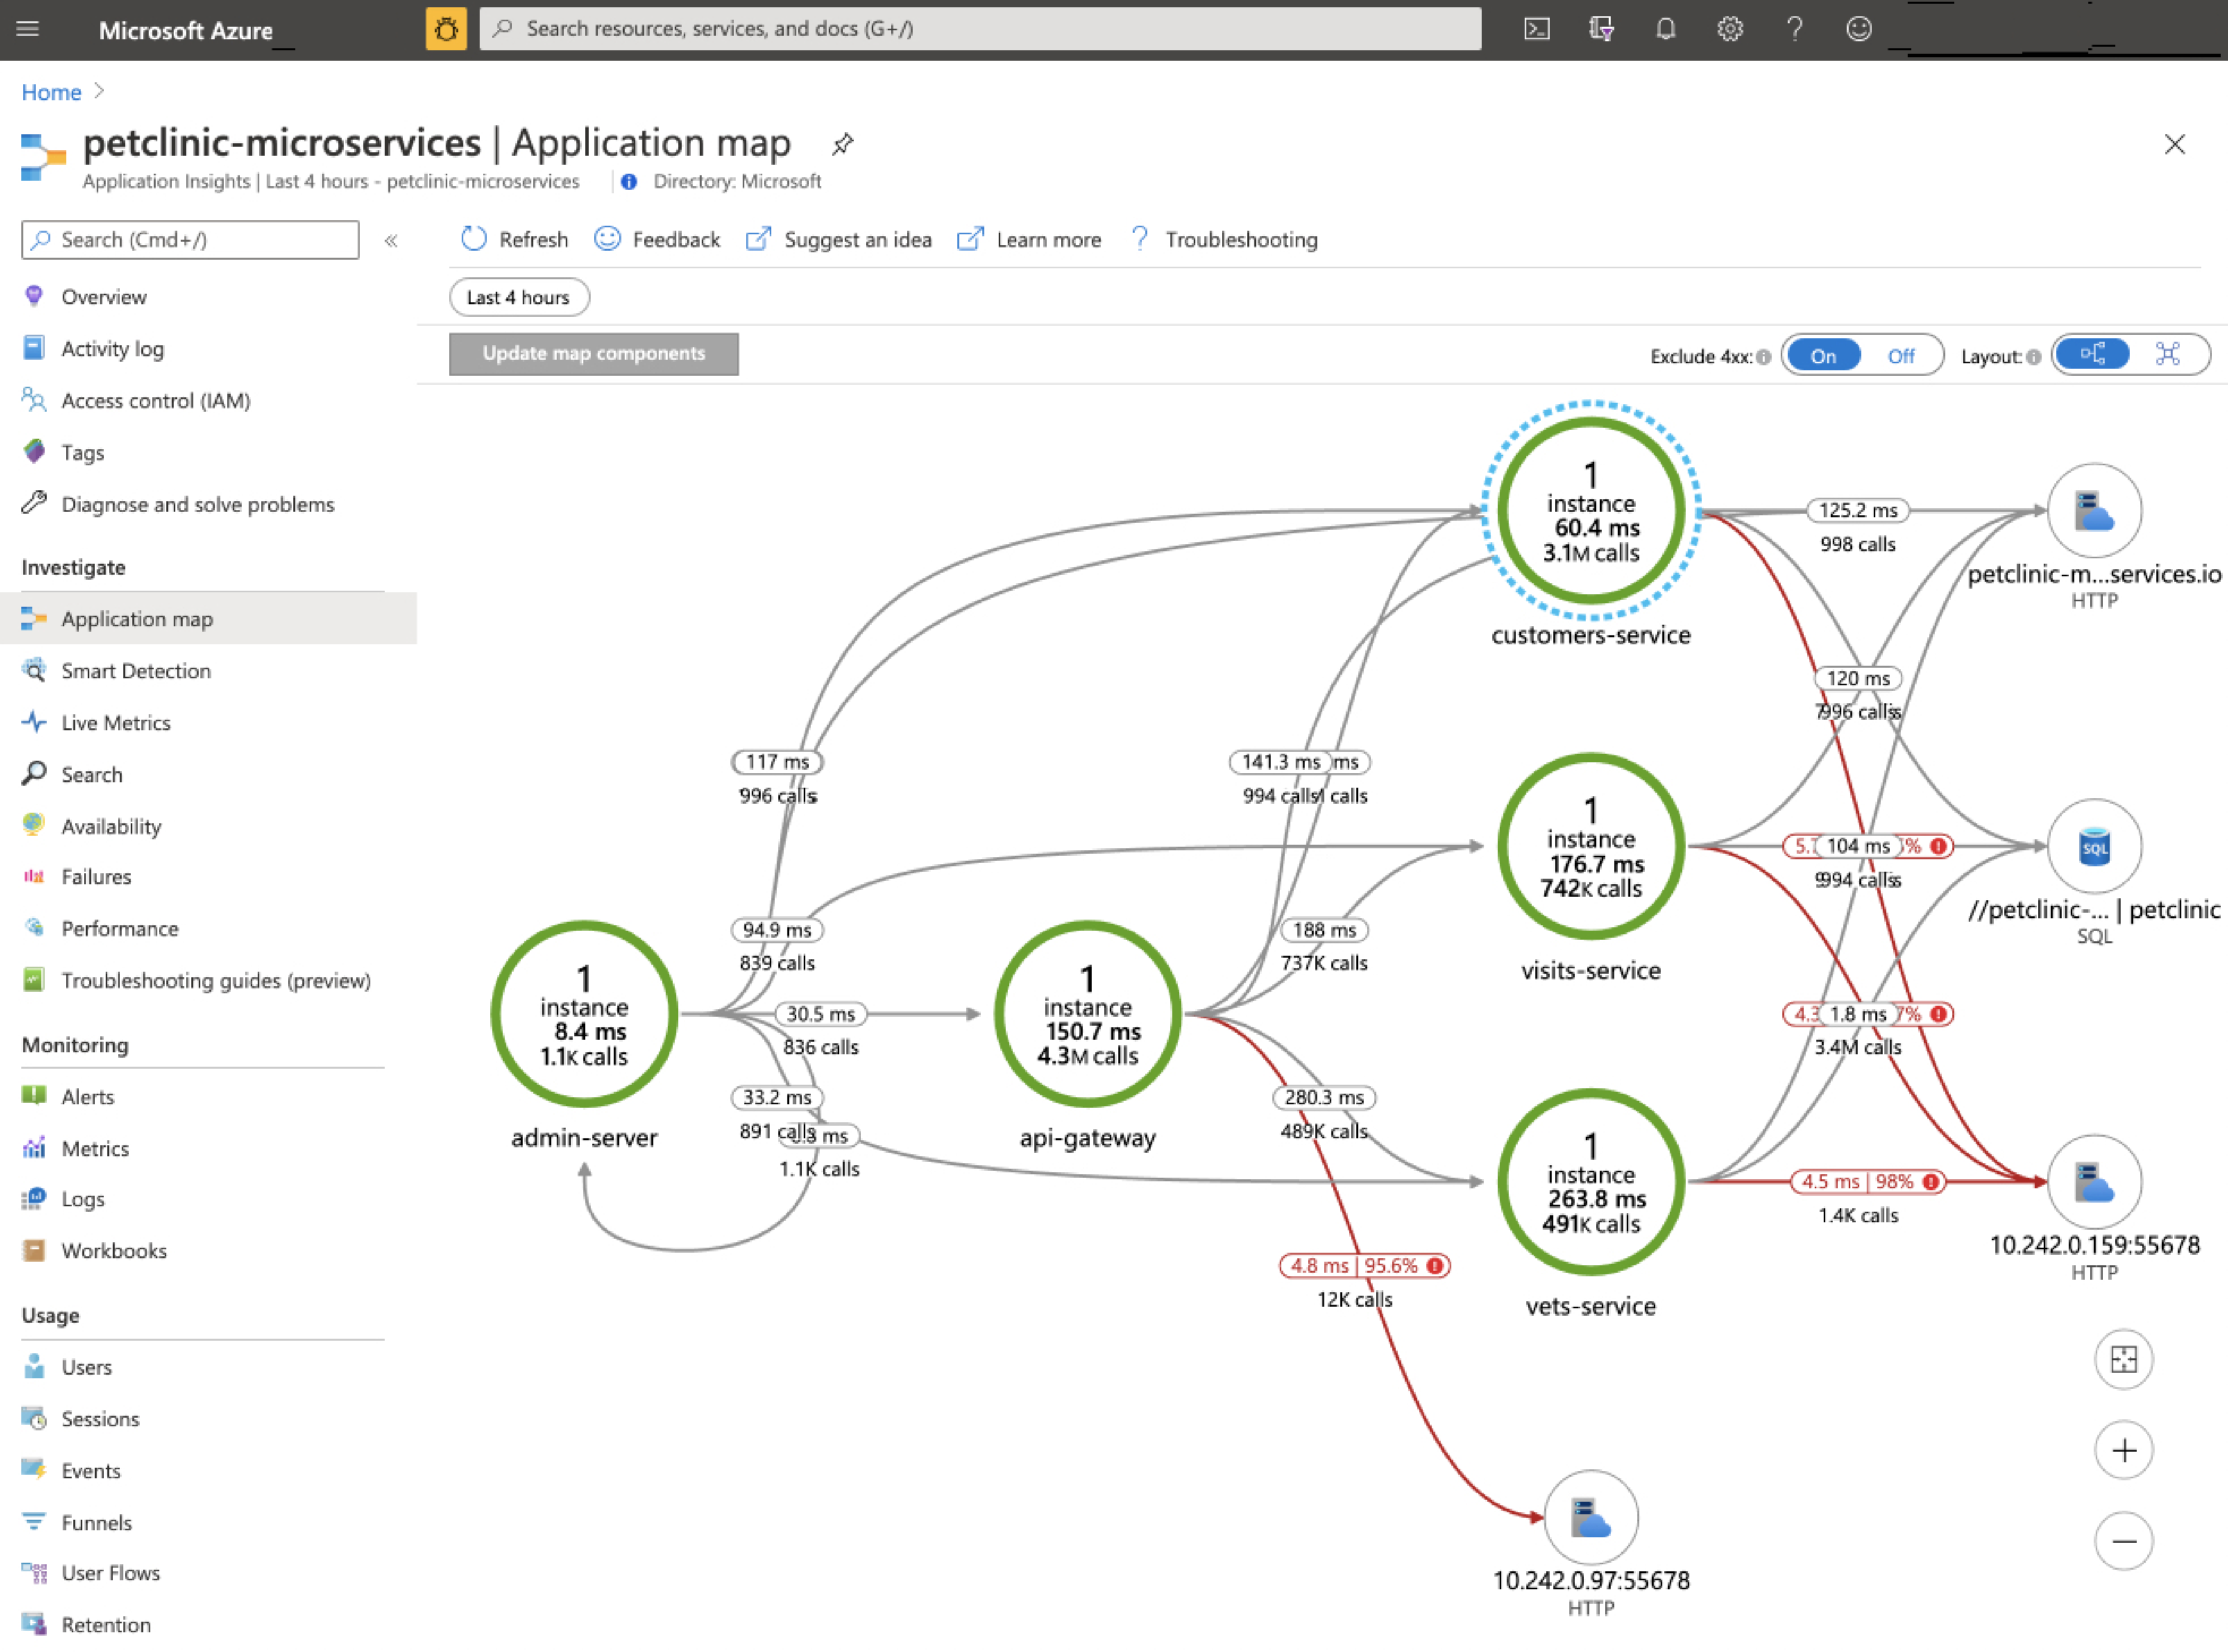
Select the link between customers-service and petclinic to see more details such as a query from SQL.
Select an endpoint to see all the applications making requests to the endpoint.
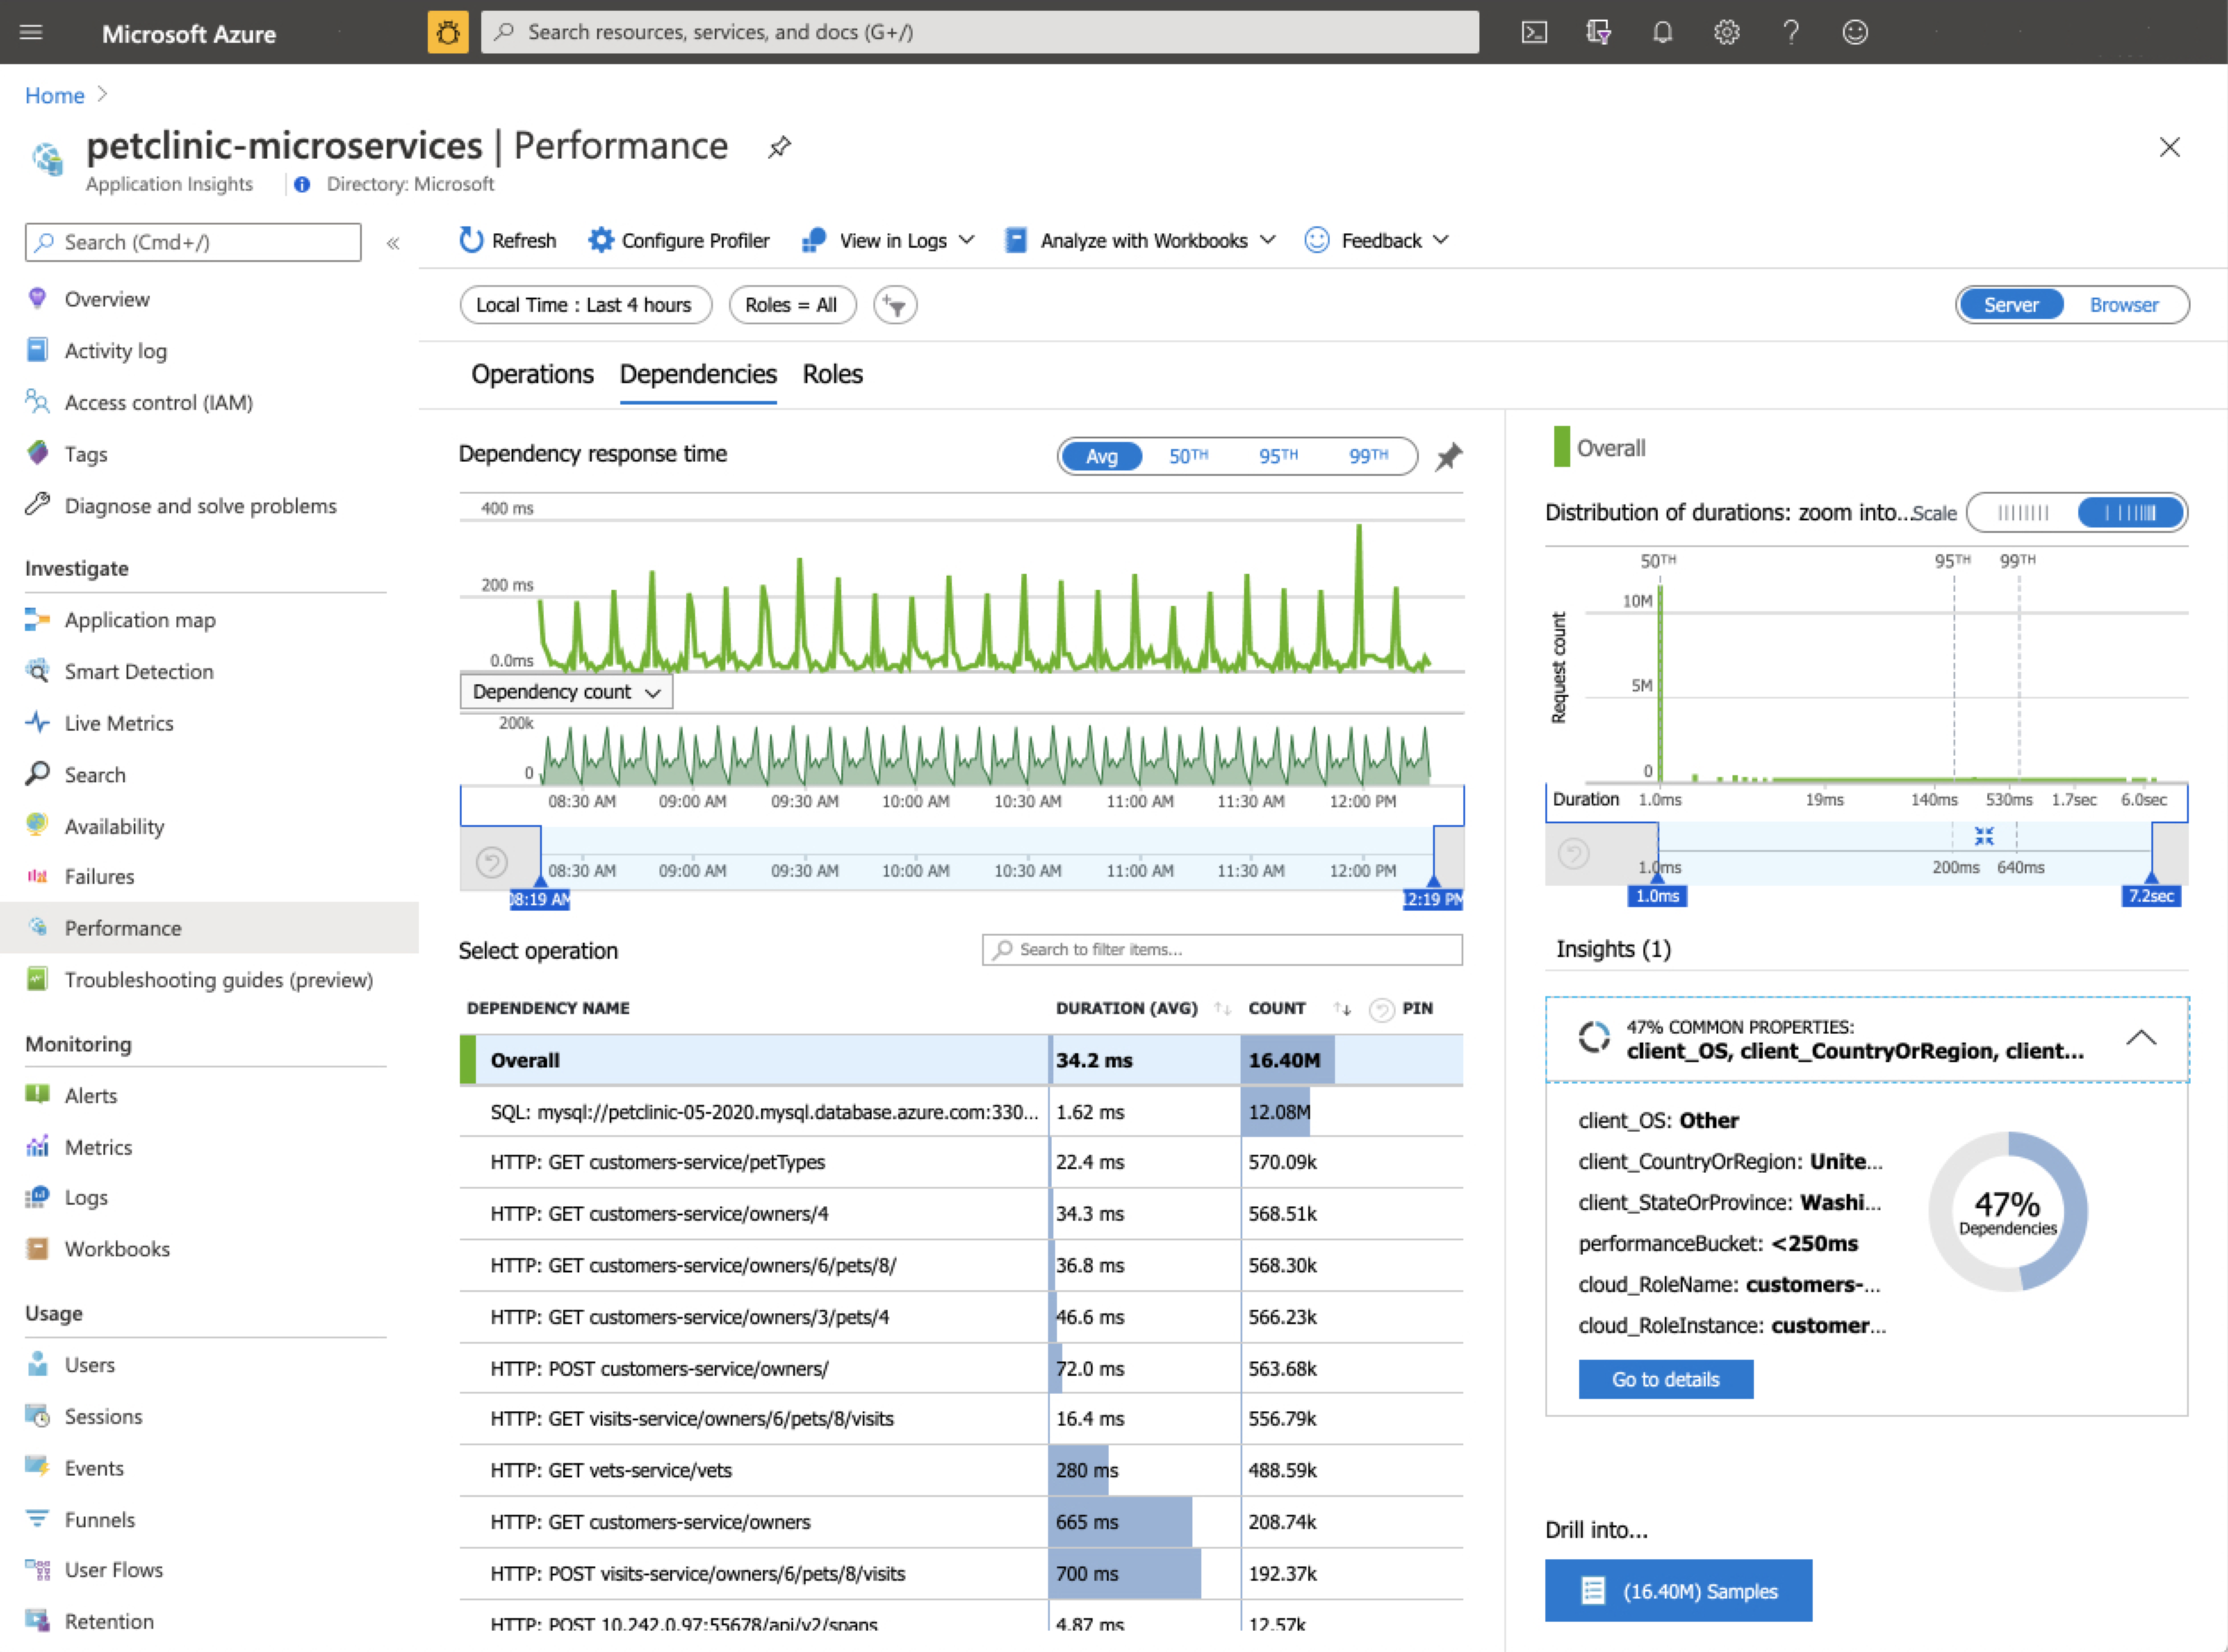
In the navigation pane, select Performance to see the performance data of all applications' operations, dependencies, and roles.
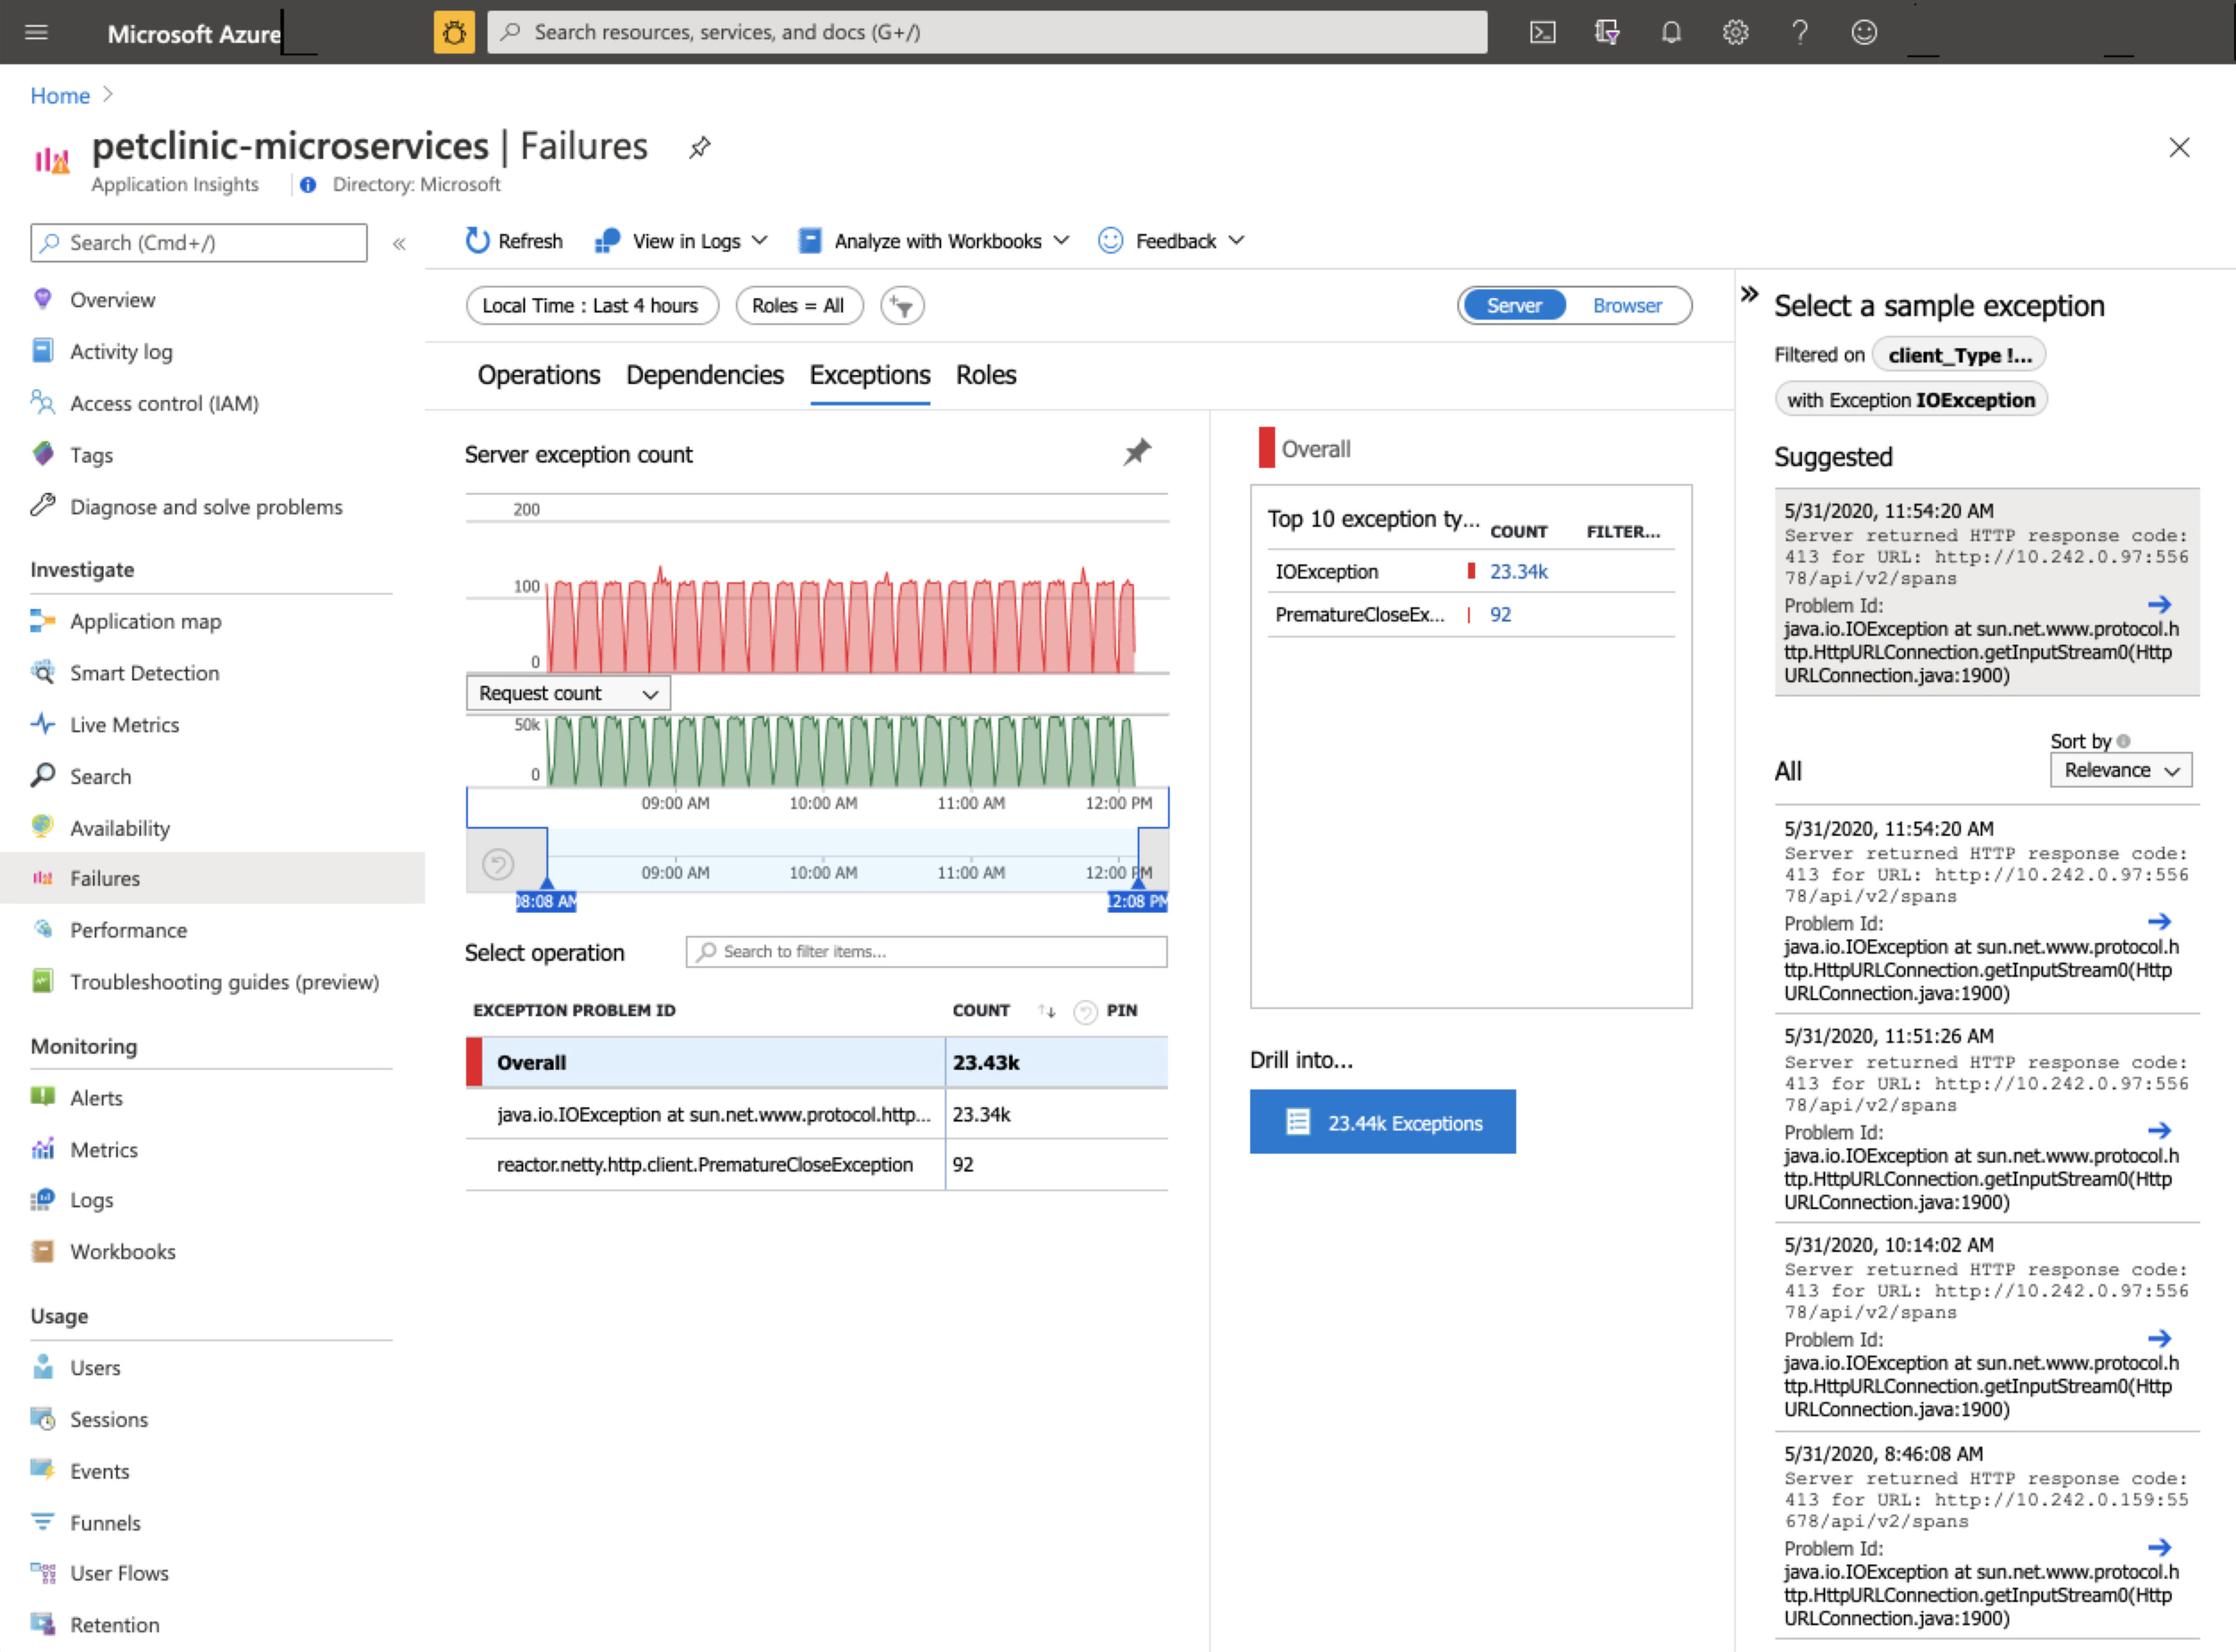
In the navigation pane, select Failures to see any unexpected failures or exceptions from your applications.
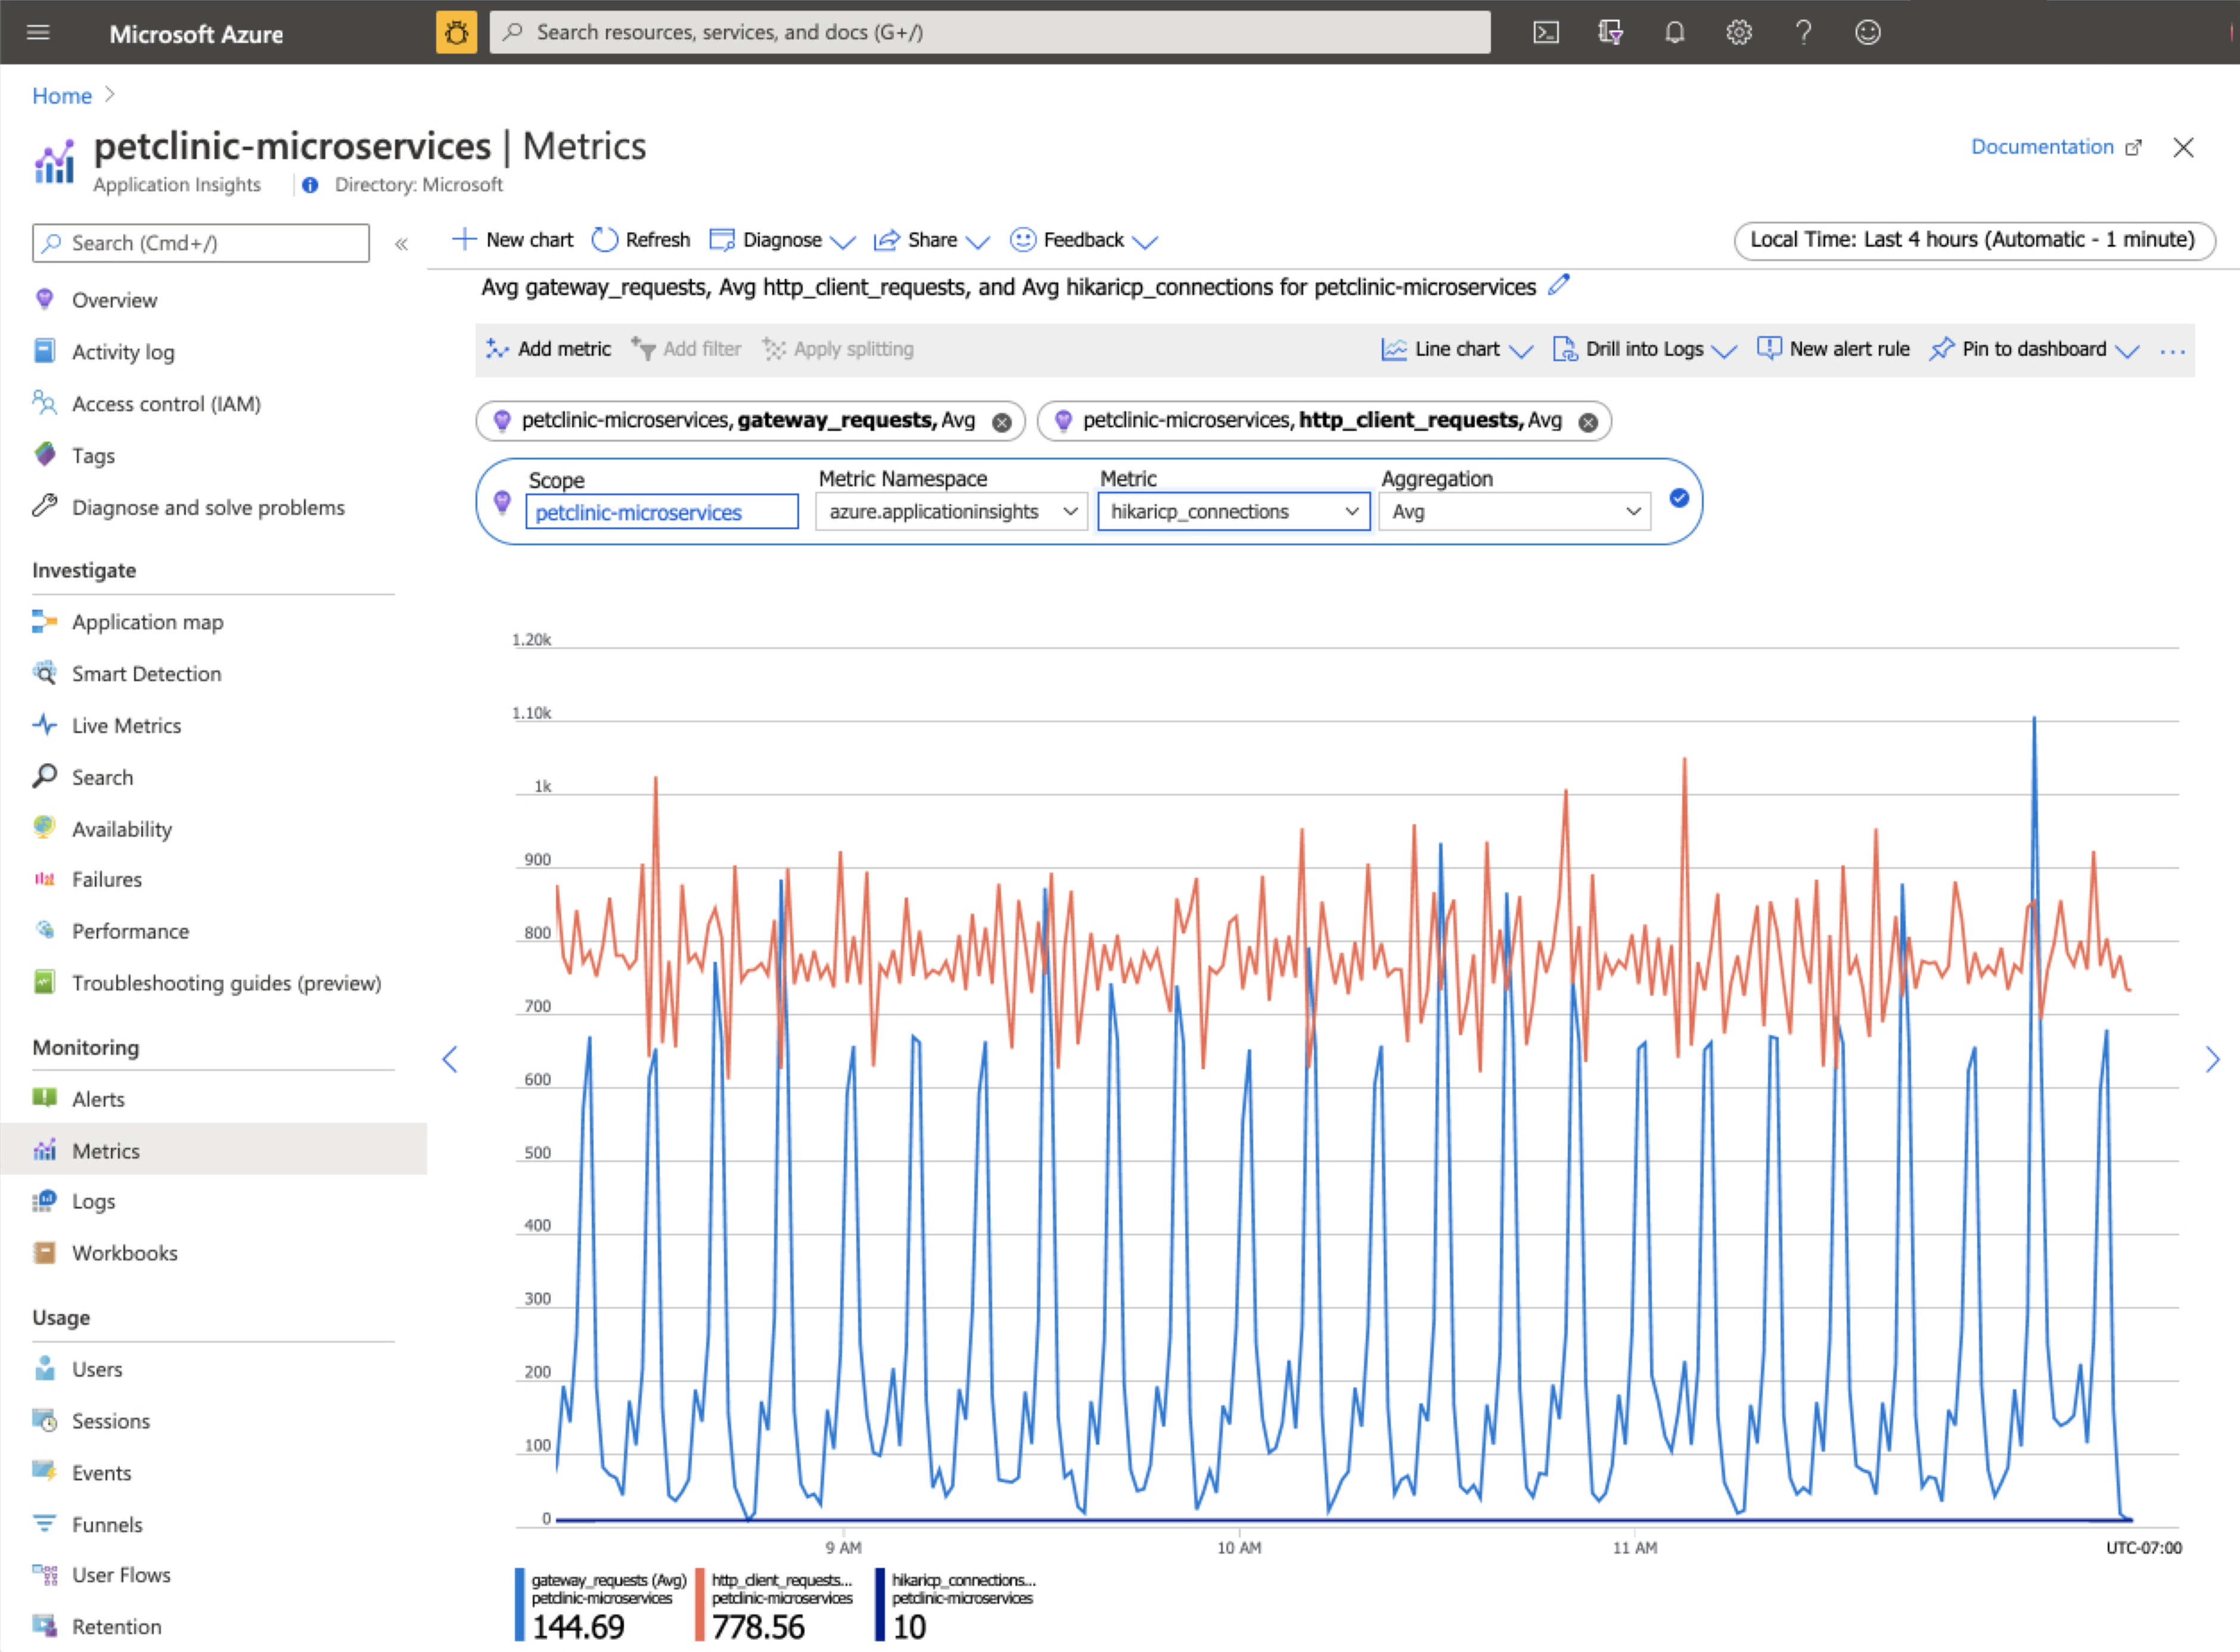
In the navigation pane, select Metrics and select the namespace to see both Spring Boot metrics and custom metrics, if any.
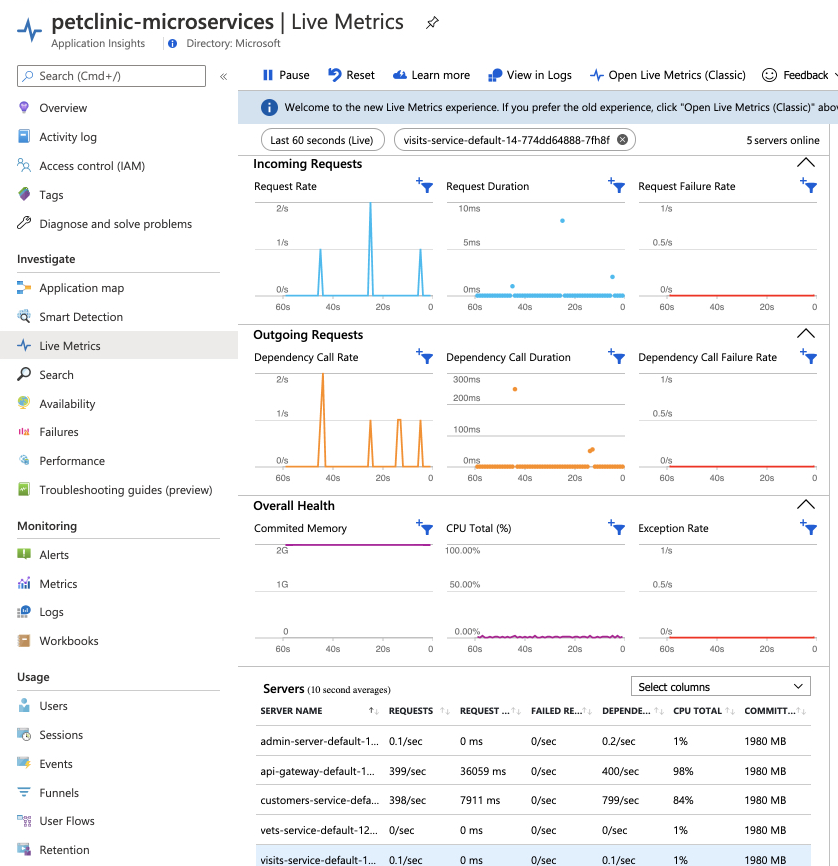
In the navigation pane, select Live Metrics to see the real-time metrics for different dimensions.
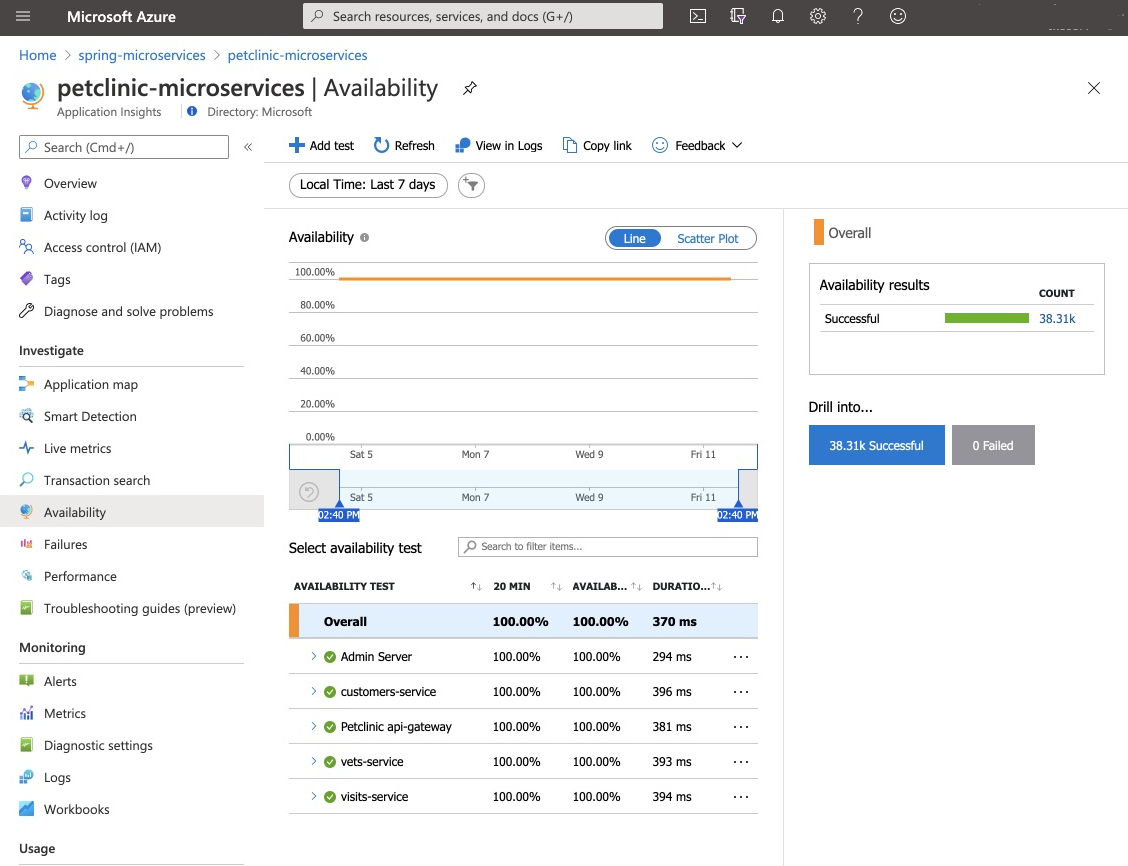
In the navigation pane, select Availability to monitor the availability and responsiveness of Web apps by creating Availability tests in Application Insights.
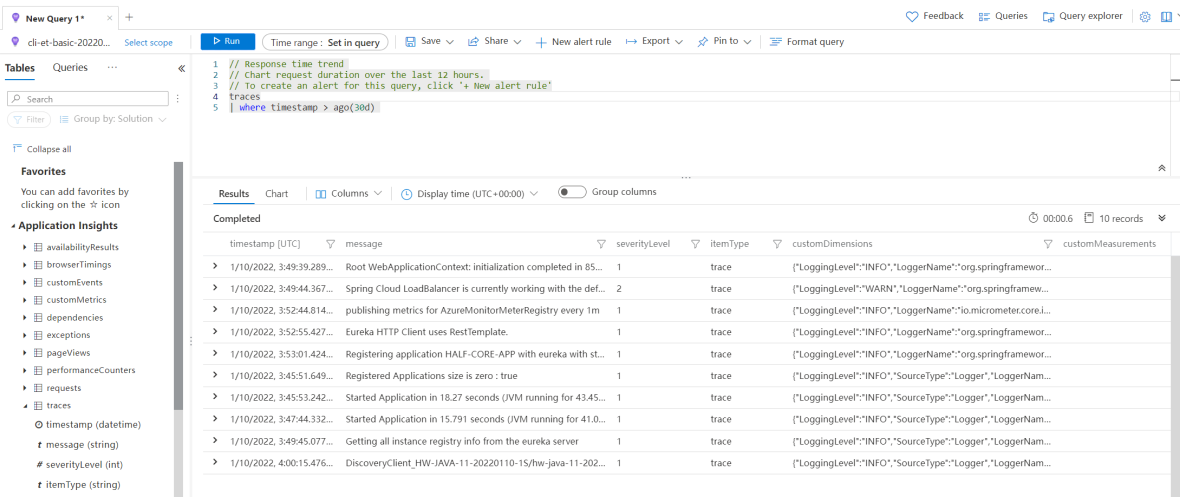
In the navigation pane, select Logs to view all applications' logs, or one application's logs when filtering by cloud_RoleName.


Manage Application Insights using the Azure portal
Enable the Java In-Process Agent by using the following procedure.
Go to the service | Overview page of your service instance and then select Application Insights in the Monitoring section.
Select Enable Application Insights to enable Application Insights in Azure Spring Apps.
Select an existing instance of Application Insights or create a new one.
When Application Insights is enabled, you can configure one optional sampling rate (default 10.0%).
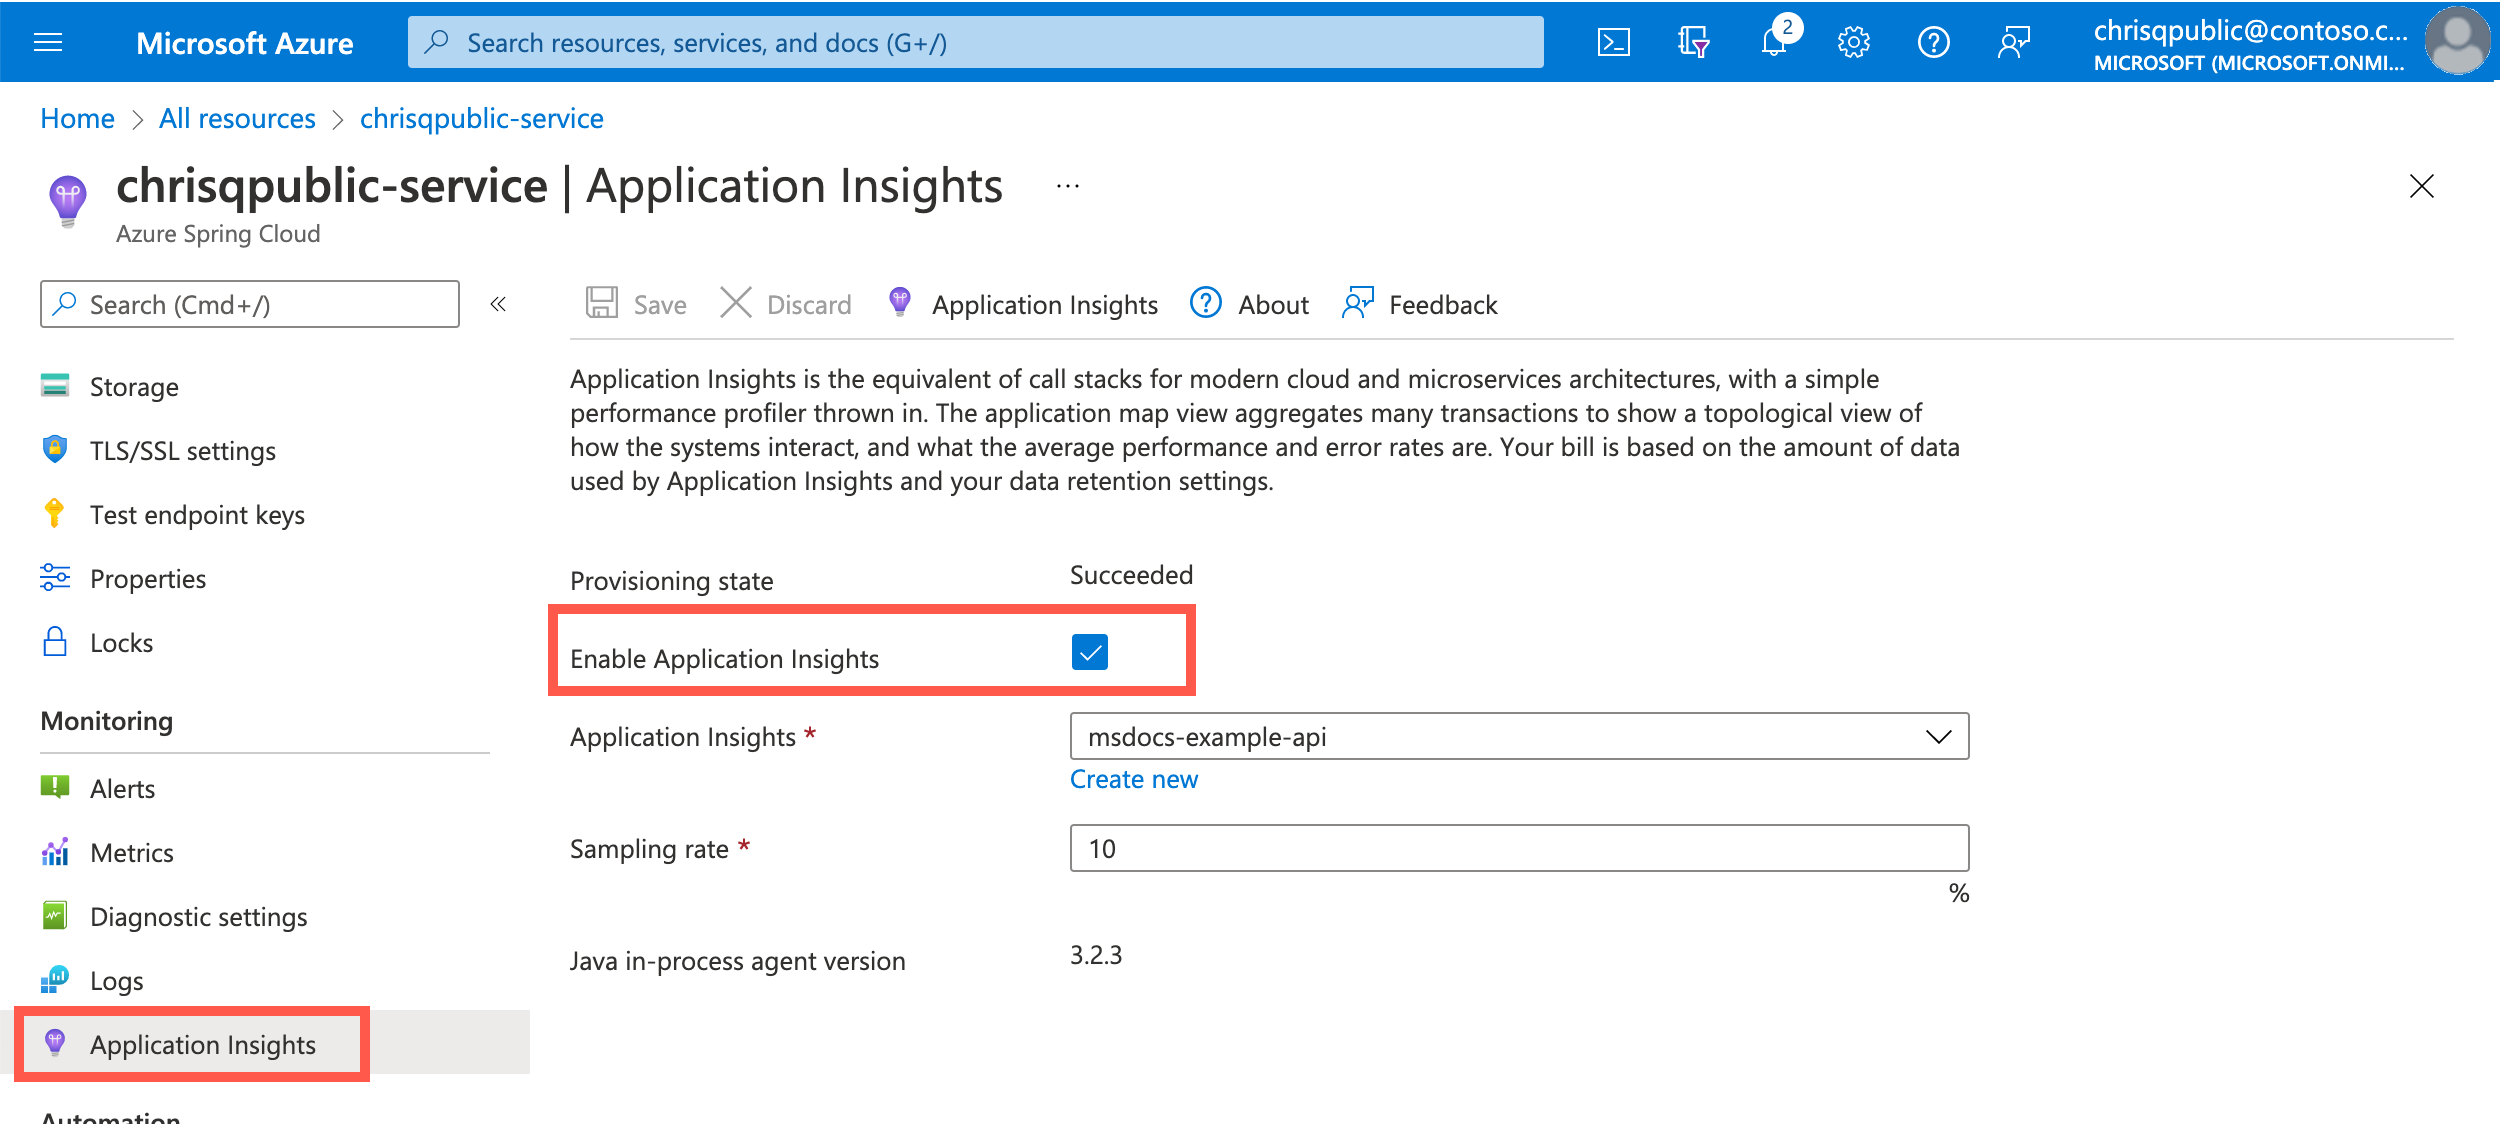
Select Save to save the change.

Note
Don't use the same Application Insights instance in different Azure Spring Apps instances, or you're shown mixed data.
You can use the Portal to check or update the current settings in Application Insights.
Enable Application Insights using the Azure portal
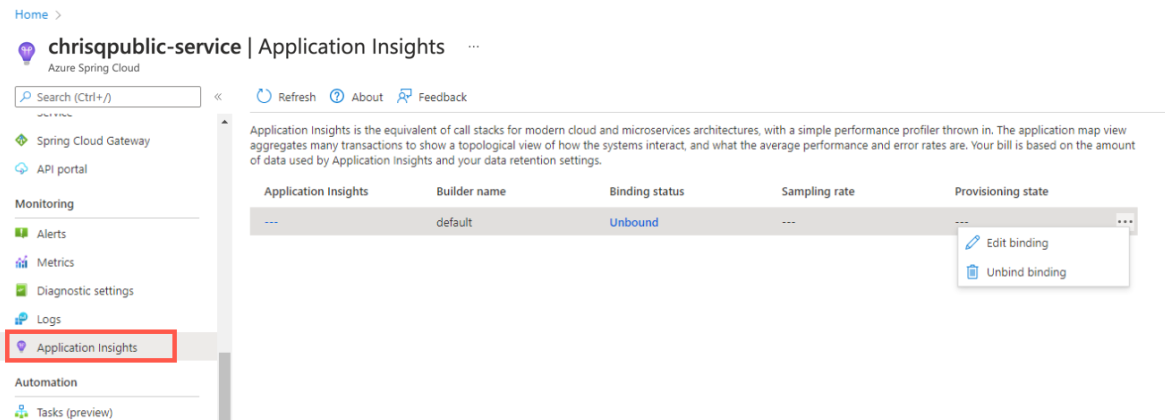
Select Application Insights.
Enable Application Insights by selecting Edit binding, or the Unbound hyperlink.
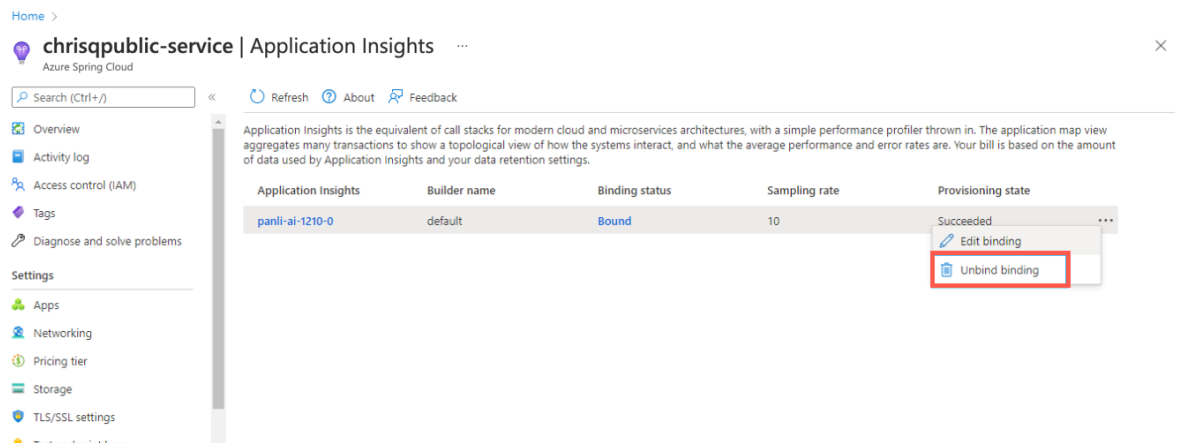
Edit Application Insights or Sampling rate, then select Save.
Disable Application Insights
Select Application Insights.
Select Unbind binding to disable Application Insights.
Change Application Insights Settings
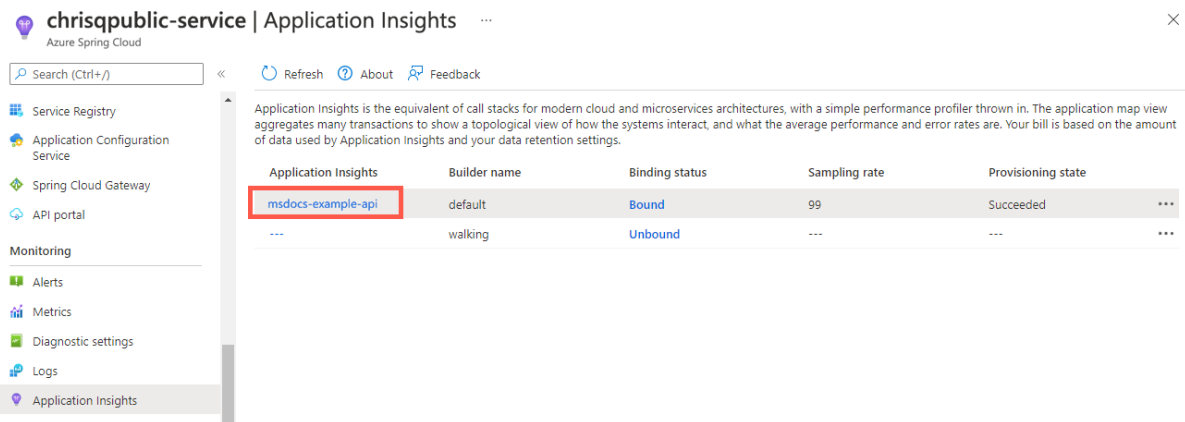
Select the name under the Application Insights column to open the Application Insights section.
Edit Application Insights buildpack bindings in Build Service
To check and update the current settings for the Application Insights buildpack bindings in Build Service, follow these steps:
- Select Build Service.
- Choose your builder.
- Select Edit under the Bindings column.
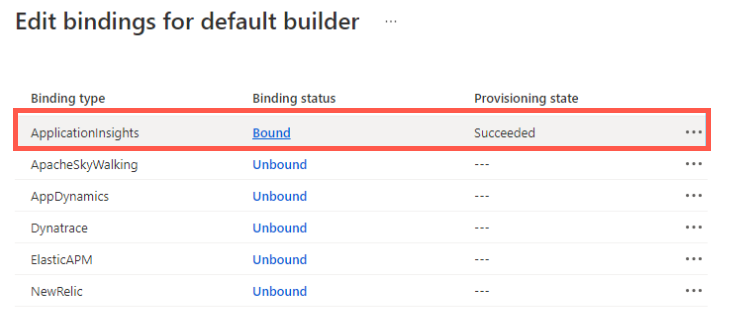
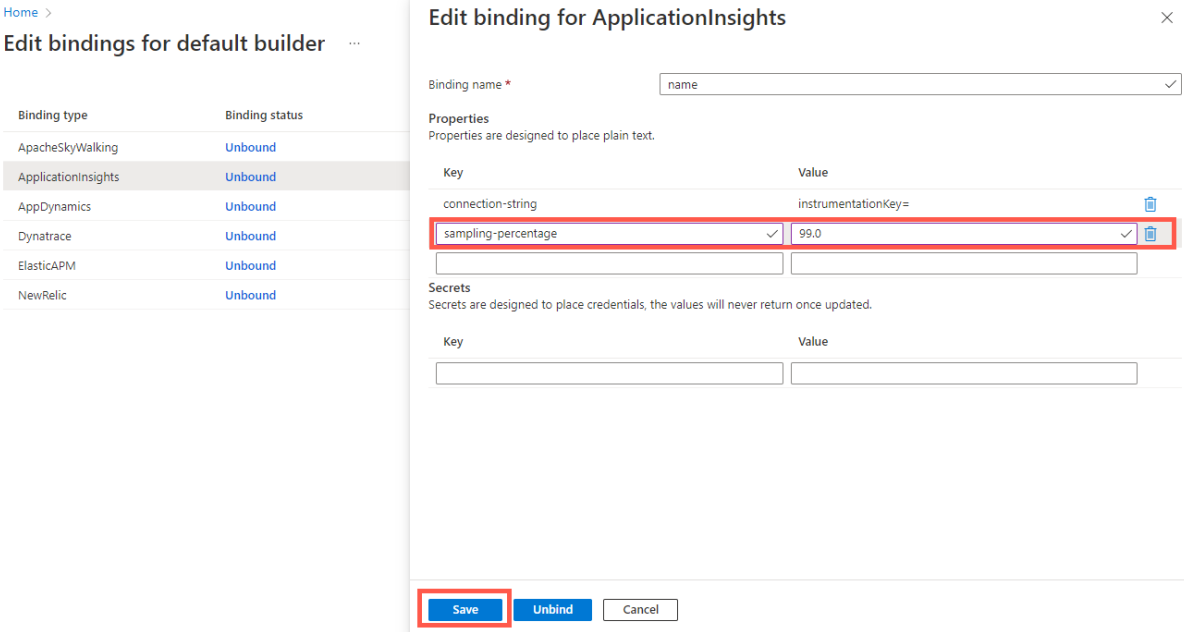
Application Insights settings are found in the ApplicationInsights item listed under the Binding type column.
Select the Bound hyperlink, or select Edit Binding under the ellipse, to open and edit the Application Insights buildpack bindings.
Edit the binding settings, then select Save.
Manage Application Insights using Azure CLI
You can manage Application Insights using Azure CLI commands. In the following commands, be sure to replace the <placeholder> text with the values described. The <service-instance-name> placeholder refers to the name of your Azure Spring Apps instance.
Enable Application Insights
To configure Application Insights when creating an Azure Spring Apps instance, use the following command. For the app-insights argument, you can specify an Application Insights name or resource ID.
az spring create \
    --resource-group <resource-group-name> \
    --name "service-instance-name" \
    --app-insights <name-or-resource-ID> \
    --sampling-rate <sampling-rate>
az spring create \
    --resource-group <resource-group-name> \
    --name "service-instance-name" \
    --app-insights <name-or-resource-ID> \
    --sampling-rate <sampling-rate> \
    --sku Enterprise
You can also use an Application Insights connection string (preferred) or instrumentation key, as shown in the following example.
az spring create \
    --resource-group <resource-group-name> \
    --name <service-instance-name> \
    --app-insights-key <connection-string-or-instrumentation-key> \
    --sampling-rate <sampling-rate>
az spring create \
    --resource-group <resource-group-name> \
    --name <service-instance-name> \
    --app-insights-key <connection-string-or-instrumentation-key> \
    --sampling-rate <sampling-rate> \
    --sku Enterprise
Disable Application Insights
To disable Application Insights when creating an Azure Spring Apps instance, use the following command:
az spring create \
    --resource-group <resource-group-name> \
    --name <service-instance-name> \
    --disable-app-insights
az spring create \
    --resource-group <resource-group-name> \
    --name <service-instance-name> \
    --disable-app-insights \
    --sku Enterprise
Check Application Insights settings
To check the Application Insights settings of an existing Azure Spring Apps instance, use the following command:
az spring app-insights show \
    --resource-group <resource-group-name> \
    --name <service-instance-name>
Update Application Insights
To update Application Insights to use a connection string (preferred) or instrumentation key, use the following command:
az spring app-insights update \
    --resource-group <resource-group-name> \
    --name <service-instance-name> \
    --app-insights-key <connection-string-or-instrumentation-key> \
    --sampling-rate <sampling-rate>
To update Application Insights to use the resource name or ID, use the following command:
az spring app-insights update \
    --resource-group <resource-group-name> \
    --name <service-instance-name> \
    --app-insights <name-or-resource-ID> \
    --sampling-rate <sampling-rate>
Disable Application Insights with the update command
To disable Application Insights on an existing Azure Spring Apps instance, use the following command:
az spring app-insights update \
    --resource-group <resource-group-name> \
    --name <service-instance-name> \
    --disable
Manage Application Insights buildpack bindings
This section applies to the Enterprise plan only, and provides instructions that supplement the previous section.
The Azure Spring Apps Enterprise plan uses buildpack bindings to integrate Azure Application Insights with the type ApplicationInsights. For more information, see How to configure APM integration and CA certificates.
To create an Application Insights buildpack binding, use the following command:
az spring build-service builder buildpack-binding create \
    --resource-group <your-resource-group-name> \
    --service <your-service-instance-name> \
    --name <your-binding-name> \
    --builder-name <your-builder-name> \
    --type ApplicationInsights \
    --properties sampling-percentage=<your-sampling-percentage> \
                 connection-string=<your-connection-string>
To list all buildpack bindings, and find Application Insights bindings the type ApplicationInsights, use the following command:
az spring build-service builder buildpack-binding list \
    --resource-group <your-resource-group-name> \
    --service <your-service-resource-name> \
    --builder-name <your-builder-name>
To replace an Application Insights buildpack binding, use the following command:
az spring build-service builder buildpack-binding set \
    --resource-group <your-resource-group-name> \
    --service <your-service-instance-name> \
    --name <your-binding-name> \
    --builder-name <your-builder-name> \
    --type ApplicationInsights \
    --properties sampling-percentage=<your-sampling-percentage> \
                 connection-string=<your-connection-string>
To get an Application Insights buildpack binding, use the following command:
az spring build-service builder buildpack-binding show \
    --resource-group <your-resource-group-name> \
    --service <your-service-instance-name> \
    --name <your-binding-name> \
    --builder-name <your-builder-name>
To delete an Application Insights buildpack binding, use the following command:
az spring build-service builder buildpack-binding delete \
    --resource-group <your-resource-group-name> \
    --service <your-service-instance-name> \
    --name <your-binding-name> \
    --builder-name <your-builder-name>
Automation
The following sections describe how to automate your deployment using Bicep, Azure Resource Manager templates (ARM templates) or Terraform.
Bicep
To deploy using a Bicep file, copy the following content into a main.bicep file. For more information, see Microsoft.AppPlatform Spring/monitoringSettings.
param springName string
param location string = resourceGroup().location

resource spring 'Microsoft.AppPlatform/Spring@2020-07-01' = {
  name: springName
  location: location
  properties: {}
}

resource monitorSetting 'Microsoft.AppPlatform/Spring/monitoringSettings@2020-11-01-preview' = {
  parent: spring
  name: 'default'
  properties: {
    appInsightsInstrumentationKey: '00000000-0000-0000-0000-000000000000'
    appInsightsSamplingRate: 88
  }
}
ARM templates
To deploy using an ARM template, copy the following content into an azuredeploy.json file. For more information, see Microsoft.AppPlatform Spring/monitoringSettings.
{
  "$schema": "https://schema.management.azure.com/schemas/2019-04-01/deploymentTemplate.json#",
  "contentVersion": "1.0.0.0",
  "parameters": {
    "springName": {
      "type": "string"
    },
    "location": {
      "type": "string",
      "defaultValue": "[resourceGroup().location]"
    }
  },
  "resources": [
    {
      "type": "Microsoft.AppPlatform/Spring",
      "apiVersion": "2020-07-01",
      "name": "[parameters('springName')]",
      "location": "[parameters('location')]",
      "properties": {}
    },
    {
      "type": "Microsoft.AppPlatform/Spring/monitoringSettings",
      "apiVersion": "2020-11-01-preview",
      "name": "[format('{0}/{1}', parameters('springName'), 'default')]",
      "properties": {
        "appInsightsInstrumentationKey": "00000000-0000-0000-0000-000000000000",
        "appInsightsSamplingRate": 88
      },
      "dependsOn": [
        "[resourceId('Microsoft.AppPlatform/Spring', parameters('springName'))]"
      ]
    }
  ]
}
Terraform
For a Terraform deployment, use the following template. For more information, see azurerm_spring_cloud_service.
provider "azurerm" {
  features {}
}

resource "azurerm_resource_group" "example" {
  name     = "example-resources"
  location = "West Europe"
}

resource "azurerm_application_insights" "example" {
  name                = "tf-test-appinsights"
  location            = azurerm_resource_group.example.location
  resource_group_name = azurerm_resource_group.example.name
  application_type    = "web"
}

resource "azurerm_spring_cloud_service" "example" {
  name                = "example-springcloud"
  resource_group_name = azurerm_resource_group.example.name
  location            = azurerm_resource_group.example.location
  sku_name            = "S0"

  config_server_git_setting {
    uri          = "https://github.com/Azure-Samples/piggymetrics"
    label        = "config"
    search_paths = ["dir1", "dir2"]
  }

  trace {
    connection_string = azurerm_application_insights.example.connection_string
    sample_rate       = 10.0
  }

  tags = {
    Env = "staging"
  }
}
Automation in the Enterprise plan is pending support. Documentation is added as soon as it's available.
Java agent update/upgrade
The Java agent is updated/upgraded regularly with the JDK, which may affect the following scenarios.
Note
The JDK version is updated/upgraded quarterly per year.
- Existing applications that use the Java agent before updating/upgrading aren't affected.
- Applications created after updating/upgrading use the new version of the Java agent.
- Existing applications that didn't previously use the Java agent require restart or redeployment to use the new version of the Java agent.
The Java agent is updated/upgraded when the buildpack is updated.
Java agent configuration hot-loading
Azure Spring Apps has a hot-loading mechanism to adjust the settings of agent configuration without restart of applications.
Note
The hot-loading mechanism has a delay in minutes.
If the Java agent is already enabled, changes to the Application Insights instance or
SamplingRatevalue don't require application restart.If you enable the Java agent, then you must restart applications.
When you disable the Java agent, applications stop sending all monitoring data after a delay in minutes. You can restart applications to remove the agent from the Java runtime environment.
Concept matching between Azure Spring Apps and Application Insights
| Azure Spring Apps | Application Insights |
|---|---|
App |
* Application Map/Role * Live Metrics/Role * Failures/Roles/Cloud Role * Performance/Roles/Could Role |
App Instance |
* Application Map/Role Instance * Live Metrics/Service Name * Failures/Roles/Cloud Instance * Performance/Roles/Could Instance |
The name App Instance from Azure Spring Apps is changed or generated in the following scenarios:
- You create a new application.
- You deploy a JAR file or source code to an existing application.
- You initiate a blue/green deployment.
- You restart the application.
- You stop the deployment of an application, and then restart it.
When data is stored in Application Insights, it contains the history of Azure Spring Apps app instances created or deployed since the Java agent was enabled. For example, in the Application Insights portal, you can see application data created yesterday, but then deleted within a specific time range, like the last 24 hours. The following scenarios show how this works:
- You created an application around 8:00 AM today from Azure Spring Apps with the Java agent enabled, and then you deployed a JAR file to this application around 8:10 AM today. After some testing, you change the code and deploy a new JAR file to this application at 8:30 AM today. Then, you take a break, and when you come back around 11:00 AM, you check some data from Application Insights. You see:
- Three instances in Application Map with time ranges in the last 24 hours, and Failures, Performance, and Metrics.
- One instance in Application Map with a time range in the last hour, and Failures, Performance, and Metrics.
- One instance in Live Metrics.
- You created an application around 8:00 AM today from Azure Spring Apps with the Java agent enabled, and then you deployed a JAR file to this application around 8:10 AM today. Around 8:30 AM today, you try a blue/green deployment with another JAR file. Currently, you have two deployments for this application. After a break around 11:00 AM today, you want to check some data from Application Insights. You see:
- Three instances in Application Map with time ranges in the last 24 hours, and Failures, Performance, and Metrics.
- Two instances in Application Map with time ranges in last hour, and Failures, Performance, and Metrics.
- Two instances in Live Metrics.