Analyze Stream Analytics job performance by using metrics and dimensions
To understand an Azure Stream Analytics job's health, it's important to know how to use the job's metrics and dimensions. You can use the Azure portal, the Visual Studio Code Stream Analytics extension, or an SDK to get the metrics and dimensions that you're interested in.
This article demonstrates how to use Stream Analytics job metrics and dimensions to analyze a job's performance through the Azure portal.
Watermark delay and backlogged input events are the main metrics to determine the performance of your Stream Analytics job. If your job's watermark delay is continuously increasing and input events are backlogged, your job can't keep up with the rate of input events and produce outputs in a timely manner.
Let's look at several examples to analyze a job's performance through the Watermark Delay metric data as a starting point.
No input for a certain partition increases job watermark delay
If your embarrassingly parallel job's watermark delay is steadily increasing, go to Metrics. Then use these steps to find out if the root cause is a lack of data in some partitions of your input source:
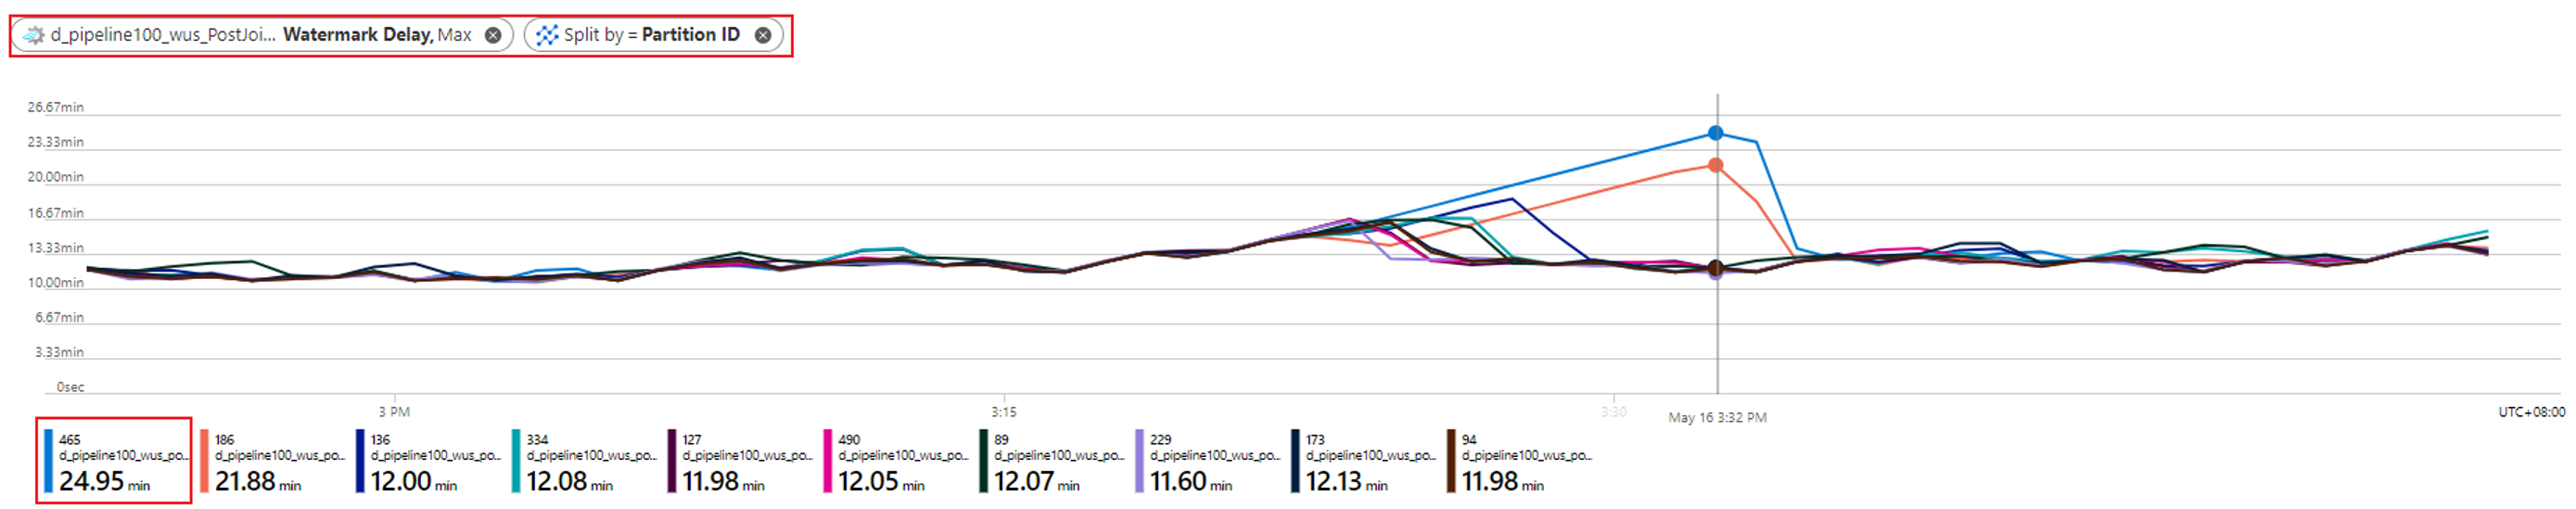
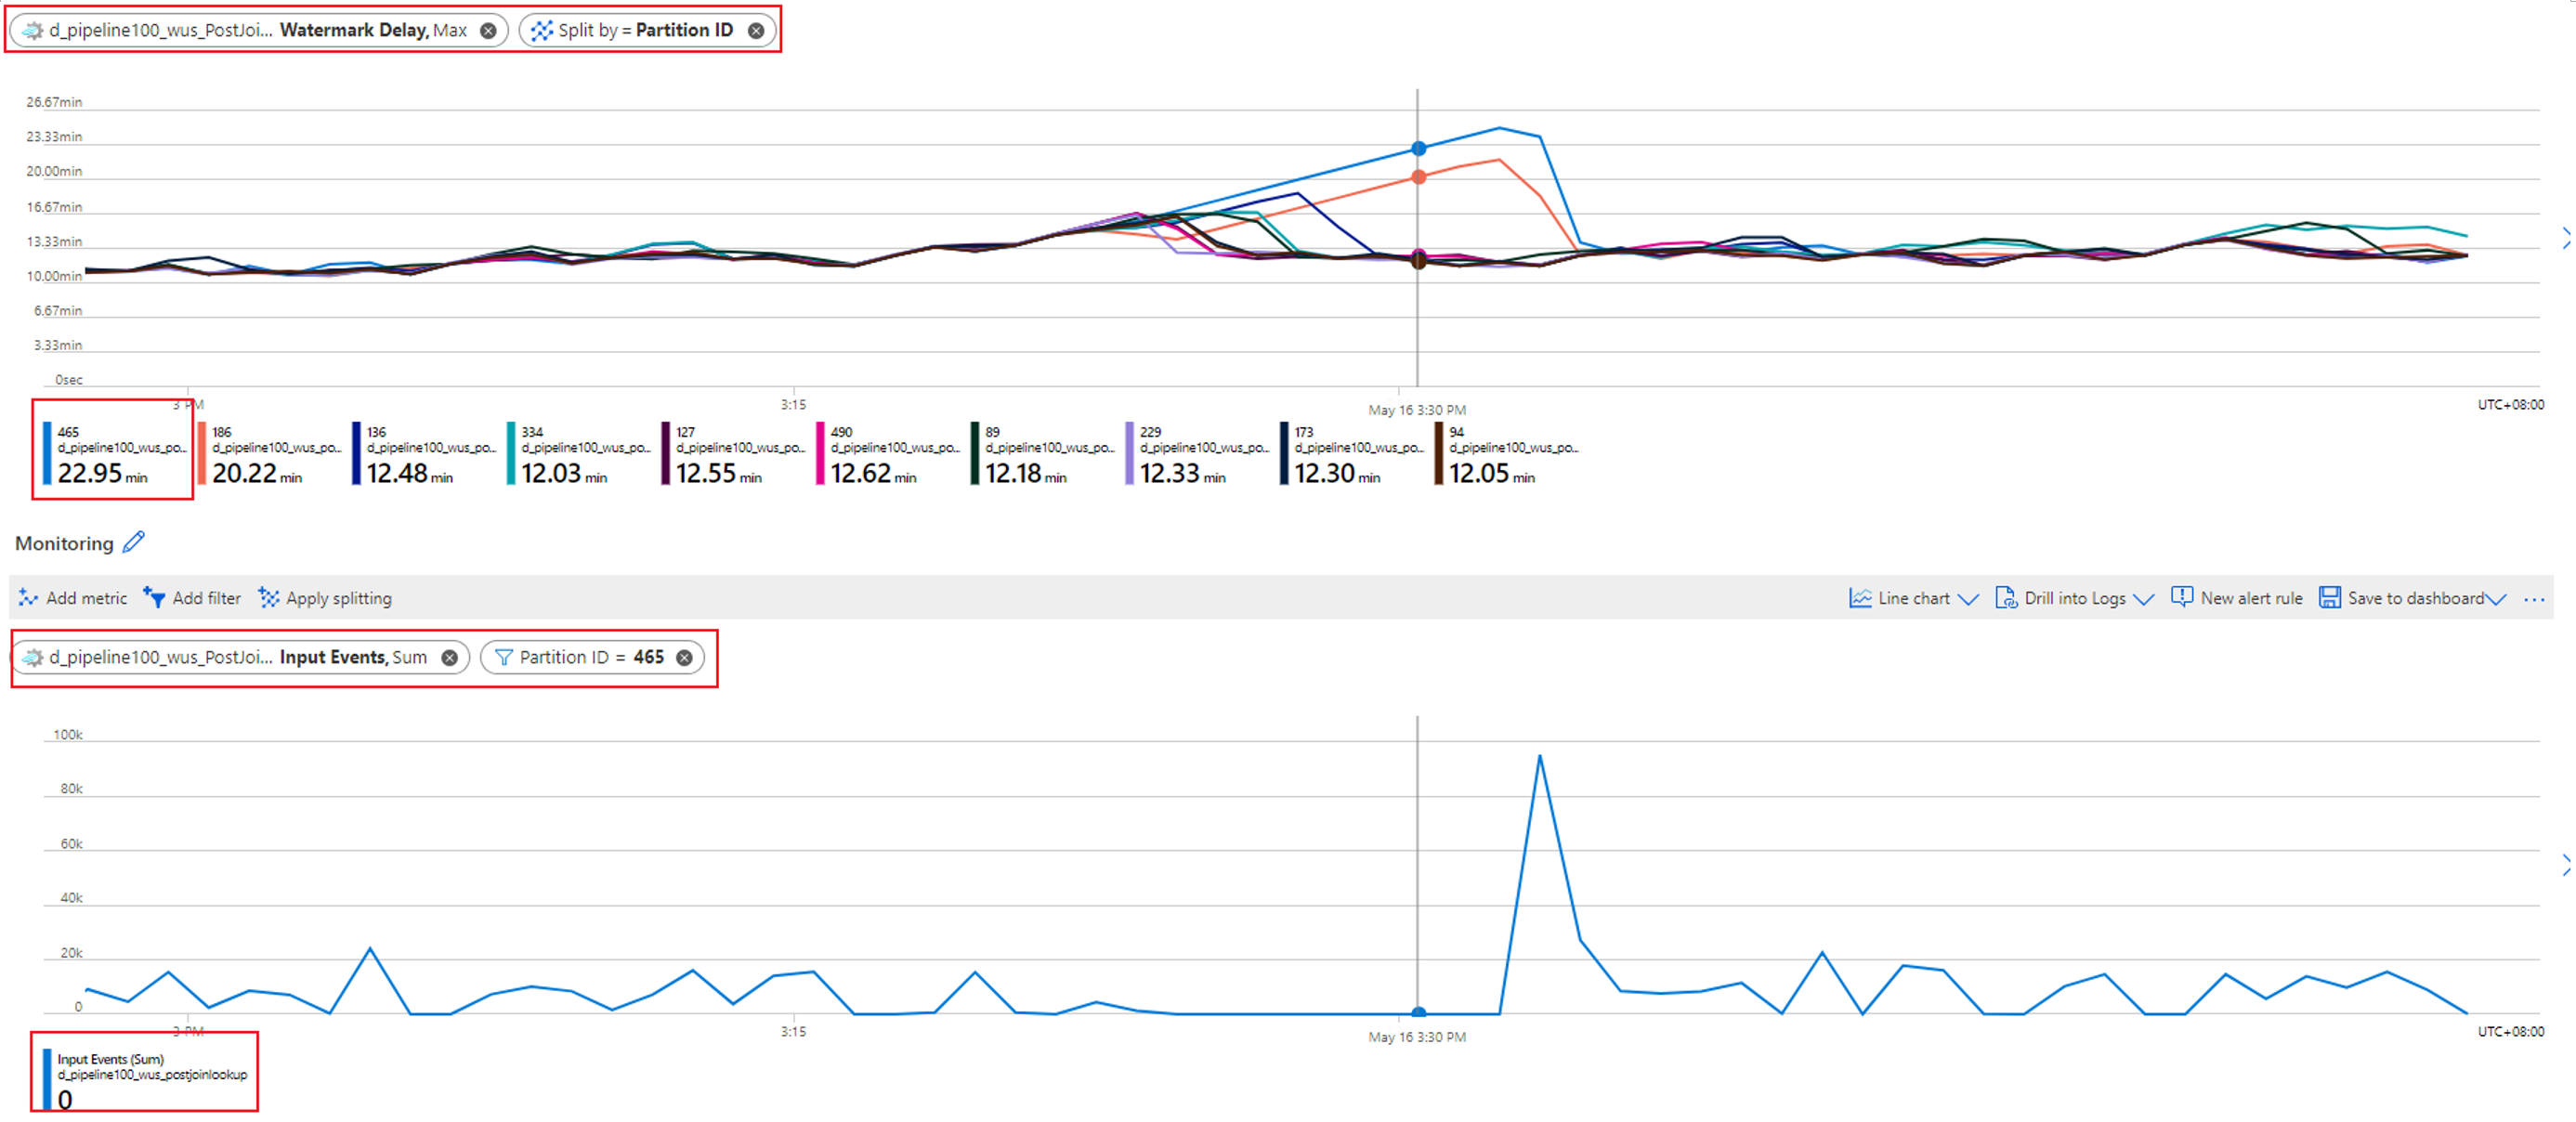
Check which partition has the increasing watermark delay. Select the Watermark Delay metric and split it by the Partition ID dimension. In the following example, partition 465 has a high watermark delay.
Check if any input data is missing for this partition. Select the Input Events metric and filter it to this specific partition ID.


What further action can you take?
The watermark delay for this partition is increasing because no input events are flowing into this partition. If your job's tolerance window for late arrivals is several hours and no input data is flowing into a partition, it's expected that the watermark delay for that partition will continue to increase until the late arrival window is reached.
For example, if your late arrival window is 6 hours and input data isn't flowing into input partition 1, the watermark delay for output partition 1 will increase until it reaches 6 hours. You can check if your input source is producing data as expected.
Input data skew causes a high watermark delay
As mentioned in the preceding case, when your embarrassingly parallel job has a high watermark delay, the first thing to do is to split the Watermark Delay metric by the Partition ID dimension. You can then identify whether all the partitions have high watermark delay, or just a few of them.
In the following example, partitions 0 and 1 have higher watermark delay (about 20 to 30 seconds) than the other eight partitions have. The other partitions' watermark delays are always steady at about 8 to 10 seconds.

Let's check what the input data looks like for all these partitions with the metric Input Events split by Partition ID:

What further action can you take?
As shown in the example, the partitions (0 and 1) that have a high watermark delay are receiving significantly more input data than other partitions are. We call this data skew. The streaming nodes that are processing the partitions with data skew need to consume more CPU and memory resources than others do, as shown in the following screenshot.

Streaming nodes that process partitions with higher data skew will exhibit higher CPU and/or streaming unit (SU) utilization. This utilization will affect the job's performance and increase watermark delay. To mitigate this, you need to repartition your input data more evenly.
You can also debug this issue with physical job diagram, see Physical job diagram: Identify the uneven distributed input events (data-skew).
Overloaded CPU or memory increases watermark delay
When an embarrassingly parallel job has an increasing watermark delay, it might happen on not just one or several partitions, but all of the partitions. How do you confirm that your job is falling into this case?
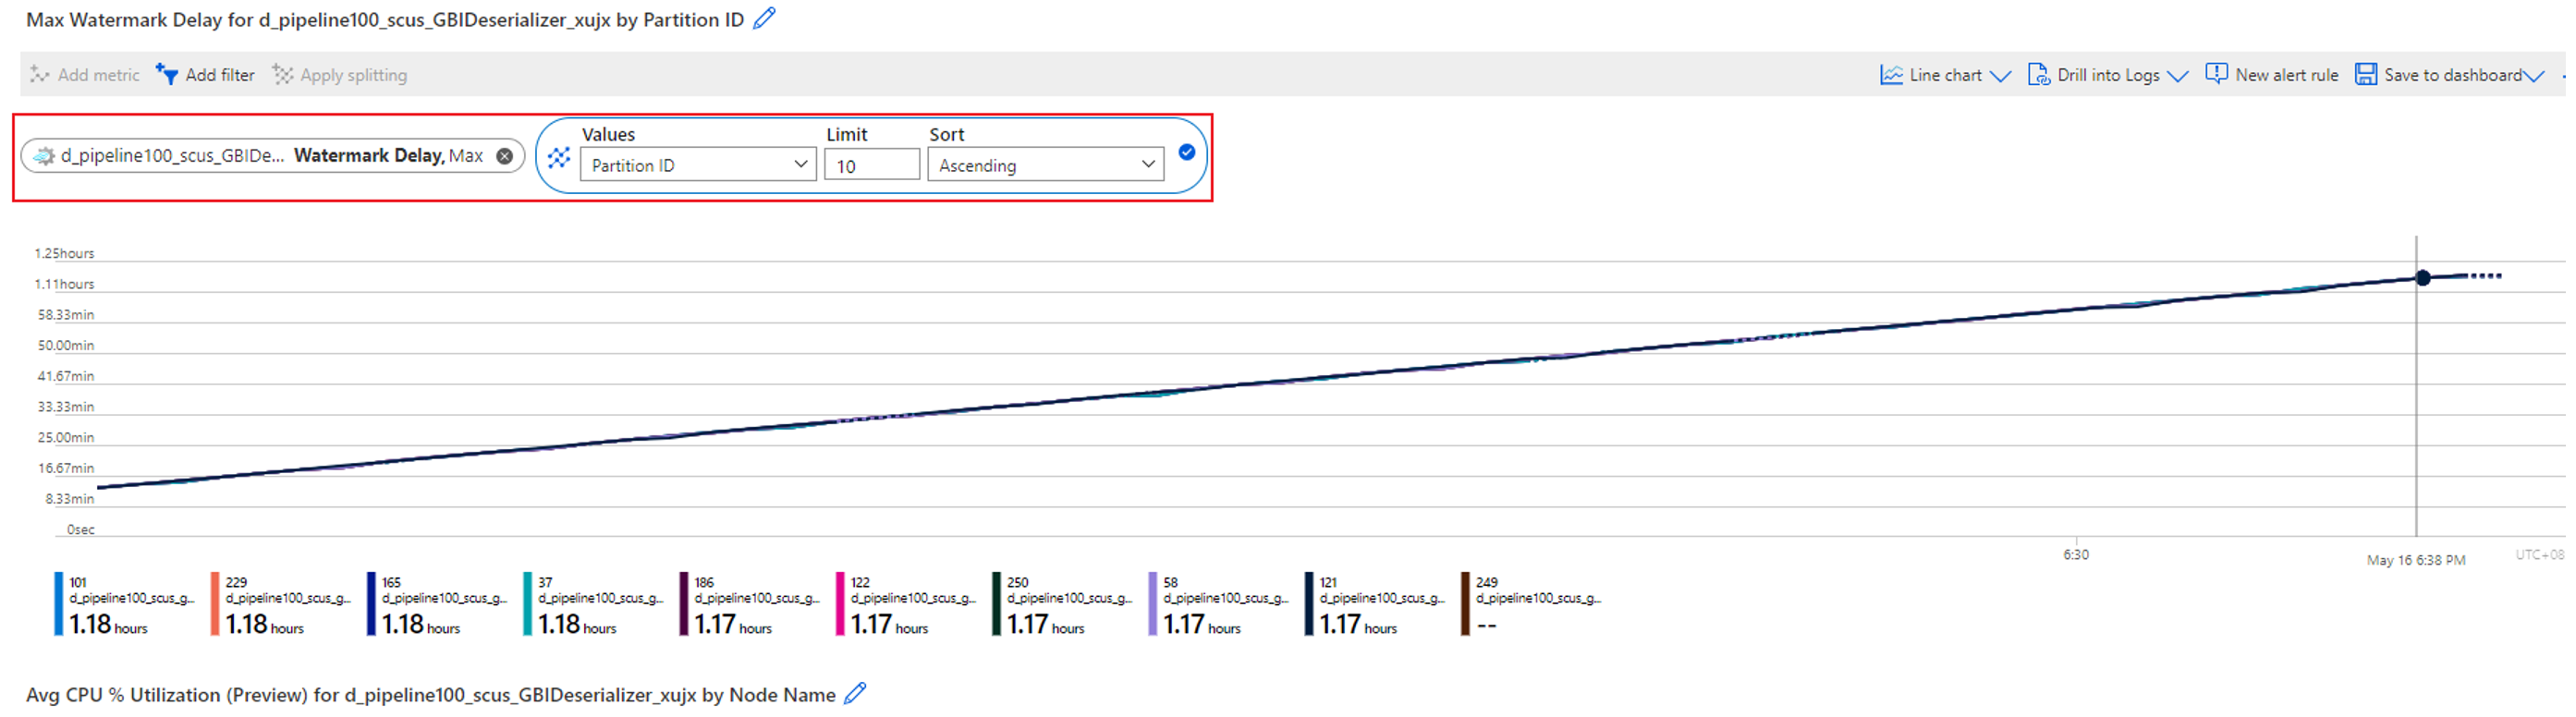
Split the Watermark Delay metric by Partition ID. For example:
Split the Input Events metric by Partition ID to confirm if there's data skew in input data for each partition.
Check the CPU and SU utilization to see if the utilization in all streaming nodes is too high.
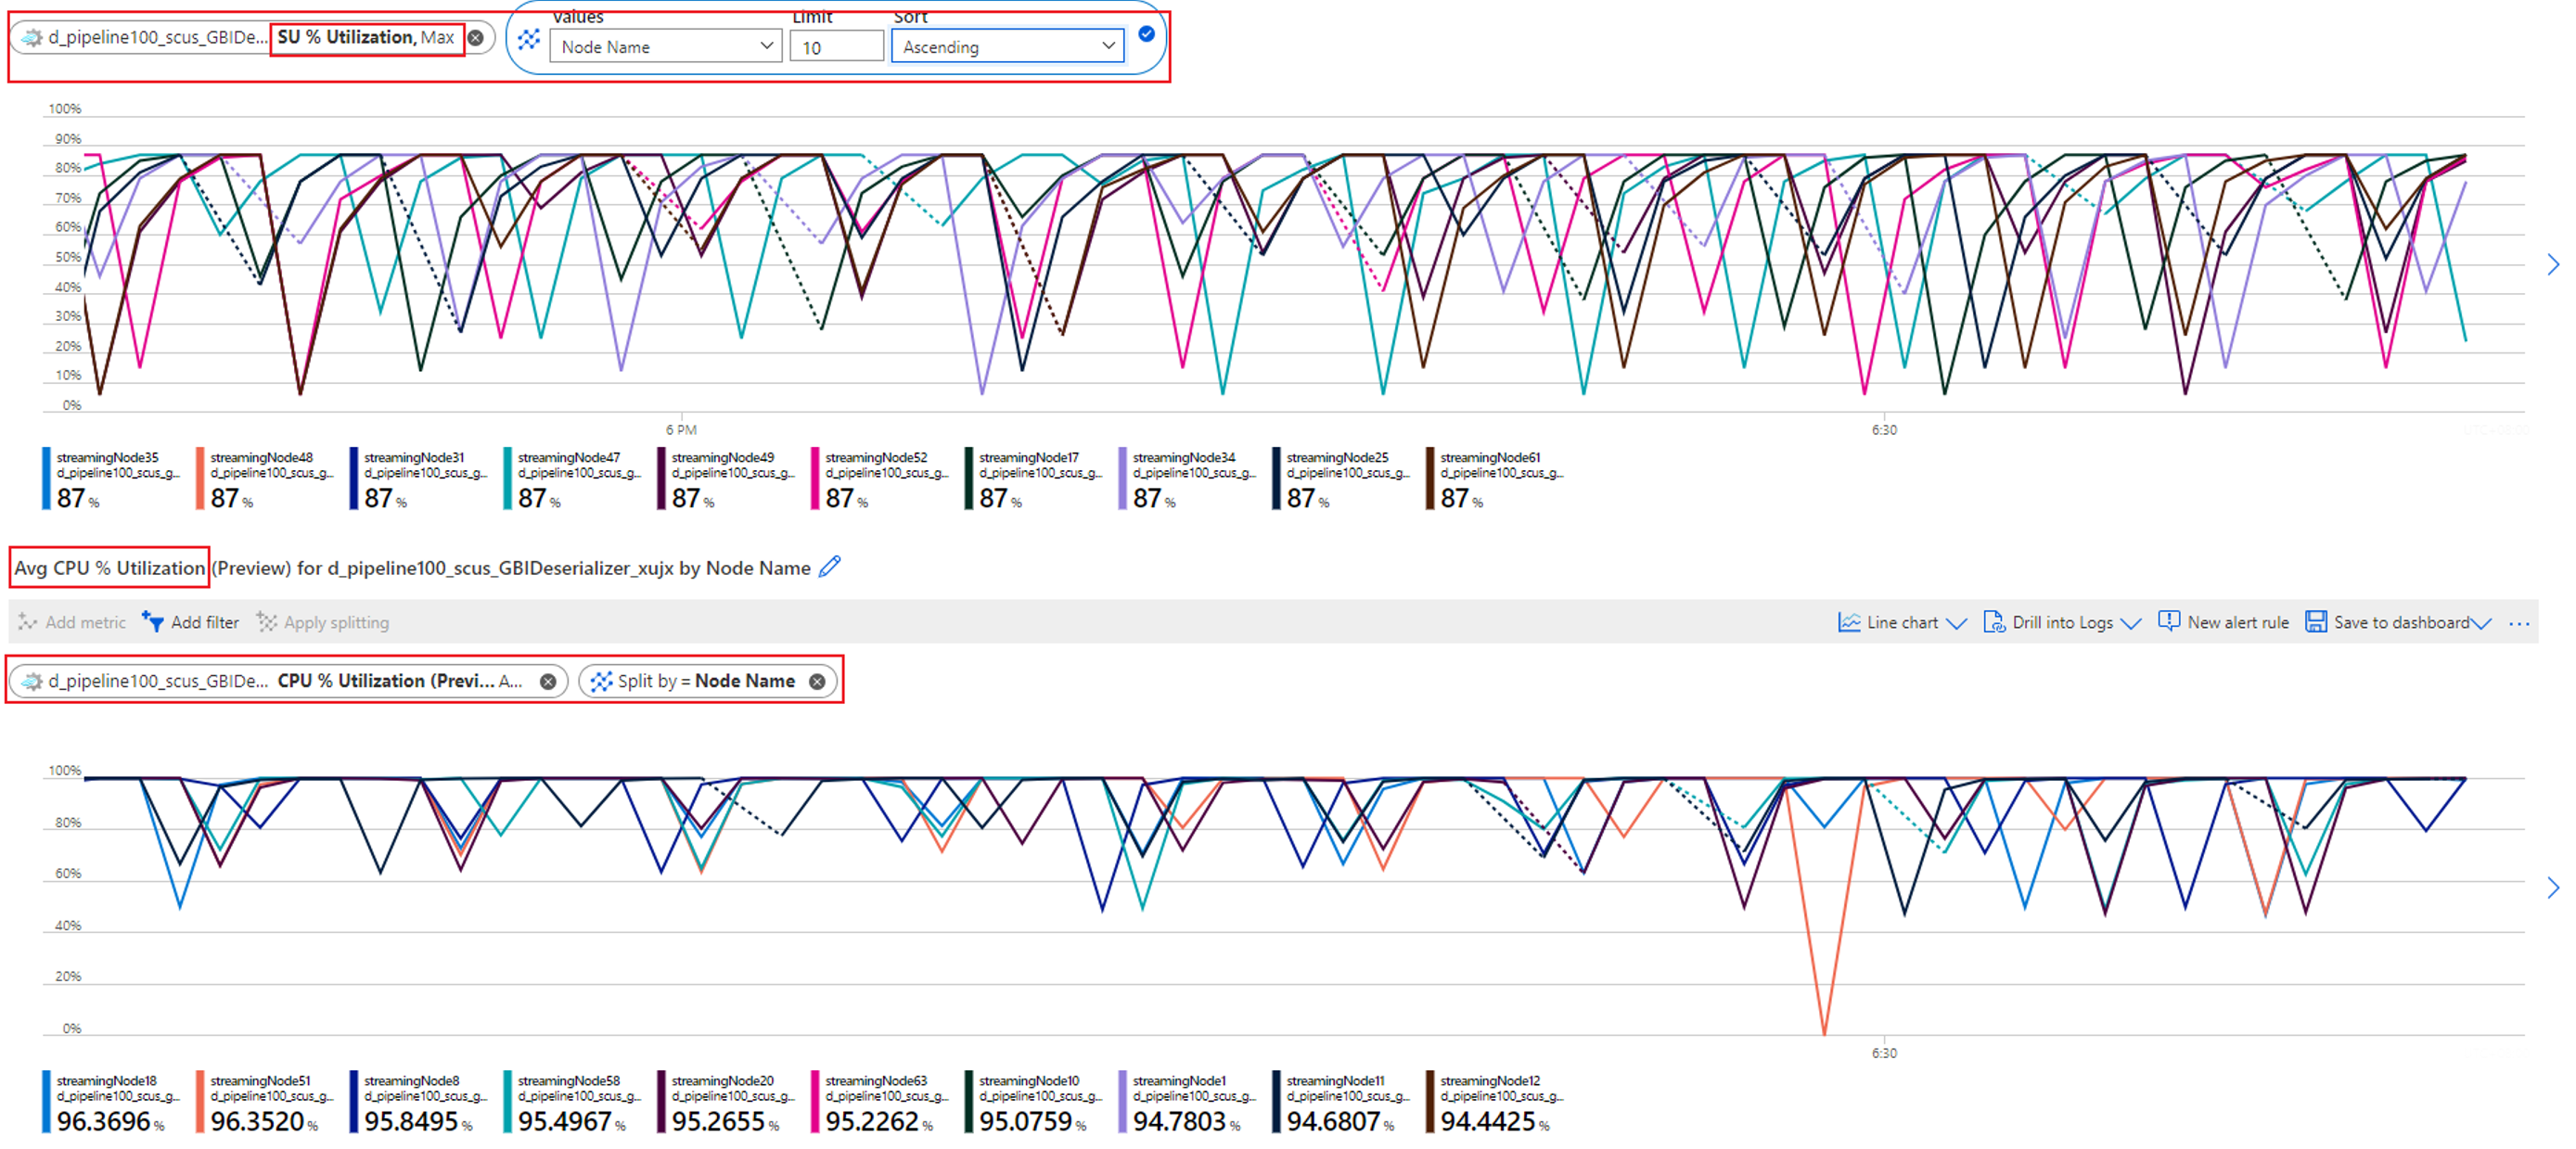
If the CPU and SU utilization is very high (more than 80 percent) in all streaming nodes, you can conclude that this job has a large amount of data being processed within each streaming node.
You can further check how many partitions are allocated to one streaming node by checking the Input Events metric. Filter by streaming node ID with the Node Name dimension, and split by Partition ID.
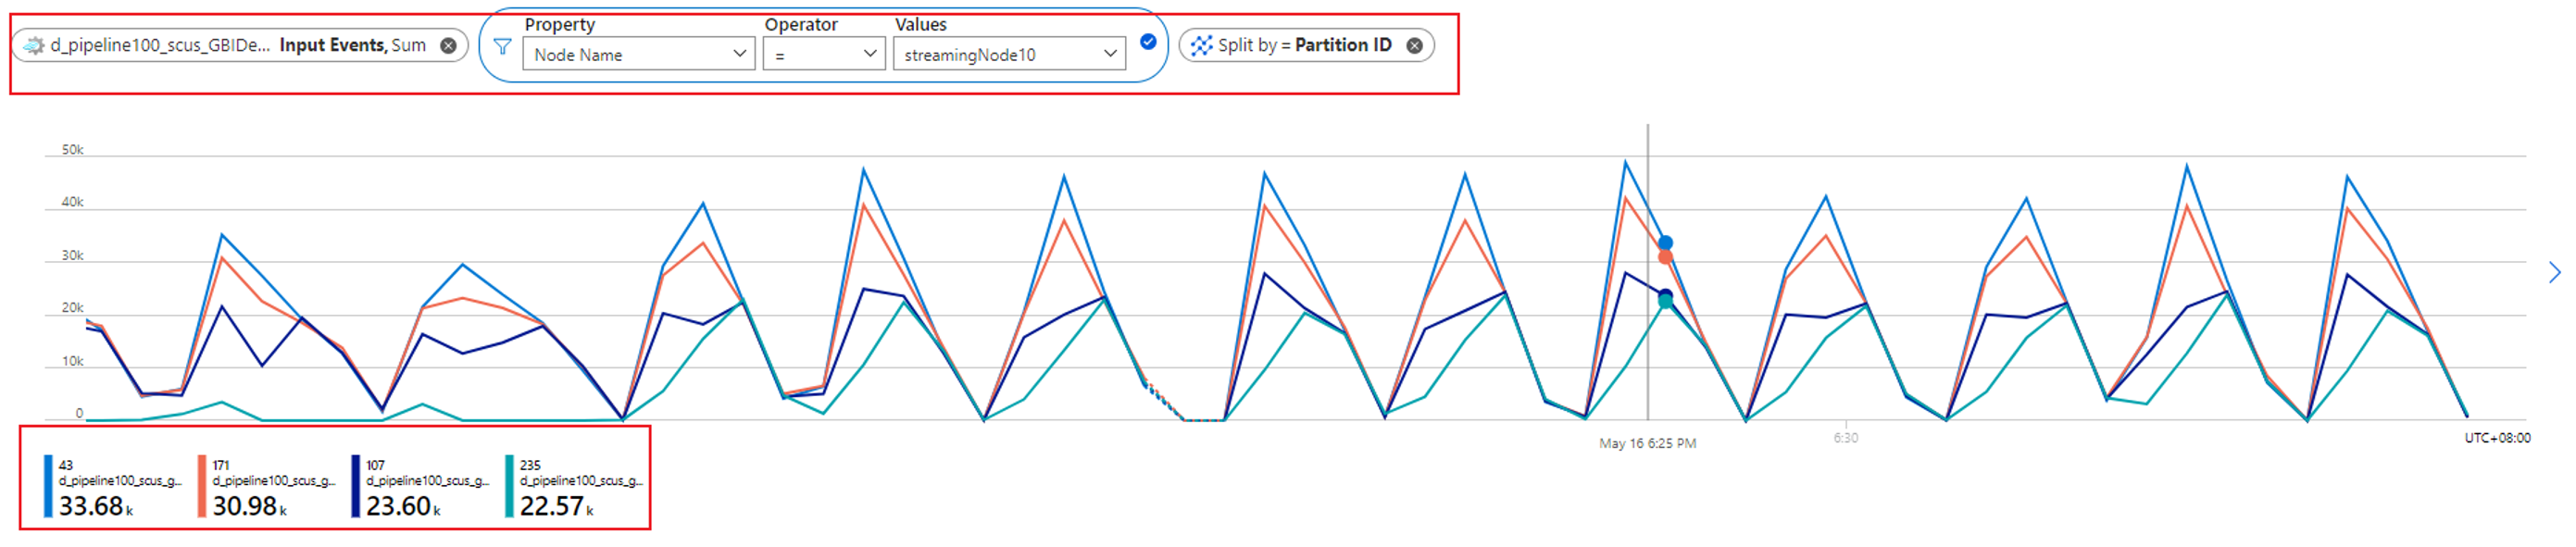
The preceding screenshot shows that four partitions are allocated to one streaming node that occupies about 90 to 100 percent of the streaming node resource. You can use a similar approach to check the rest of the streaming nodes to confirm that they're also processing data from four partitions.


What further action can you take?
You might want to reduce the partition count for each streaming node to reduce the input data for each streaming node. To achieve this, you can double the SUs to have each streaming node handle data from two partitions. Or you can quadruple the SUs to have each streaming node handle data from one partition. For information about the relationship between SU assignment and streaming node count, see Understand and adjust streaming units.
What should you do if the watermark delay is still increasing when one streaming node is handling data from one partition? Repartition your input with more partitions to reduce the amount of data in each partition. For details, see Use repartitioning to optimize Azure Stream Analytics jobs.
You can also debug this issue with physical job diagram, see Physical job diagram: Identify the cause of overloaded CPU or memory.