Note
Access to this page requires authorization. You can try signing in or changing directories.
Access to this page requires authorization. You can try changing directories.
The physical job diagram in the Azure portal can help you visualize your job's key metrics with streaming node in diagram or table format, for example: CPU utilization, memory utilization, Input Events, Partition IDs, and Watermark delay. It helps you to identify the cause of a problem when you troubleshoot issues.
This article demonstrates how to use physical job diagram to analyze a job's performance and quickly identify its bottleneck in Azure portal.
Important
This feature is currently in PREVIEW. See the Supplemental Terms of Use for Microsoft Azure Previews for legal terms that apply to Azure features that are in beta, preview, or otherwise not yet released into general availability.
Identify the parallelism of a job
Job with parallelization is the scalable scenario in Stream Analytics that can provide the better performance. If a job isn't in parallel mode, it most likely has certain bottleneck to its performance. It's important to identify if a job is in parallel mode or not. Physical job diagram provides a visual graph to illustrate the job parallelism. In physical job diagram, if there's data interaction among different streaming nodes, this job is a non-parallel job that needs more attention. For example, the non-parallel job diagram below:

You may consider to optimize it to parallel job (as example below) by rewriting your query or updating input/output configurations with the job diagram simulator within Visual Studio Code ASA extension or query editor in Azure portal. To learn more, see Optimize query using job diagram simulator (preview).

Key metrics to identify the bottleneck of a parallel job
Watermark delay and backlogged input events are the key metrics to determine the performance of your Stream Analytics job. If your job's watermark delay is continuously increasing and input events are backlogged, your job can't keep up with the rate of input events and produce outputs in a timely manner. From the computation resource point of view, the CPU and memory resources are utilized in high level when this case happens.
The physical job diagram visualizes these key metrics in the diagram together to provide you a full picture of them for identifying the bottleneck easily.

For more information about the metrics definition, see Azure Stream Analytics node name dimension.
Identify the uneven distributed input events (data-skew)
When you have a job already running in parallel mode, but you observe a high watermark delay, use this method to determine why.
To find the root cause, you open the physical job diagram in the Azure portal. Select Job diagram (preview) under Monitoring, and switch to Physical diagram.
From the physical diagram, you can easily identify whether all the partitions have high watermark delay, or just a few of them by viewing the watermark delay value in each node or choosing the watermark delay heatmap setting to sort the streaming nodes (recommended):

After you apply the heatmap settings you made above, you'll get the streaming nodes with high watermark delay in the top left corner. Then you can check if the corresponding streaming nodes are having significant more input events than others. For this example, the streamingnode#0 and streamingnode#1 are having more input events.

You can further check how many partitions are allocated to the streaming nodes individually in order to find out if the more input events are caused by more partitions allocated or any specific partition having more input events. For this example, all the streaming nodes are having two partitions. It means the streamingnode#0 and streamingnode#1 are having certain specific partition that contains more input events than other partitions.
To locate which partition has more input events than other partitions in streamingnode#0 and streamingnode#1, do the following steps:
- Select Add chart in chart section
- Add Input Events into metric and Partition ID into splitter
- Select Apply to bring out the input events chart
- Tick streamingnode#0 and streamingnode#1 in diagram
You'll see the chart below with the input events metric filtered by the partitions in the two streaming nodes.

What further action can you take?
As shown in the example, the partitions (0 and 1) have more input data than other partitions are. We call this data skew. The streaming nodes that are processing the partitions with data skew need to consume more CPU and memory resources than others do. This imbalance leads to slower performance and increases the watermark delay. You can check the CPU and memory usage in the two streaming nodes as well in the physical diagram. To mitigate the problem, you need to repartition your input data more evenly.
Identify the cause of overloaded CPU or memory
When a parallel job has an increasing watermark delay without the previously mentioned data skew situation, it may be caused by a significant amount of data across all streaming nodes that inhibits performance. You can identify that the job has this characteristic using the physical diagram.
Open the physical job diagram, go to your job Azure portal under Monitoring, select Job diagram (preview), and switch to Physical diagram. You'll see the physical diagram loaded as below.
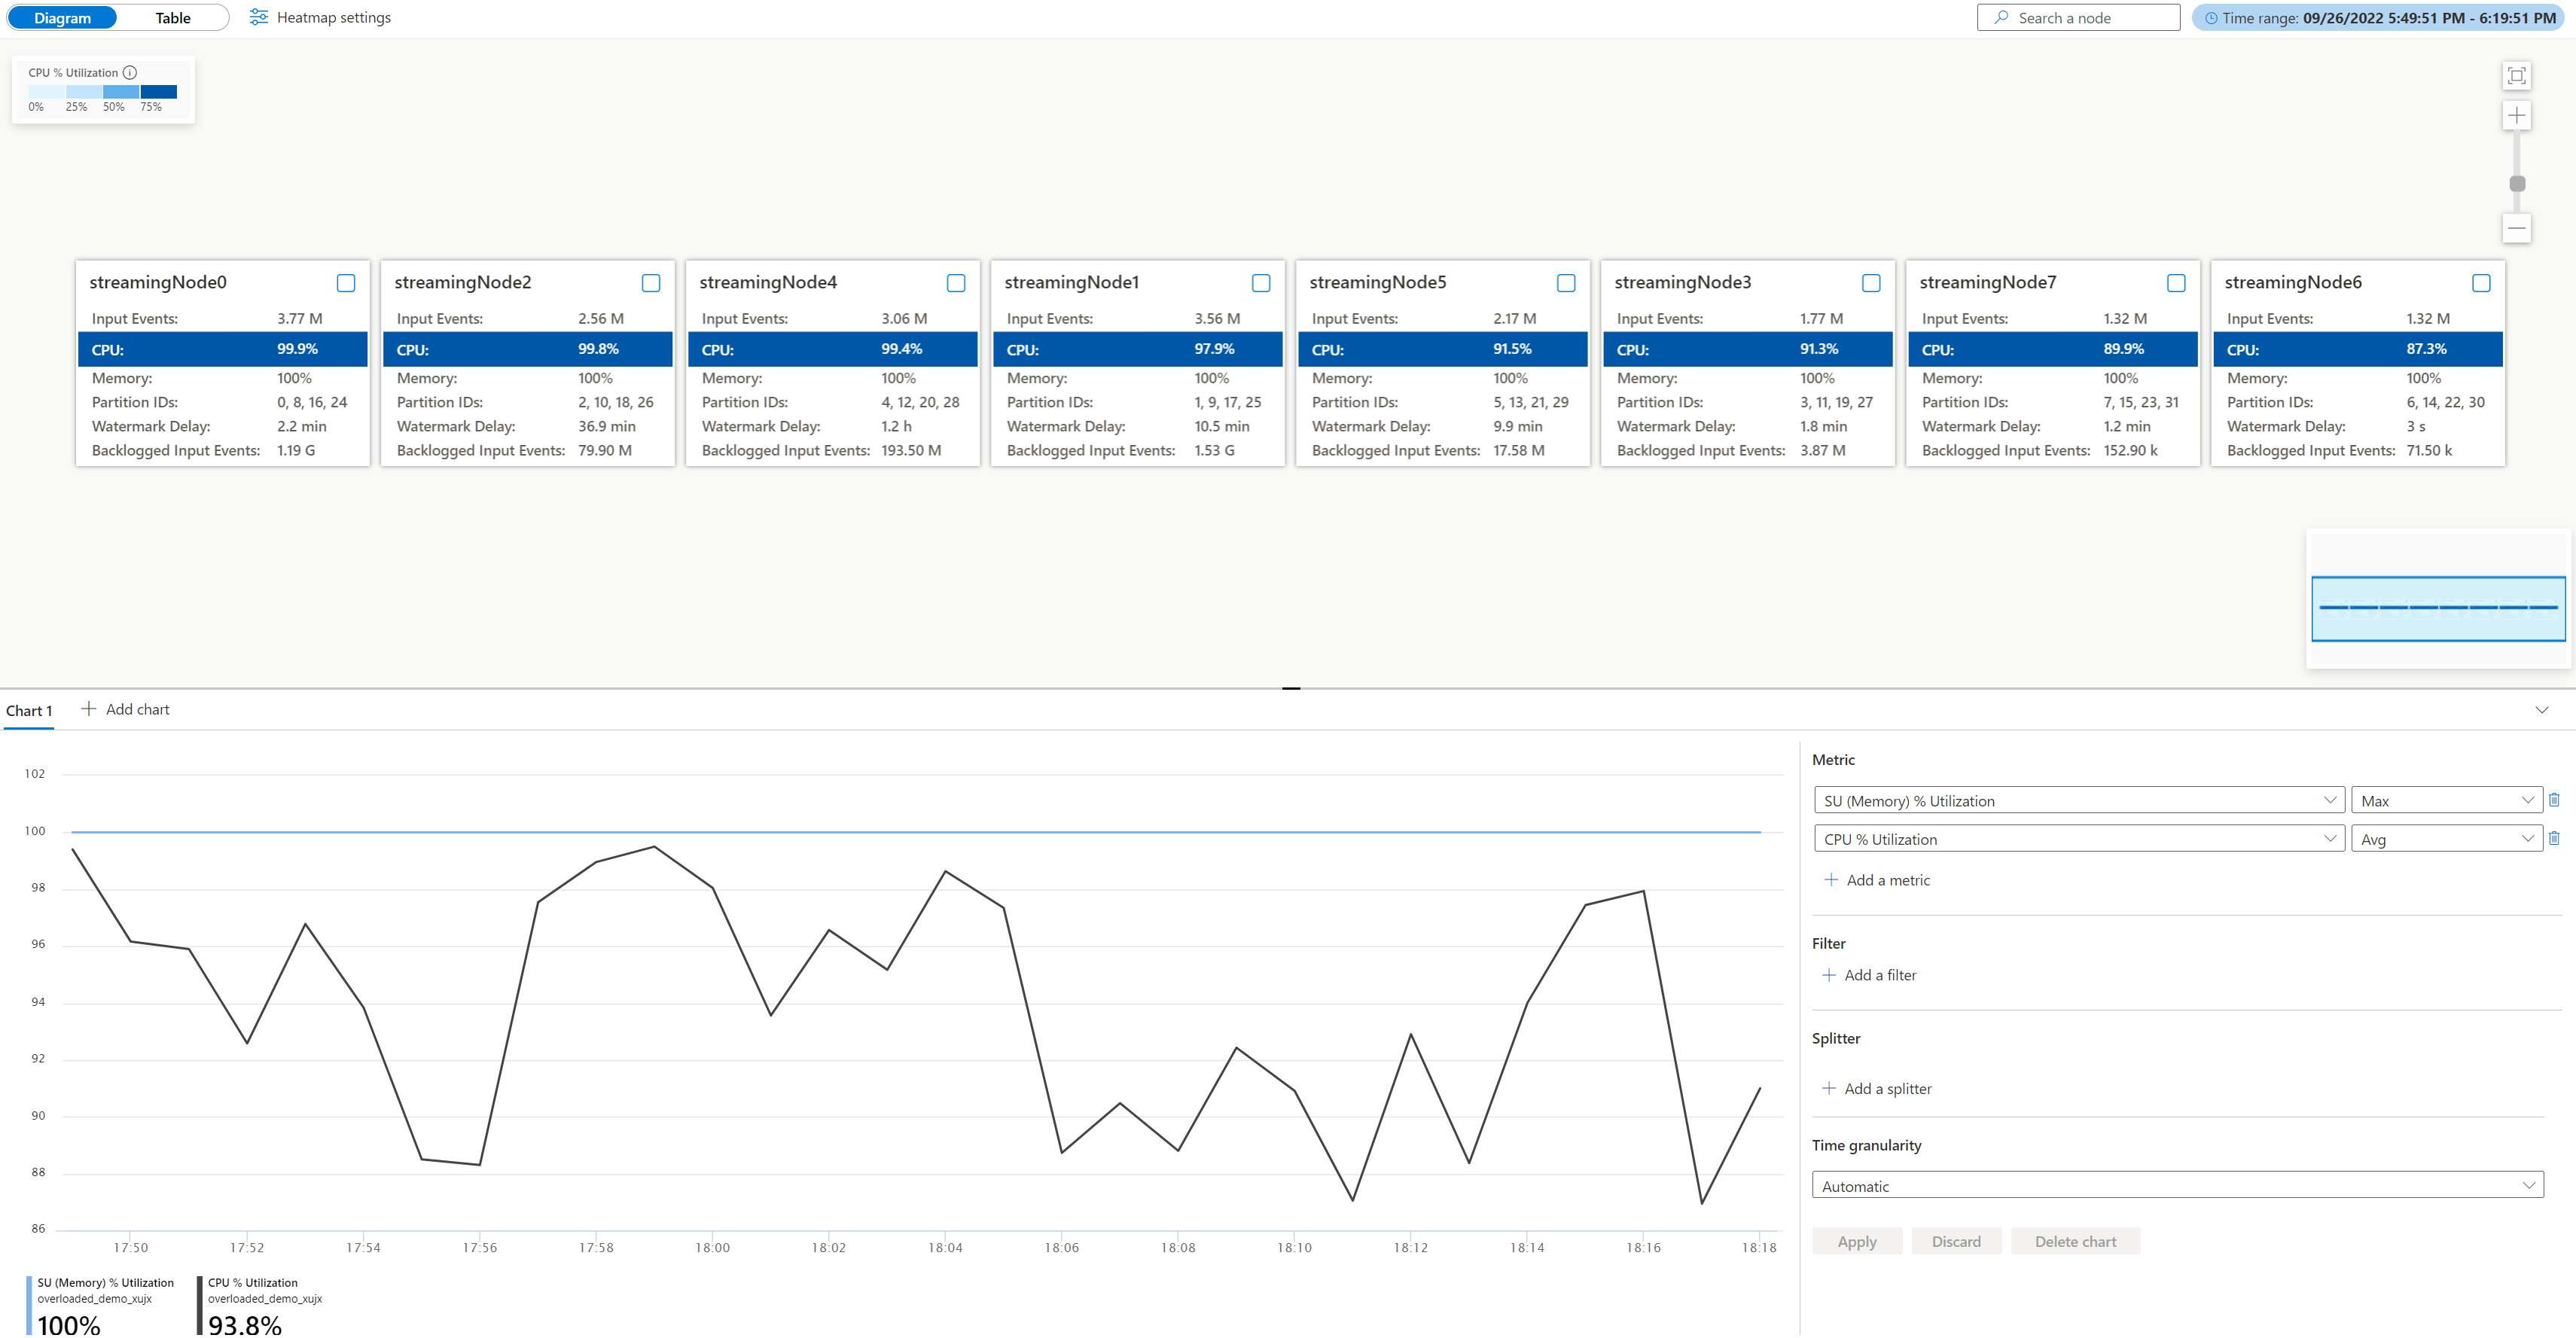
Check the CPU and memory utilization in each streaming node to see if the utilization in all streaming nodes is too high. If the CPU and SU utilization is high (more than 80 percent) in all streaming nodes, you can conclude that this job has a large amount of data being processed within each streaming node.
From above case, the CPU utilization is around 90% and memory utilization is 100% already. It shows that each streaming node is running out of resource to process the data.
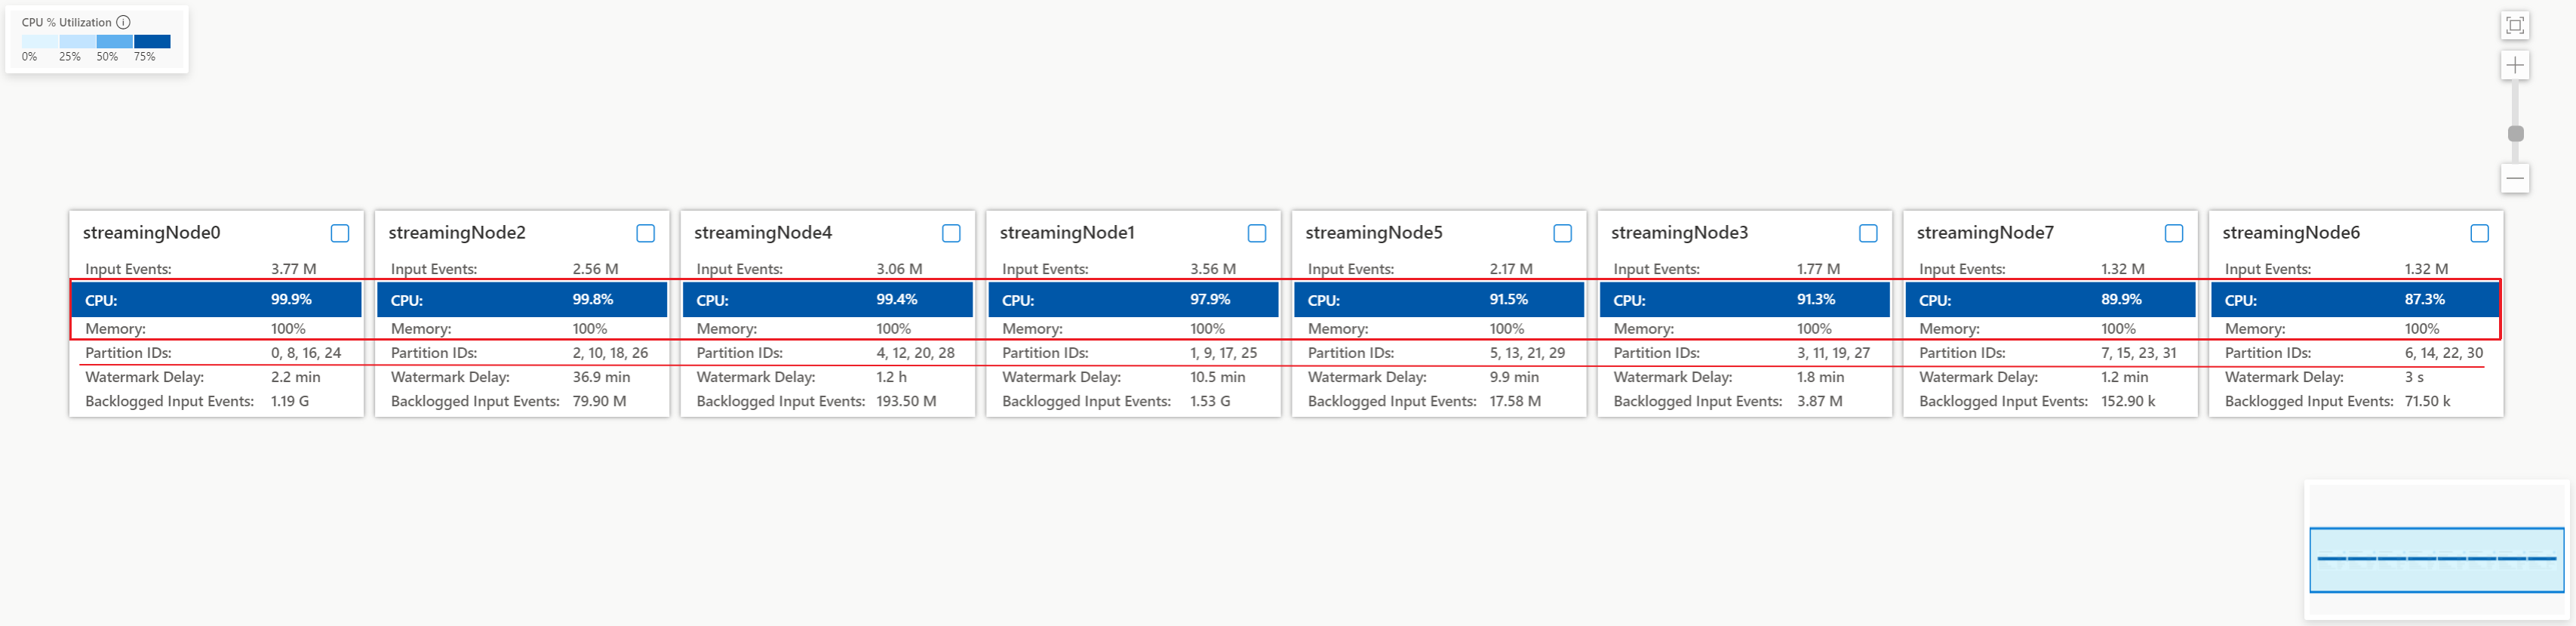
Check how many partitions are allocated into each streaming node so that you can decide if you need more streaming nodes to balance the partitions to reduce the burden of the existing streaming nodes.
For this case, each streaming node is having four partitions allocated which looks too much to a streaming node.


What further action can you take?
Consider reducing the partition count for each streaming node to reduce the input data. You could double the SUs allocated to each streaming node to two partitions per node by increasing streaming node count from 8 to 16. Or you can quadruple the SUs to have each streaming node handle data from one partition.
To learn more about the relationship between streaming node and streaming unit, see Understand streaming unit and streaming node.
What should you do if the watermark delay is still increasing when one streaming node is handling data from one partition? Repartition your input with more partitions to reduce the amount of data in each partition. For details, see Use repartitioning to optimize Azure Stream Analytics jobs.