Use Synapse Studio to monitor your workspace pipeline runs
With Azure Synapse Analytics, you can create complex pipelines that can automate and integrate your data movement, data transformation, and compute activities within your solution. You can author and monitor these pipelines using Synapse Studio.
This article explains how to monitor your pipeline runs, which allows you to keep an eye on the latest status, issues, and progress of your pipelines.
Access pipeline runs list
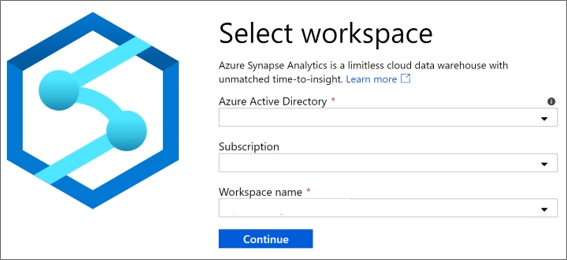
To see the list of pipeline runs in your workspace, first open the Synapse Studio and select your workspace.
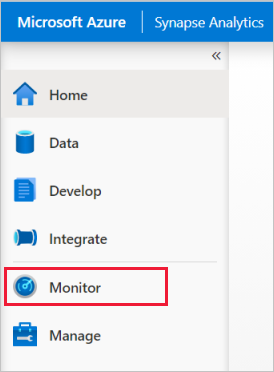
Once you've opened your workspace, select the Monitor section on the left.
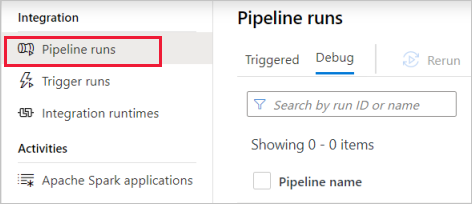
Select Pipeline runs to view the list of pipeline runs.
Filter your pipeline runs
You can filter the list of pipeline runs to the ones you're interested in. The filters at the top of the screen allow you to specify a field on which you'd like to filter. You can view pipeline run data for the last 45 days. If you want to store pipeline run data for more than 45 days, set up your own diagnostic logging with Azure monitor.
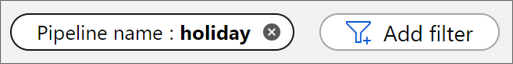
For example, you can filter the view to see only the pipeline runs for the pipeline named "holiday":
View details about a specific pipeline run
To view details about your pipeline run, select the pipeline run. Then view the activity runs associated with the pipeline run. If the pipeline is still running, you can monitor the progress.
Next steps
To learn more about monitoring applications, see the Monitor Apache Spark applications article.
Feedback
Coming soon: Throughout 2024 we will be phasing out GitHub Issues as the feedback mechanism for content and replacing it with a new feedback system. For more information see: https://aka.ms/ContentUserFeedback.
Submit and view feedback for