Note
Access to this page requires authorization. You can try signing in or changing directories.
Access to this page requires authorization. You can try changing directories.
With Synapse Studio, you can run SQL scripts on the SQL pools in your workspace.
This article explains how to monitor your SQL requests, allowing you to keep an eye on the status of running requests and discover details of historical requests.
Access SQL requests list
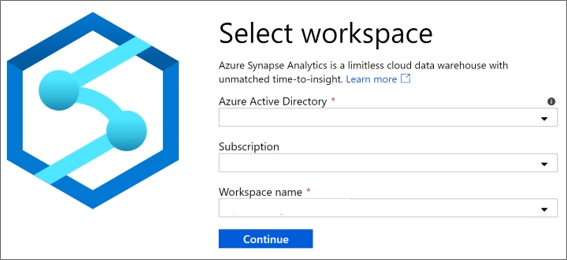
To see the list of SQL requests in your workspace, first open the Synapse Studio and select your workspace.
Once you've opened your workspace, select the Monitor section on the left.
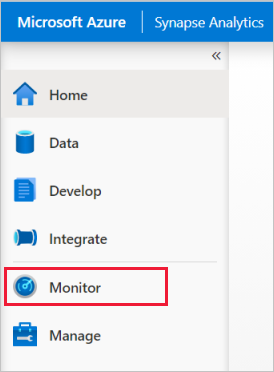
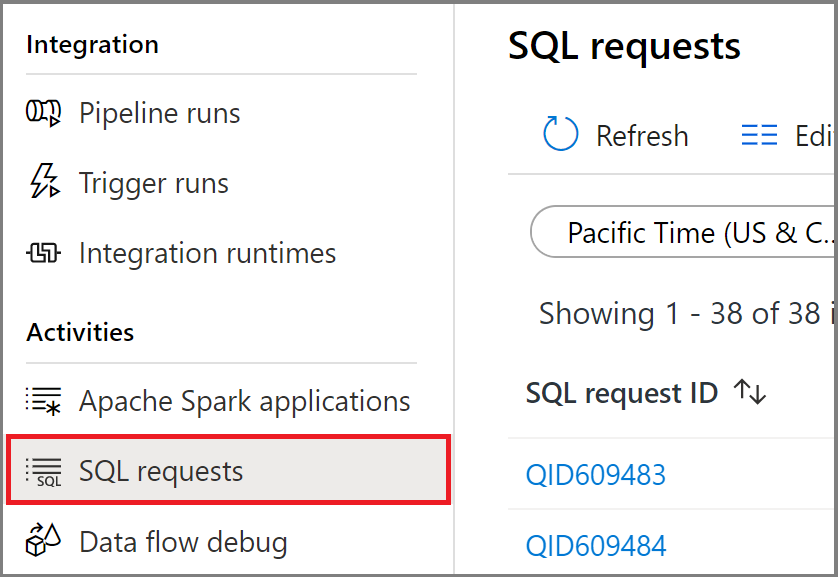
Select SQL requests to view the list of SQL requests.
Select a SQL pool
By default, the SQL request history for the built-in serverless SQL pool are shown in this view. You can select one of your dedicated SQL pools to see the SQL request history of that pool.

Filter your SQL requests
You can filter the list of SQL requests to the ones that interest you. The filters at the top of the screen allow you to specify a field on which you'd like to filter.
For example, you can filter the view to see only the SQL requests submitted by maria@contoso.com:

View details about a specific SQL request
To view the details about one of your SQL requests, open the SQL request to navigate to the details view. For the complex requests running on dedicated SQL pools, you can monitor the progress.
Next steps
For more information on monitoring pipeline runs, see the Monitor pipeline runs in Synapse Studio article.
For more information on monitoring Apache Spark applications, see the Monitor Apache Spark applications in Synapse Studio article.
To analyze historical queries, see Historical query storage and analysis in Azure Synapse Analytics.