Note
Access to this page requires authorization. You can try signing in or changing directories.
Access to this page requires authorization. You can try changing directories.
Organizations often need to process large volumes of data before serving to key business stakeholders. In this tutorial, you'll learn how to leverage the integrated experiences in Azure Synapse Analytics to process data using Apache Spark and later serve the data to end-users through Power BI and Serverless SQL.
Before you begin
- Azure Synapse Analytics workspace with an ADLS Gen2 storage account configured as the default storage.
- Power BI workspace and Power BI Desktop to visualize data. For details, see create a Power BI workspace and install Power BI desktop
- Linked service to connect your Azure Synapse Analytics and Power BI workspaces. For details, see link to a Power BI workspace
- Serverless Apache Spark pool in your Synapse Analytics workspace. For details, see create a serverless Apache Spark pool
Download and prepare the data
In this example, you'll use Apache Spark to perform some analysis on taxi trip tip data from New York. The data is available through Azure Open Datasets. This subset of the dataset contains information about yellow taxi trips, including information about each trip, the start, and end time and locations, the cost, and other interesting attributes.
Run the following lines to create a Spark dataframe by pasting the code into a new cell. This retrieves the data via the Open Datasets API. Pulling all of this data generates about 1.5 billion rows. The following code example uses start_date and end_date to apply a filter that returns a single month of data.
from azureml.opendatasets import NycTlcYellow
from dateutil import parser
from datetime import datetime

end_date = parser.parse('2018-06-06')
start_date = parser.parse('2018-05-01')
nyc_tlc = NycTlcYellow(start_date=start_date, end_date=end_date)
filtered_df = spark.createDataFrame(nyc_tlc.to_pandas_dataframe())
Using Apache Spark SQL, we'll create a database called NycTlcTutorial. We'll use this database to store the results of our data processing.
%%pyspark
spark.sql("CREATE DATABASE IF NOT EXISTS NycTlcTutorial")
Next, we'll use Spark dataframe operations to process the data. In the following code, we perform the following transformations:
- The removal of columns which aren't needed.
- The removal of outliers/incorrect values through filtering.
- The creation of new features like
tripTimeSecsandtippedfor extra analysis.
from pyspark.sql.functions import unix_timestamp, date_format, col, when

taxi_df = filtered_df.select('totalAmount', 'fareAmount', 'tipAmount', 'paymentType', 'rateCodeId', 'passengerCount'\
                                , 'tripDistance', 'tpepPickupDateTime', 'tpepDropoffDateTime'\
                                , date_format('tpepPickupDateTime', 'hh').alias('pickupHour')\
                                , date_format('tpepPickupDateTime', 'EEEE').alias('weekdayString')\
                                , (unix_timestamp(col('tpepDropoffDateTime')) - unix_timestamp(col('tpepPickupDateTime'))).alias('tripTimeSecs')\
                                , (when(col('tipAmount') > 0, 1).otherwise(0)).alias('tipped')
                                )\
                        .filter((filtered_df.passengerCount > 0) & (filtered_df.passengerCount < 8)\
                                & (filtered_df.tipAmount >= 0) & (filtered_df.tipAmount <= 25)\
                                & (filtered_df.fareAmount >= 1) & (filtered_df.fareAmount <= 250)\
                                & (filtered_df.tipAmount < filtered_df.fareAmount)\
                                & (filtered_df.tripDistance > 0) & (filtered_df.tripDistance <= 100)\
                                & (filtered_df.rateCodeId <= 5)
                                & (filtered_df.paymentType.isin({"1", "2"})))
Finally, we'll save our dataframe using the Apache Spark
saveAsTablemethod. This will allow you to later query and connect to the same table using serverless SQL pools.taxi_df.write.mode("overwrite").saveAsTable("NycTlcTutorial.nyctaxi")
Query data using serverless SQL pools
Azure Synapse Analytics allows the different workspace computational engines to share databases and tables between its serverless Apache Spark pools and serverless SQL pool. This is powered through the Synapse shared metadata management capability. As a result, the Spark created databases and their parquet-backed tables become visible in the workspace serverless SQL pool.
To query your Apache Spark table using your serverless SQL pool:
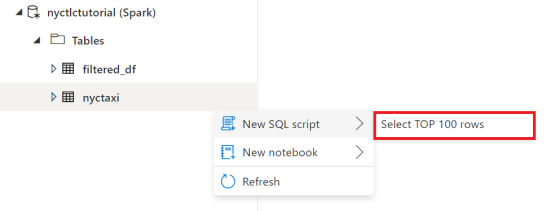
Once you have saved your Apache Spark table, switch over to the data tab.
Under Workspaces, find the Apache Spark table that you just created and select New SQL script and then Select TOP 100 rows.
You can continue to refine your query or even visualize your results using the SQL charting options.
Connect to Power BI
Next, we'll connect our serverless SQL pool to our Power BI workspace. Once you have connected your workspace, you'll be able to create Power BI reports both directly from Azure Synapse Analytics and from Power BI desktop.
Note
Before you begin, you will need to set up a linked service to your Power BI workspace and download the Power BI desktop.
To connect our serverless SQL pool to our Power BI workspace:
Navigate to the Power BI datasets tab and select the option to + New Dataset. From the prompt, download the .pbids file from the SQL Analytics database you would like to use as a data source.
Open the file with Power BI Desktop to create a dataset. Once you open the file, connect to the SQL server database using the Microsoft account and Import option.
Create a Power BI report
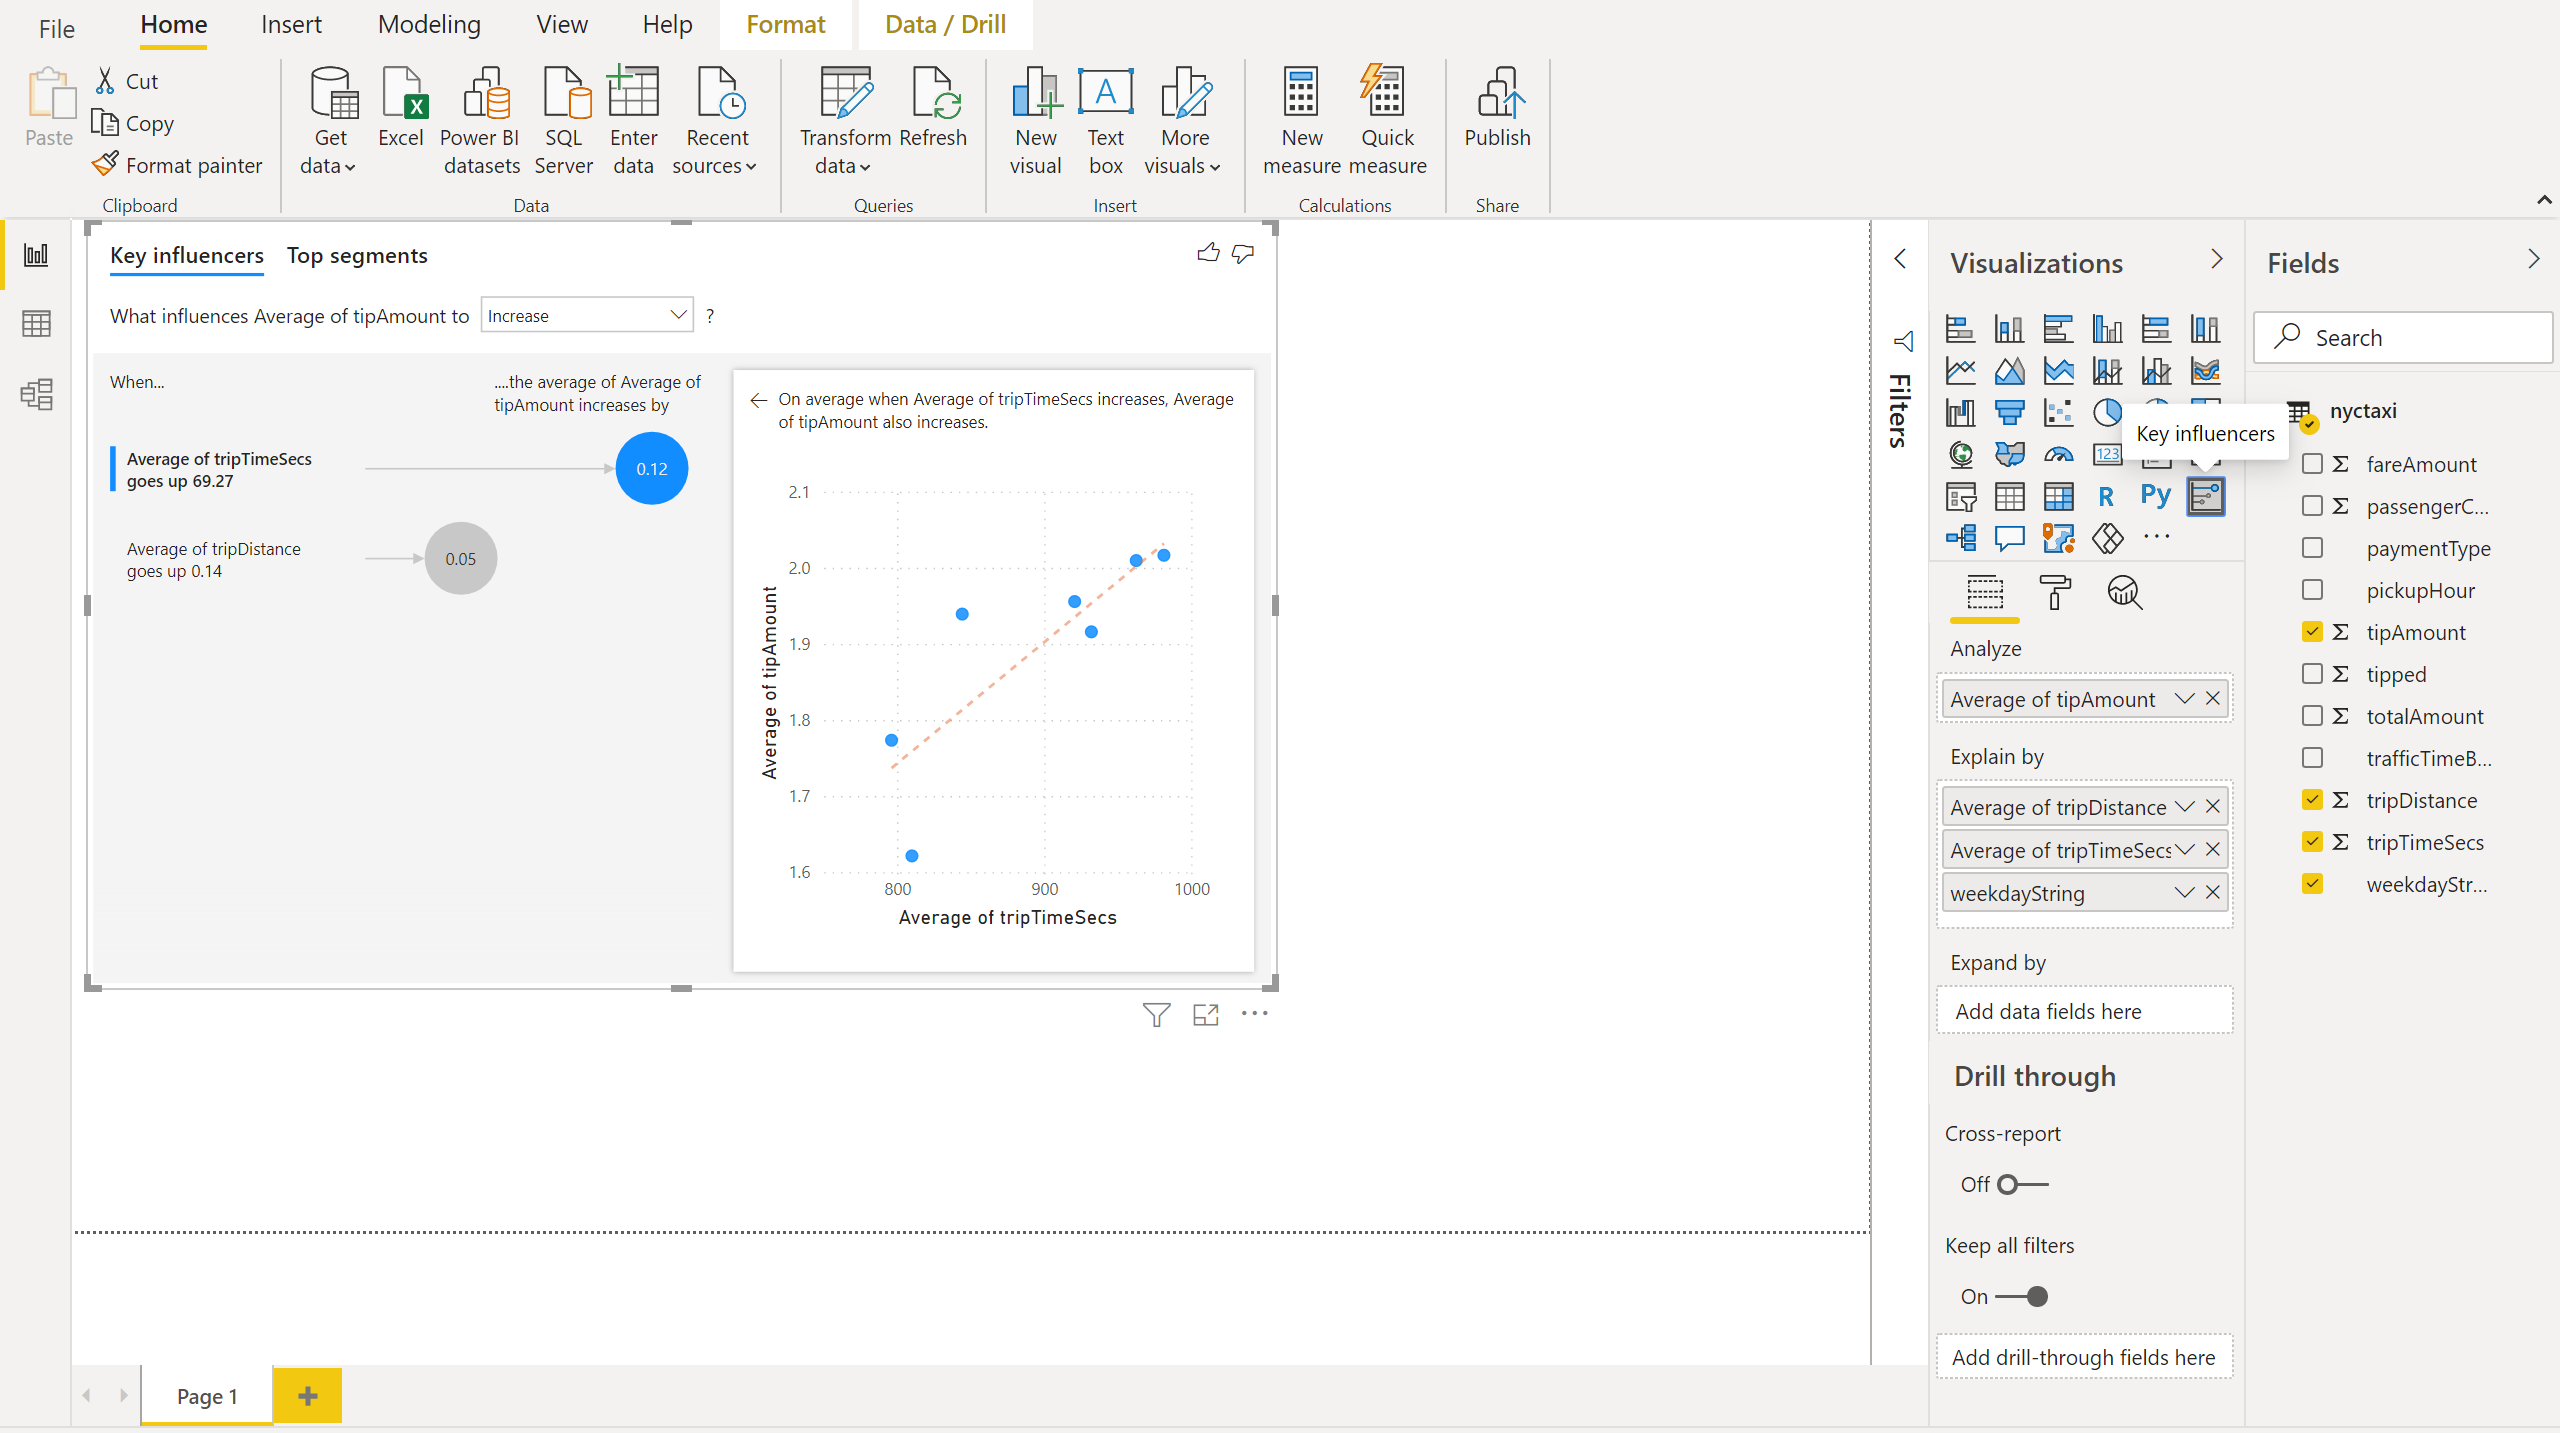
From Power BI desktop, you can now add a key influencers chart to your report.
Drag the average tipAmount column to Analyze axis.
Drag the weekdayString, average tripDistance, and average tripTimeSecs columns to the Explain by axis.
On the Power BI desktop Home tab, select Publish and Save changes. Enter a file name and save this report to the NycTaxiTutorial Workspace.
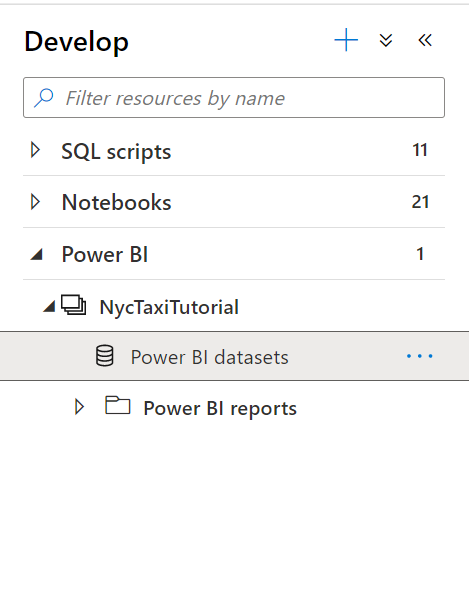
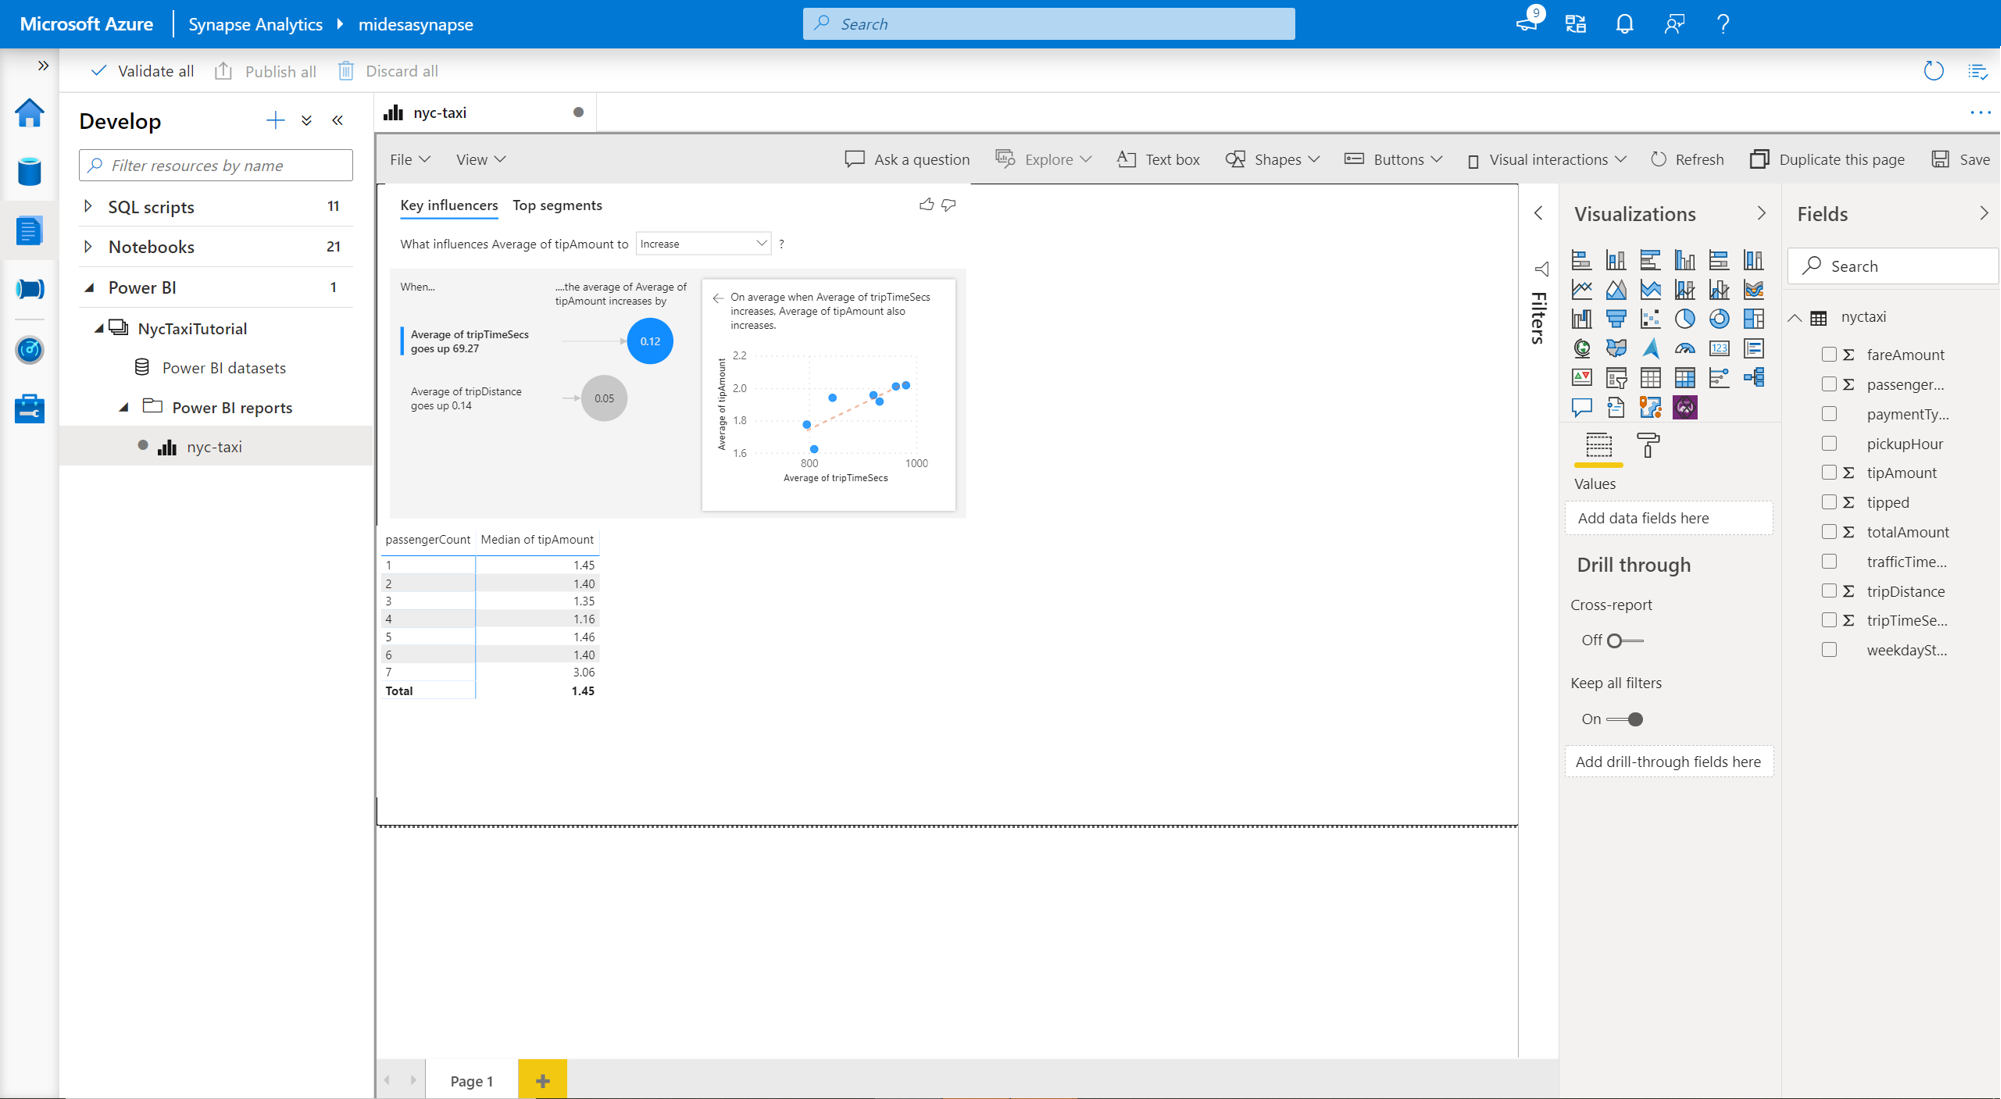
In addition, you can also create Power BI visualizations from within your Azure Synapse Analytics workspace. To do this, navigate to the Develop tab in your Azure Synapse workspace and open the Power BI tab. From here, you can select your report and continue building more visualizations.
For more details on how to create a dataset through serverless SQL and connect to Power BI, you can visit this tutorial on connecting to Power BI desktop
Next steps
You can continue to learn more about data visualization capabilities in Azure Synapse Analytics by visiting the following documents and tutorials: