Note
Access to this page requires authorization. You can try signing in or changing directories.
Access to this page requires authorization. You can try changing directories.
Overview
The Clarity dashboard provides aggregate metrics to help you get an overall understanding of the traffic on your site. At a glance, you can see:
- Users who were clicking on nonexistent links.
- Users who scrolled up and down a page searching for something they couldn't readily find.
- Concurrent JavaScript errors that occur across your clients.
- Time a user spends navigating on your site.
The statistics provided can be sliced using filters and segments, which allow you to drill down on specific user behavior patterns. This can provide the basis to make good decisions on modifying your site.

Note
The dashboard displays data based on the user's local machine timezone.
Customize Dashboard
Switch dashboards
Clarity now supports multiple dashboards. As you hover through Dashboards, you cana view the dropdown menu. This allows you to effortlessly navigate between dashboards ensuring continuity in your analysis. Any filters or segments applied are retained across dashboards, providing a consistent view of your data. The supported dashboards are:
- Clarity
- Advertising
- Google Analytics
The Clarity dashboard is the default view and provides an overview of user interactions and insights specific to your project. It is automatically available for all projects without any additional setup. The other dashboards, Advertising and Google Analytics, are accessible only if your project has been integrated with these services.

Rearrange cards
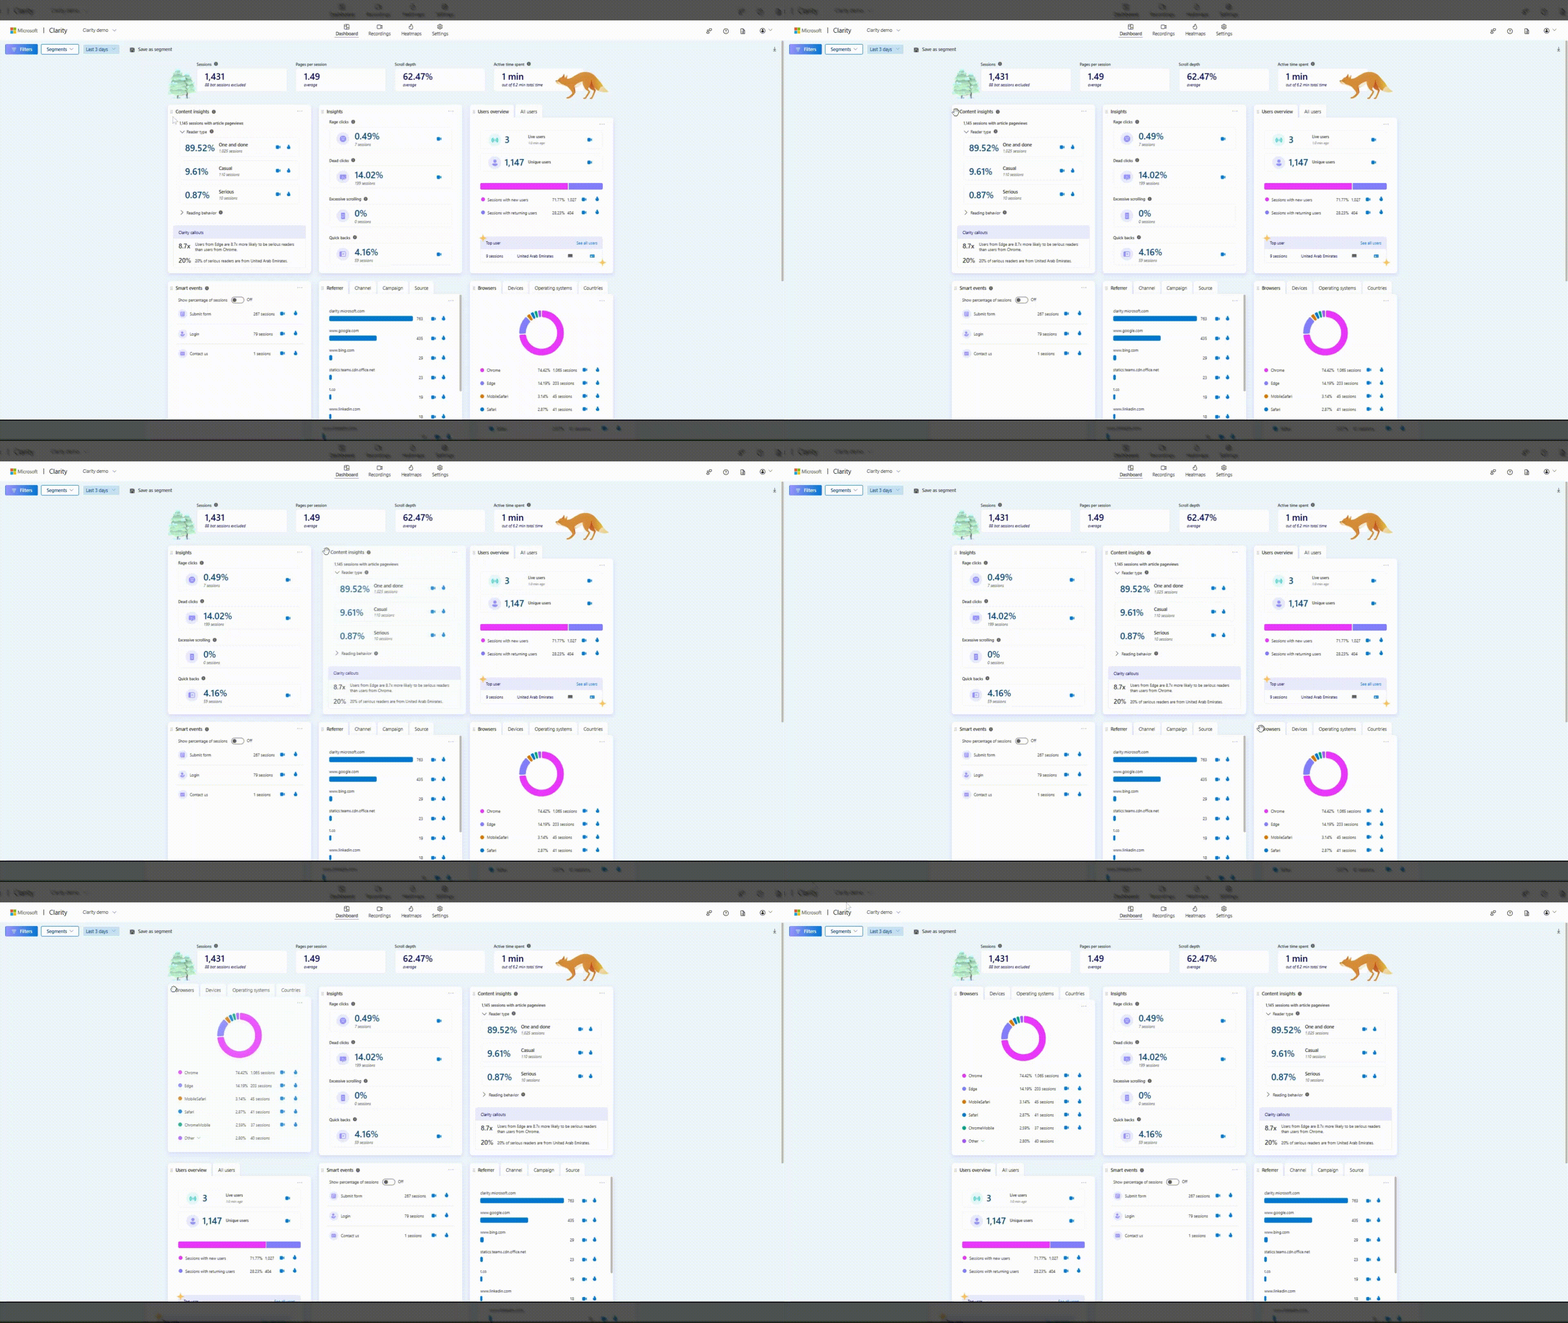
The cards on the dashboard are customizable. Choose the hamburger menu icon from the left of the card and drag it to rearrange according to your preferences.

Hide card
Note
When downloading dashboard, hidden cards are not visible.
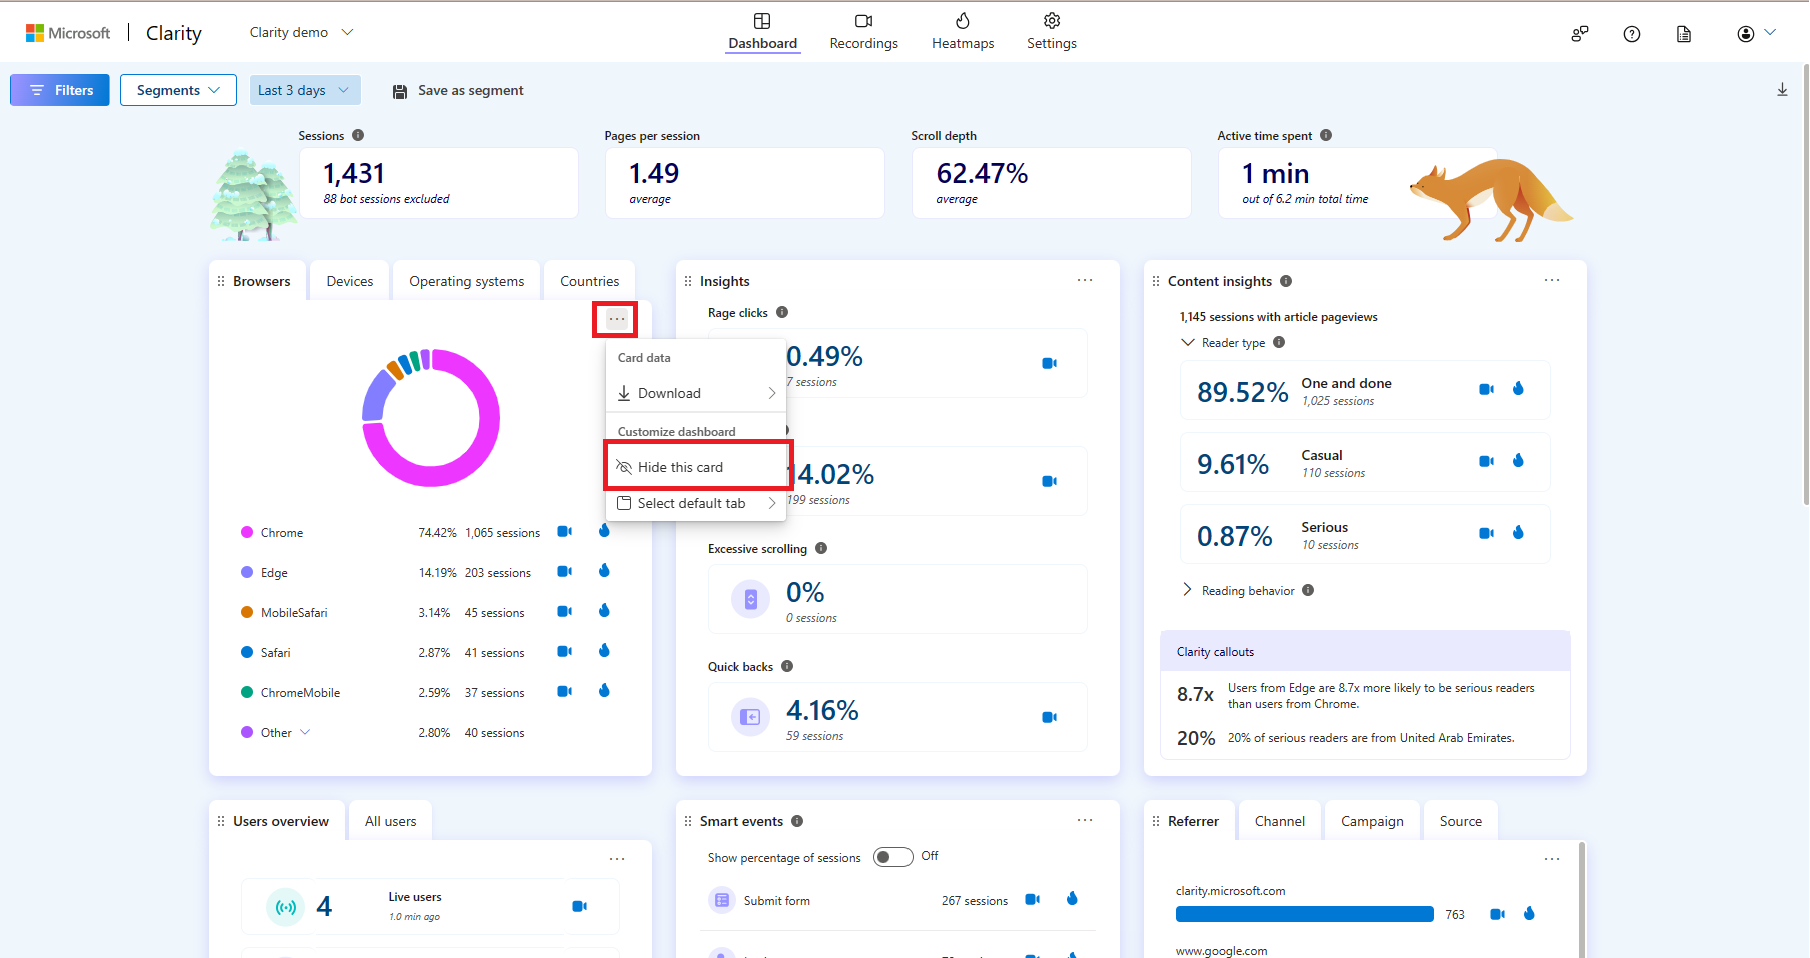
You can hide a card by selecting Menu -> Hide card.

Access hidden cards
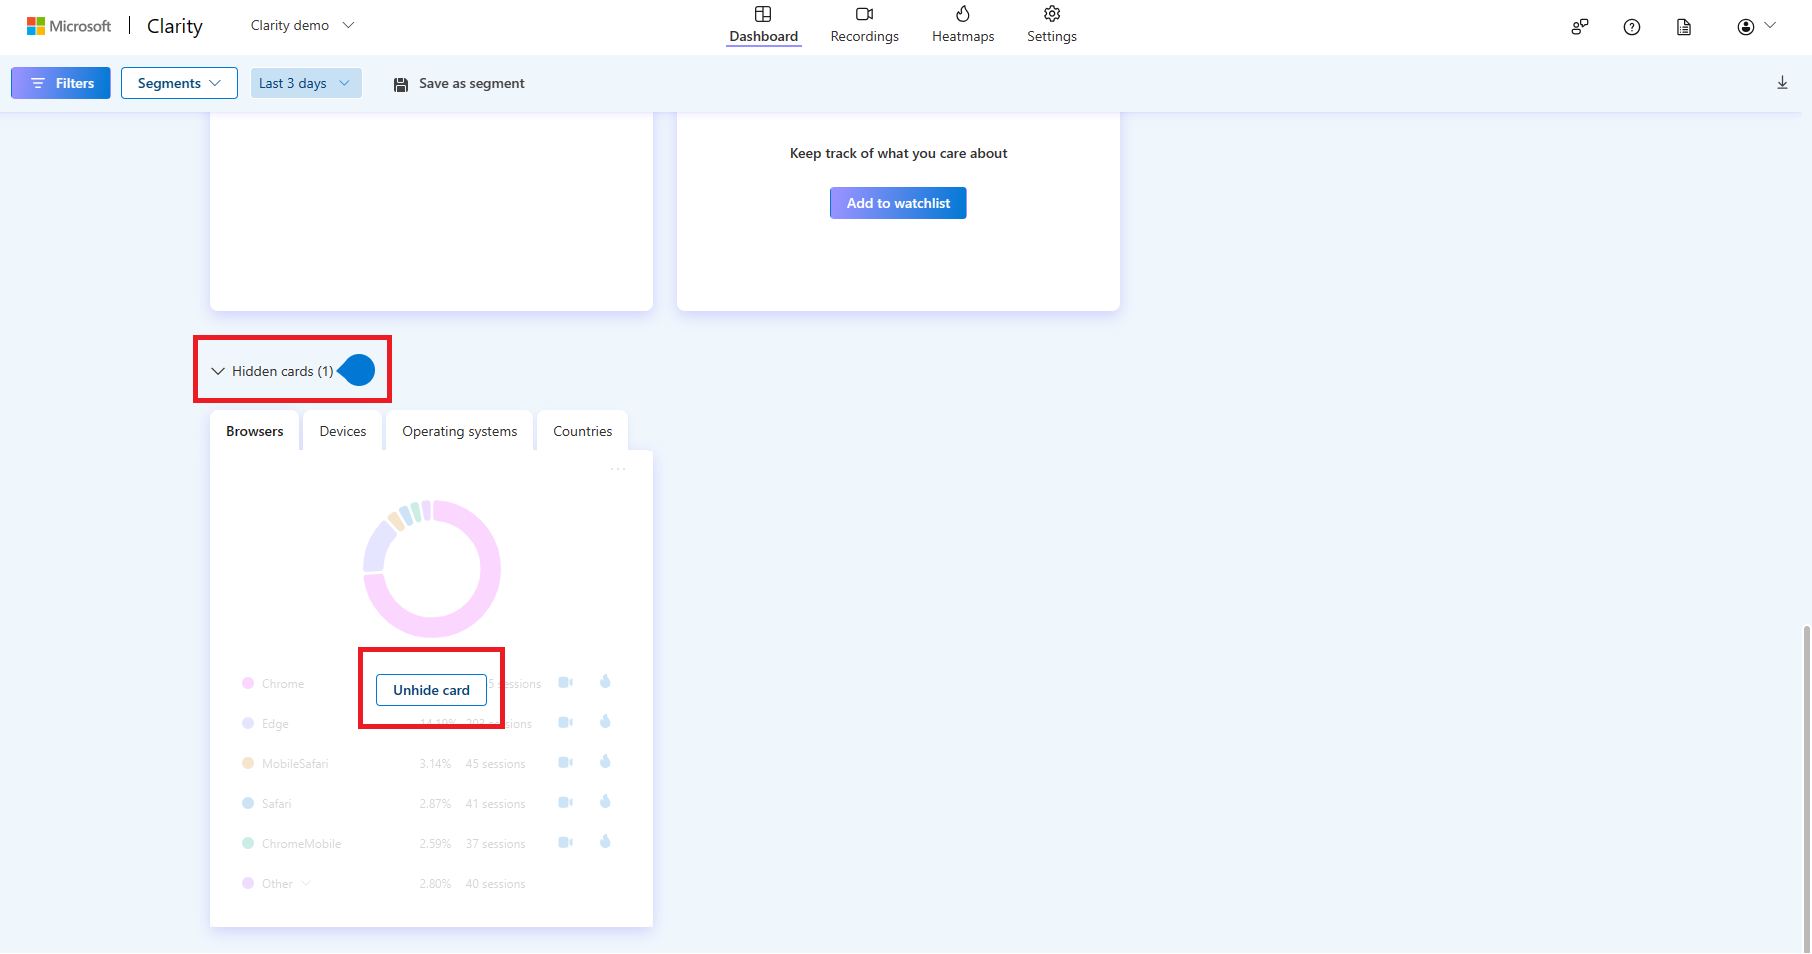
Hidden cards can be accessed at the bottom of the dashboard and easily reinstated by selecting Unhide card.

Set a default tab
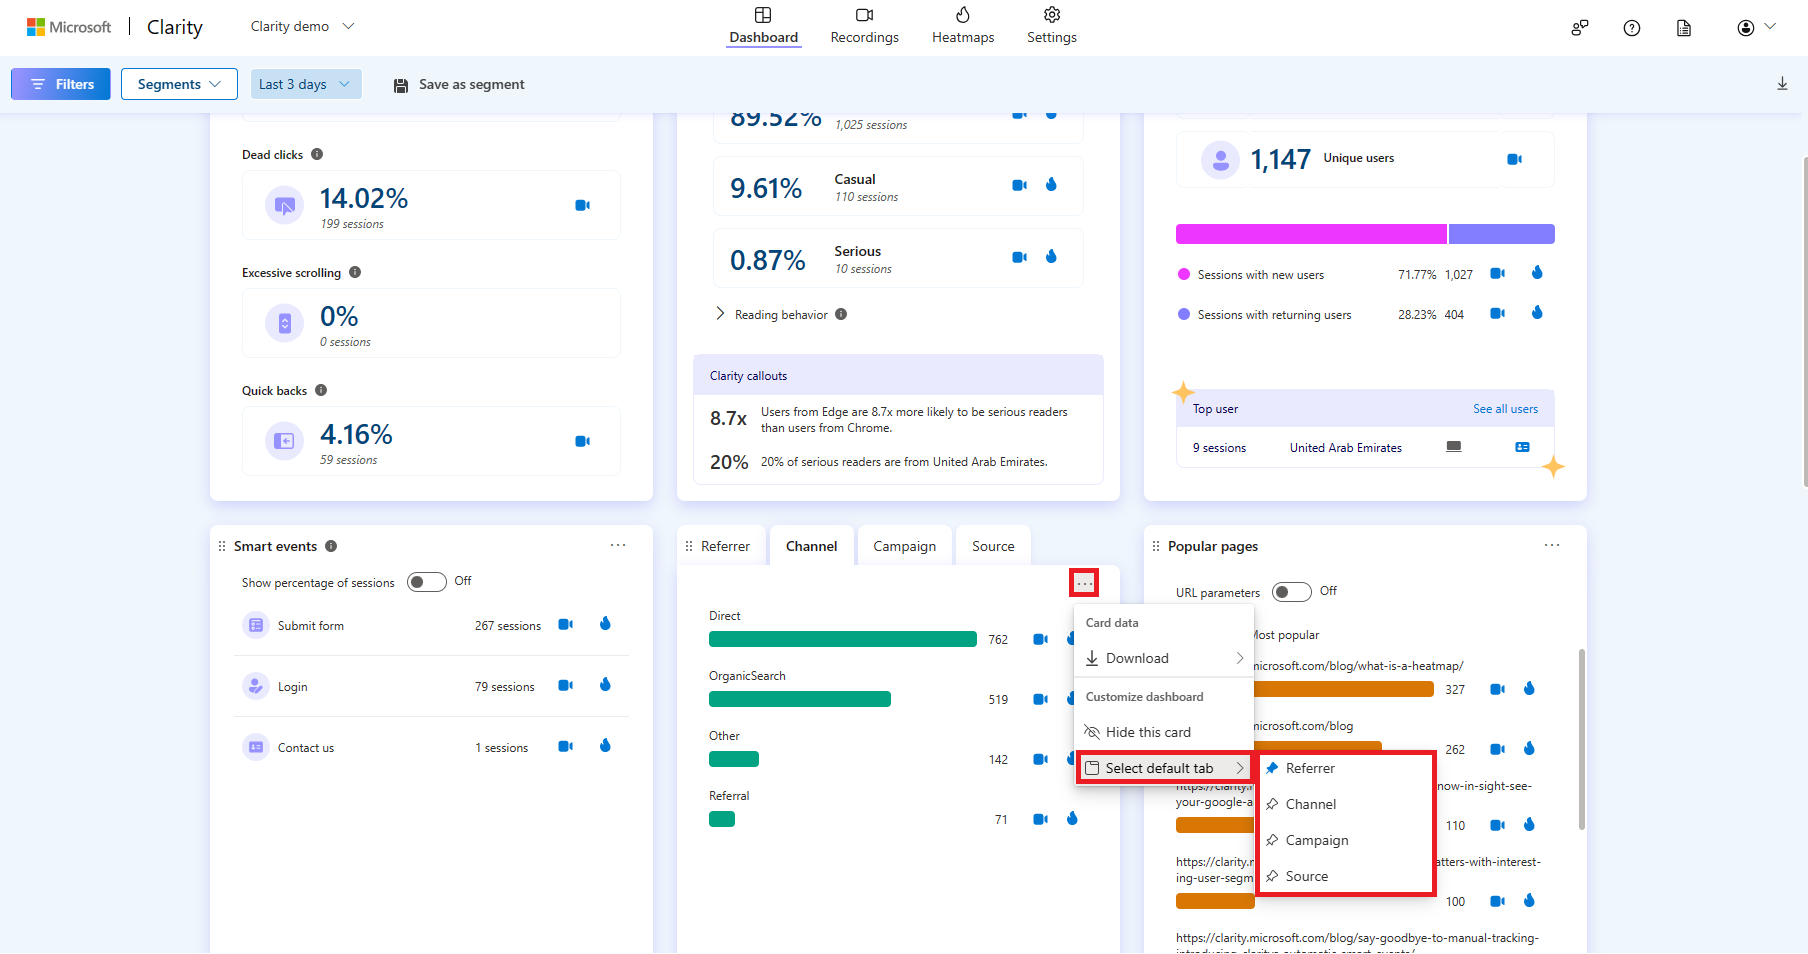
For cards containing multiple tabs, you can designate a default tab by choosing Menu -> Select default tab. The initial tab is automatically set as the default.

Watchlist
Note
Your watchlist is unique to you and not shared with your team.
The Watchlist card helps you track key user interactions and the data that matters most to you. You can easily monitor specific segments, custom tags, or labels by adding them to your watchlist. Once an item is added, the card displays the percentage of sessions that match your selection. Applying filters updates this percentage.

To get started, select Add to watchlist.

Choose the type of data to track from the list of Segment, Custom tag, or Label.

For example, if you add a segment for "Device: Mobile", "Visited URL: Homepage", and "Timeframe: Last 3 days", your watchlist displays the percentage of sessions where users visited the homepage on a mobile device within the last three days. To view this, go to Segment -> Select the corresponding segment from the dropdown -> Add.

Similarly, you can add a Custom Tag by selecting a tag from the dropdown or a Label by choosing a label from the dropdown, and finally selecting Add.

FAQ
For more answers, refer to Insights FAQ.