Note
Access to this page requires authorization. You can try signing in or changing directories.
Access to this page requires authorization. You can try changing directories.
Applies to: ![]() Calculated column
Calculated column ![]() Calculated table
Calculated table ![]() Measure
Measure ![]() Visual calculation
Visual calculation
Returns an interval of rows within the given axis, relative to the current row. This interval will be comprised of either the last step rows before the current one, or the first step rows after the current one.
Syntax
RANGE ( <step>[, <includeCurrent>][, <axis>][, <orderBy>][, <blanks>][, <reset>] )
Parameters
| Term | Definition |
|---|---|
step |
The number of rows before (negative value) or after (positive value) the current row to include in the range. Must be a constant value. - If negative, the window will contain the last -step rows before the current row. - Otherwise, the window will contain the first step rows after the current row. |
includeCurrent |
(Optional) A logical value specifying whether or not to include the current row in the range. Default value is True. |
axis |
(Optional) An axis reference, the direction along which the interval will be created. If omitted, the first axis of the Visual Shape definition is used. |
orderBy |
(Optional) An ORDERBY() clause with expressions that determine how to sort each partition along the axis. If orderBy is not provided, the data is sorted by the grouping columns on the default axis in ascending order by default. |
blanks |
(Optional) An enumeration that defines how to handle blank values when sorting the axis. The supported values are:
|
reset |
(Optional) Indicates if the calculation resets, and at which level of the visual shape's column hierarchy. Accepted values are: a field reference to a column in the current visual shape, NONE (default), LOWESTPARENT, HIGHESTPARENT, or an integer. The behavior depends on the integer sign: - If zero or omitted, the calculation does not reset. Equivalent to NONE. - If positive, the integer identifies the column starting from the highest, independent of grain. HIGHESTPARENT is equivalent to 1. - If negative, the integer identifies the column starting from the lowest, relative to the current grain. LOWESTPARENT is equivalent to -1. |
Return value
An interval of data rows.
Remarks
This function can be used in visual calculations only.
The includeCurrent, axis, orderBy, blanks and reset parameters can be omitted.
If the value of reset is absolute (i.e., a positive integer, HIGHESTPARENT or a field reference) and the calculation is evaluated at or above the target level in the hierarchy, the calculation resets for each individual element. That is, the function is evaluated within a partition containing only that specific element.
Example 1
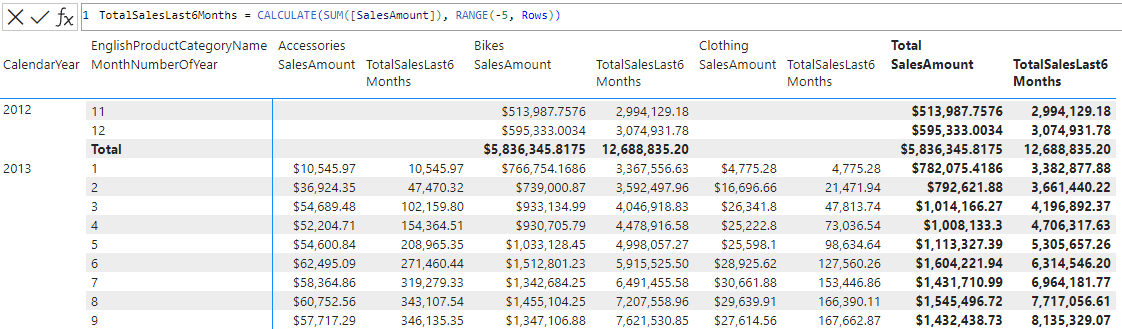
Given a table that summarizes the total sales for each product category and month, the following DAX query adds a column with the total sales in the last 6 months:
TotalSalesLast6Months = CALCULATE(SUM([SalesAmount]), RANGE(-5, Rows))
The screenshot below shows the visual matrix and the visual calculation expression:
Example 2
Given the same table, the following DAX query adds a column with the total sales in the following 12 months, not including the current month:
TotalSalesFollowingYear = CALCULATE(SUM([SalesAmount]), RANGE(12, FALSE, Rows, KEEP))