Note
Access to this page requires authorization. You can try signing in or changing directories.
Access to this page requires authorization. You can try changing directories.
When a security alert is raised or suspicious activity is detected, investigating the affected device is critical to understanding the scope of potential threats and reducing risk. Microsoft Defender for Endpoint provides comprehensive tools to investigate devices, including device timelines, network exposure assessment, security assessments, and response actions.
This article explains the device investigation process and the tools available to security analysts.
Overview of device investigation
Device investigation in Microsoft Defender for Endpoint follows a systematic approach to understand security threats:
| Investigation stage | What to do | Tools to use |
|---|---|---|
| 1. Access device details | Navigate to the device from alerts queue, device inventory, or search | Device inventory, Alerts queue, Global search |
| 2. Review device overview | Check active alerts, logged-on users, security assessment, and device health | Device overview tab, Active alerts card |
| 3. Analyze timeline | Review chronological events, identify suspicious activity, and correlate events | Device timeline, Event filters, Process trees |
| 4. Investigate alerts and incidents | Review associated incidents, alert severity, and investigation state | Incidents and alerts tab |
| 5. Assess security posture | Review security recommendations, discovered vulnerabilities, and missing updates | Security recommendations, Discovered vulnerabilities, Missing KBs |
| 6. Check network exposure | Identify if device is internet-facing and review external connections | Internet-facing tag, Network events in timeline |
| 7. Take response actions | Isolate device, restrict app execution, collect investigation package, or run antivirus scan | Response actions menu |
Ways to access device investigation
You can access device investigation pages from multiple locations in the Microsoft Defender portal:
| Location | How to access | When to use |
|---|---|---|
| Device inventory | Go to Assets > Devices and select a device | Starting point for proactive device reviews or when you know the device name |
| Alerts queue | Go to Incidents & alerts > Alerts and select the device name from an alert | When investigating a specific alert and need device context |
| Incidents | Go to Incidents & alerts > Incidents, select an incident, then select a device from the incident graph | During incident response when multiple devices may be affected |
| Global search | Use the search box at the top of the portal and select Device from dropdown | Quick access when you know the device name or IP address |
| File details | Navigate to a file details page and select devices where the file was observed | When tracking file-based threats across multiple devices |
| IP address or domain details | Navigate to IP or domain details and select devices that communicated with it | When investigating network-based threats or C2 communications |
Note
As part of the investigation or response process, you can collect an investigation package from a device. Here's how: Collect investigation package from devices.

Note
Due to product constraints, the device profile doesn't consider all cyber evidence when determining the 'Last Seen' timeframe (as seen on the device page as well). For example, the 'Last seen' value in the Device page may show an older time frame even though more recent alerts or data is available in the machine's timeline.
Device details
The device details section provides information such as the domain, OS, and health state of the device. If there's an investigation package available on the device, you see a link that allows you to download the package.
Response actions
Response actions run along the top of a specific device page and include:
- View in map
- Device value
- Set criticality
- Manage tags
- Isolate device
- Restrict app execution
- Run antivirus scan
- Collect investigation package
- Initiate Live Response Session
- Initiate automated investigation
- Consult a threat expert
- Action center
You can take response actions in the Action center, in a specific device page, or in a specific file page.
For more information on how to take action on a device, see Take response action on a device.
For more information, see Investigate user entities.
Note
View in map and set criticality are features from Microsoft Exposure Management, which is currently in public preview.
Tabs
The tabs provide relevant security and threat prevention information related to the device. In each tab, you can customize the columns that are shown by selecting Customize columns from the bar above the column headers.
Overview
The Overview tab displays the cards for active alerts, logged on users, and security assessment.

Incidents and alerts
The Incidents and alerts tab provides a list of incidents and alerts that are associated with the device. This list is a filtered version of the Alerts queue, and shows a short description of the incident, alert, severity (high, medium, low, informational), status in the queue (new, in progress, resolved), classification (not set, false alert, true alert), investigation state, category of alert, who is addressing the alert, and last activity. You can also filter the alerts.

When an alert is selected, a fly-out appears. From this panel you can manage the alert and view more details such as incident number and related devices. Multiple alerts can be selected at a time.
To see a full page view of an alert, select the title of the alert.
Timeline
The Timeline tab provides a chronological view of the events and associated alerts observed on the device. For a detailed walkthrough including MITRE ATT&CK techniques, event flagging, and process trees, see Investigate device timeline.
Security recommendations
Security recommendations are generated from Microsoft Defender for Endpoint's Vulnerability Management capability. Selecting a recommendation shows a panel where you can view relevant details such as description of the recommendation and the potential risks associated with not enacting it. See Security recommendation for details.
Configuration management - Security policies
The Security policies tab shows the endpoint security policies that are applied on the device. You see a list of policies, type, status, and last check-in time. Selecting the name of a policy takes you to the policy details page where you can see the policy settings status, applied devices, and assigned groups.

Configuration management - Effective settings
The Effective settings tab provides visibility into the actual value of each security setting and identifies the source that configured it. It lists setting names, policy types, effective values, the source of each effective value, and the last report time.
Configuration sources can include tools like Microsoft Defender for Endpoint, Group Policy, Intune, or default settings. They can also be specific registry paths, such as the MDM or Group Policy hives. If the source is a registry location, the Configured By field shows as Unknown along with the registry path.
Select a setting to open a side panel with more details. You see the current value, any other configuration attempts that didn’t take effect, and—for complex settings like ASR rules or AV exclusions—a breakdown of all configured rules, their sources, and any exclusions.
Note
The presented settings are AV security settings, Attack Surface Reduction rules, and exclusions, for Windows platforms.


Software inventory
The Software inventory tab lets you view software on the device, along with any weaknesses or threats. Selecting the name of the software takes you to the software details page where you can view security recommendations, discovered vulnerabilities, installed devices, and version distribution. See Software inventory for details.

Discovered vulnerabilities
The Discovered vulnerabilities tab shows the name, severity, and threat insights of discovered vulnerabilities on the device. If you select a specific vulnerability, you see a description and details.

Missing KBs
The Missing KBs tab lists the missing security updates for the device.

Cards
Active alerts
The Azure Advanced Threat Protection card displays a high-level overview of alerts related to the device and their risk level, if you're using the Microsoft Defender for Identity feature, and there are any active alerts. More information is available in the Alerts drill down.

Note
You'll need to enable the integration on both Microsoft Defender for Identity and Defender for Endpoint to use this feature. In Defender for Endpoint, you can enable this feature in advanced features. For more information on how to enable advanced features, see Turn on advanced features.
Logged on users
The Logged on users card shows how many users logged on in the past 30 days, along with the most and least frequent users. Selecting the See all users link opens the details pane, which displays information such as user type, sign-in type, and when the user was first and last seen. For more information, see Investigate user entities.

Note
The 'Most frequent' user value is calculated only based on evidence of users who successfully logged on interactively. However, the All users side-pane calculates all sorts of user logons so it is expected to see more frequent users in the side-pane, given that those users may not be interactive.
Security assessments
The Security assessments card shows the overall exposure level, security recommendations, installed software, and discovered vulnerabilities. A device's exposure level is determined by the cumulative impact of its pending security recommendations.

Device health status
The Device health status card shows a summarized health report for the specific device. One of the following messages is displayed at the top of the card to indicate the overall status of the device (listed in order of highest to lowest priority):
- Defender Antivirus not active
- Security intelligence isn't up to date
- Engine isn't up to date
- Quick scan failed
- Full scan failed
- Platform isn't up to date
- Security intelligence update status is unknown
- Engine update status is unknown
- Quick scan status is unknown
- Full scan status is unknown
- Platform update status is unknown
- Device is up to date
- Status not available for macOS & Linux
Other information in the card includes: the last full scan, last quick scan, security intelligence update version, engine update version, platform update version, and Defender Antivirus mode.
A grey circle indicates that the data is unknown.
Note
The overall status message for macOS and Linux devices currently shows up as 'Status not available for macOS & Linux'. Currently, the status summary is only available for Windows devices. All other information in the table is up to date to show the individual states of each device health signal for all supported platforms.
To gain an in-depth view of the device health report, you can go to Reports > Devices health. For more information, see Device health and compliance report in Microsoft Defender for Endpoint.
Note
The date and time for Defender Antivirus mode is currently not available.

Investigate device timeline
The device timeline provides a chronological view of events and associated alerts observed on a device, helping you investigate anomalous behavior and potential attacks. You can explore specific events, review MITRE ATT&CK techniques, use process trees, and flag events for follow-up.
To access the device timeline:
- Navigate to the device page from:
- Device inventory (Assets > Devices)
- An alert in the Alerts queue
- An incident in Incidents & alerts
- Select the Timeline tab.
Key timeline capabilities
The device timeline includes several features to help you investigate events efficiently:
| Feature | Description | How to use |
|---|---|---|
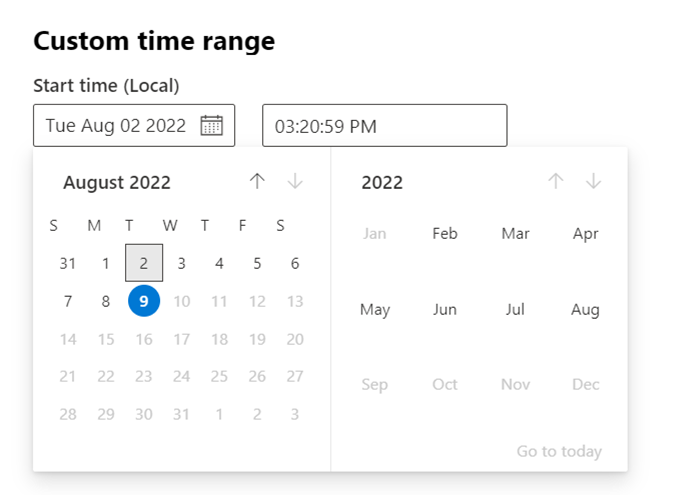
| Custom time range picker | Select specific date ranges to focus your investigation | Select the date range picker at the top of the timeline |
| Process tree view | Visualize parent-child relationships between processes | Select an event to open the side panel with process tree |
| MITRE ATT&CK techniques | View all related MITRE techniques for events | Techniques appear as bold text with blue icons; select to see details |
| User page integration | See which user accounts are associated with events | Select user names in events to navigate to user investigation page |
| Visible filters | See which filters are currently applied to the timeline | Active filters appear at the top of the timeline |
| Event flagging | Mark important events for follow-up during investigation | Select the flag icon next to an event |

Note
For firewall events to be displayed, you need to enable the audit policy, see Audit Filtering Platform connection.
Firewall covers the following events:
Search, filter, and export events
- Search for specific events: Use the search bar to look for specific timeline events.
- Filter events from a specific date: Select the calendar icon in the upper left of the table to display events in the past day, week, 30 days, or custom range. By default, the device timeline displays events from the past 30 days. Use the timeline to jump to a specific moment in time by highlighting the section. The arrows on the timeline pinpoint automated investigations.
- Export detailed device timeline events: Export the device timeline for the current date or a specified date range up to seven days.
More details about certain events appear in the Additional information section. These details vary depending on the type of event, for example:
- Contained by Application Guard - the web browser event was restricted by an isolated container
- Active threat detected - the threat detection occurred while the threat was running
- Remediation unsuccessful - an attempt to remediate the detected threat was invoked but failed
- Remediation successful - the detected threat was stopped and cleaned
- Warning bypassed by user - the Windows Defender SmartScreen warning was dismissed and overridden by a user
- Suspicious script detected - a potentially malicious script was found running
- The alert category - if the event led to the generation of an alert, the alert category (Lateral Movement, for example) is provided
Event details
Select an event to view relevant details about that event. A panel displays general event information. When applicable and data is available, a graph showing related entities and their relationships is also shown.
To further inspect the event and related events, you can quickly run an advanced hunting query by selecting Hunt for related events. The query returns the selected event and the list of other events that occurred around the same time on the same endpoint.

MITRE ATT&CK techniques in the device timeline
Techniques are an additional data type in the event timeline that provide more insight on activities associated with MITRE ATT&CK techniques or subtechniques. This feature simplifies the investigation experience by helping analysts understand the activities that were observed on a device.
Techniques are highlighted in bold text and appear with a blue icon on the left. The corresponding MITRE ATT&CK ID and technique name also appear as tags under Additional information. Search and Export options are also available for Techniques.

Select a Technique to open its corresponding side pane. Here you can see additional information and insights like related ATT&CK techniques, tactics, and descriptions. Select the specific Attack technique to open the related ATT&CK technique page where you can find more information about it.
You can copy an entity's details when you see a blue icon on the right. For instance, to copy a related file's SHA1, select the blue page icon.


You can do the same for command lines.

To use advanced hunting to find events related to the selected Technique, select Hunt for related events. This leads to the advanced hunting page with a query to find events related to the Technique.

Note
Querying using the Hunt for related events button from a Technique side pane displays all the events related to the identified technique but does not include the Technique itself in the query results.
EDR client (MsSense.exe) Resource Manager
When the EDR client on a device is running low on resources, it enters critical mode to maintain the normal working operation of the device. The device won't process new events until the EDR client returns to a normal state. A new event appears in the Timeline for that device indicating that the EDR client switched to Critical mode.
When the EDR client's resource usage goes back to normal levels, it automatically returns to normal mode.
Flag events for follow-up
Event flags in the device timeline help you filter and organize specific events when you're investigating potential attacks.
After you go through a device timeline, you can sort, filter, and export the specific events that you flagged. You can set event flags by:
- Highlighting the most important events
- Marking events that require deep dive
- Building a clean breach timeline
To flag an event:
- Find the event that you want to flag.
- Select the flag icon in the Flag column.

To view flagged events:
- In the timeline Filters section, enable Flagged events.
- Select Apply. Only flagged events are displayed.
You can apply more filters by clicking on the time bar. This only shows events prior to the flagged event.

Customize your device timeline
On the upper right-hand side of the device timeline, you can choose a date range to limit the number of events and techniques in the timeline. You can customize which columns to expose and filter for flagged events by data type or by event group.

To view only either events or techniques, select Filters from the device timeline and choose your preferred Data type to view.

Timeline data retention
Device timeline events in Microsoft Defender for Endpoint are retained according to the organization's data retention policy configured in the security portal and the underlying workspace settings. By default, security event data (including device timeline items) in Defender for Endpoint is retained for 90 days. If your tenant sends logs to a connected Microsoft Sentinel or Log Analytics workspace with a custom retention period, then timeline events retained there might be available for longer durations, as defined by those retention settings.
Important
The availability of historical timeline data depends on your retention configuration. If the default 90-day retention is insufficient for your investigation or compliance needs, consider exporting events to long-term storage or increasing the retention period in the connected workspace.
Investigate internet-facing devices
Internet-facing devices can be connected to or reached from the outside, posing a significant threat to your organization. Mapping your organization's external attack surface is a key part of security posture management. Microsoft Defender for Endpoint automatically identifies and flags onboarded, exposed, internet-facing devices in the Microsoft Defender portal.
Note
Currently, only Windows devices onboarded to Microsoft Defender for Endpoint can be identified as internet-facing. Support for other platforms is available in upcoming releases.
How devices are flagged as internet-facing
Devices that are successfully connected through TCP or identified as host reachable through UDP are flagged as internet-facing. Defender for Endpoint uses two data sources:
| Data source | Description |
|---|---|
| External scans | Identify which devices are approachable from the outside |
| Device network connections | Captured as part of Defender for Endpoint signals to identify external incoming connections that reach internal devices |
Devices can be flagged when a configured firewall policy (host firewall rule or enterprise firewall rule) allows inbound internet communication. Understanding your firewall policy and distinguishing devices that are intentionally internet-facing from those that might compromise your organization provides critical information for mapping your external attack surface.
View internet-facing devices
To view internet-facing devices in the Microsoft Defender portal:
Go to Assets > Device in the Microsoft Defender portal.
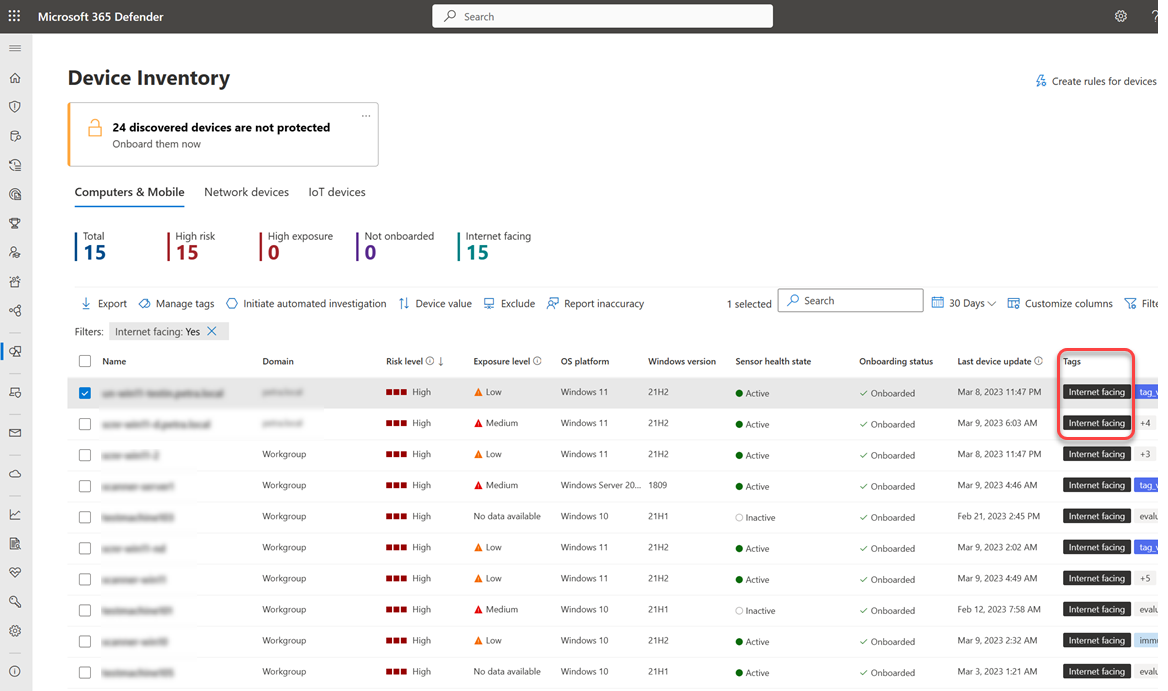
Look for devices with the internet facing tag in the Tags column.
Hover over the tag to see why it was applied:
- This device was detected by an external scan
- This device received external incoming communication

At the top of the page, you can view a counter that shows the number of devices identified as internet-facing and potentially less secure.
Filter for internet-facing devices
Use filters to focus on internet-facing devices and investigate the risk they might introduce:

The internet-facing device tag also appears in Microsoft Defender Vulnerability Management, allowing you to filter for internet-facing devices from the weaknesses and security recommendations pages in the Microsoft Defender portal.

Note
If no new events for a device occur for 48 hours, the Internet-facing tag is removed and it's no longer visible in the Microsoft Defender portal.
Investigate an internet-facing device
To view detailed information about an internet-facing device, select the device in the device inventory to open its flyout pane:

The flyout includes:
| Information | Description |
|---|---|
| Detection method | Whether the device was detected by a Microsoft external scan or received an external incoming communication |
| External network interface | External IP address and port that were scanned when the device was identified as internet facing |
| Local network interface | Local network interface address and port for this device |
| Last seen | The last time the device was identified as internet facing |
Use advanced hunting queries
Use advanced hunting queries to gain visibility and insights into internet-facing devices in your organization.
Get all internet-facing devices
Use this query to find all devices that are internet facing:
// Find all devices that are internet-facing
DeviceInfo
| where Timestamp > ago(7d)
| where IsInternetFacing
| extend InternetFacingInfo = AdditionalFields
| extend InternetFacingReason = extractjson("$.InternetFacingReason", InternetFacingInfo, typeof(string)), InternetFacingLocalPort = extractjson("$.InternetFacingLocalPort", InternetFacingInfo, typeof(int)), InternetFacingScannedPublicPort = extractjson("$.InternetFacingPublicScannedPort", InternetFacingInfo, typeof(int)), InternetFacingScannedPublicIp = extractjson("$.InternetFacingPublicScannedIp", InternetFacingInfo, typeof(string)), InternetFacingLocalIp = extractjson("$.InternetFacingLocalIp", InternetFacingInfo, typeof(string)),   InternetFacingTransportProtocol=extractjson("$.InternetFacingTransportProtocol", InternetFacingInfo, typeof(string)), InternetFacingLastSeen = extractjson("$.InternetFacingLastSeen", InternetFacingInfo, typeof(datetime))
| summarize arg_max(Timestamp, *) by DeviceId
This query returns the following fields for each internet-facing device:
| Field | Description |
|---|---|
| InternetFacingReason | Whether the device was detected by an external scan or received incoming communication from the internet |
| InternetFacingLocalIp | The local IP address of the internet facing interface |
| InternetFacingLocalPort | The local port where internet facing communication was observed |
| InternetFacingPublicScannedIp | The public IP address that was externally scanned |
| InternetFacingPublicScannedPort | The internet facing port that was externally scanned |
| InternetFacingTransportProtocol | The transport protocol used (TCP/UDP) |
Get information on inbound connections
For TCP connections, gain insights into applications or services identified as listening on a device by querying DeviceNetworkEvents.
| Scenario | Query | Notes |
|---|---|---|
| Device received external incoming communication | InboundExternalNetworkEvents("<DeviceId>") |
Returns the last 7 days of device incoming communication from public IP addresses. Replace <DeviceId> with the device ID you want to investigate. Process-related information is only available for TCP connections. |
| Device detected by external scan (TCP) | DeviceNetworkEvents\| where Timestamp > ago(7d)\| where DeviceId == ""\| where Protocol == "Tcp"\| where ActionType == "InboundInternetScanInspected" |
Use for devices tagged with This device was detected by an external scan. Replace the empty DeviceId value with the device ID you want to investigate. |
| Device detected by external scan (UDP) | DeviceNetworkEvents\| where Timestamp > ago(7d)\| where DeviceId == ""\| where Protocol == "Udp"\| where ActionType == "InboundInternetScanInspected" |
Identifies devices that were host reachable but may not have established a connection (for example, as a result of the host firewall policy). Replace the empty DeviceId value with the device ID you want to investigate. |
If the above queries fail to provide the relevant connections, you can use socket collection methods to retrieve the source process. To learn more about different tools and capabilities available to do this, see:
Report inaccuracy
If a device has incorrect internet-facing information, you can report an inaccuracy:
- Open the device flyout from the Device inventory page.
- Select Report device inaccuracy.
- In the What part is inaccurate dropdown, select Device information.
- For Which information is inaccurate select the internet facing classification checkbox from the dropdown.
- Fill in the requested details about what the correct information should be.
- Provide an email address (optional).
- Select Submit Report.
Related articles
- View and organize the Microsoft Defender for Endpoint Alerts queue
- Manage Microsoft Defender for Endpoint alerts
- Investigate Microsoft Defender for Endpoint alerts
- Investigate a file associated with a Defender for Endpoint alert
- Investigate an IP address associated with a Defender for Endpoint alert
- Investigate a domain associated with a Defender for Endpoint alert
- Investigate a user account in Defender for Endpoint
- Security recommendation
- Software inventory