Note
Access to this page requires authorization. You can try signing in or changing directories.
Access to this page requires authorization. You can try changing directories.
Applies to
- Microsoft Defender for Endpoint Plan 1
- Microsoft Defender for Endpoint Plan 2
- Microsoft Defender Antivirus
Platforms
- Windows
Requirements
Microsoft Defender Antivirus performance analyzer has the following prerequisites:
- Supported Windows versions:
- Windows 10
- Windows 11
- Windows Server 2016 and later
- Windows Server 2012 R2 (when onboarded using modern, unified solution)
- For Windows Server 2012 R2, the Windows ADK (Windows Performance Toolkit) is needed. Download and install the Windows ADK
- Platform Version:
4.18.2108.7or later - PowerShell Version: PowerShell Version 5.1, PowerShell ISE, remote PowerShell (4.18.2201.10+), PowerShell 7.x (4.18.2201.10+)
What is the Microsoft Defender Antivirus performance analyzer?
If devices running Microsoft Defender Antivirus are experiencing performance issues, you can use the performance analyzer to improve the performance of Microsoft Defender Antivirus. The performance analyzer is a PowerShell command-line tool that helps you determine files, file extensions, and processes that might be causing performance issues on individual endpoints during antivirus scans. You can use the information gathered by performance analyzer to assess performance issues and apply remediation actions.
Similar to the way mechanics perform diagnostics and service on a vehicle that has performance problems, the performance analyzer can help you improve Microsoft Defender Antivirus performance.

Some options to analyze include:
- Top paths that impact scan time
- Top files that impact scan time
- Top processes that impact scan time
- Top file extensions that impact scan time
- Combinations – for example:
- top files per extension
- top paths per extension
- top processes per path
- top scans per file
- top scans per file per process
Running performance analyzer
The high-level process for running the performance analyzer involves the following steps:
Run the performance analyzer to collect a performance recording of Microsoft Defender Antivirus events on the endpoint.
Note
Performance of Microsoft Defender Antivirus events of the type
Microsoft-Antimalware-Engineare recorded through the performance analyzer.Analyze the scan results using different recording reports.
Using performance analyzer
To start recording system events, open PowerShell in administrator mode and perform the following steps:
Run the following command to start the recording:
New-MpPerformanceRecording -RecordTo <recording.etl>where
-RecordToparameter specifies full path location in which the trace file is saved. For more cmdlet information, see Microsoft Defender Antivirus cmdlets.If there are processes or services thought to be affecting performance, reproduce the situation by carrying out the relevant tasks.
Press ENTER to stop and save recording, or Ctrl+C to cancel recording.
Analyze the results using the performance analyzer's
Get-MpPerformanceReportparameter. For example, on executing the commandGet-MpPerformanceReport -Path <recording.etl> -TopFiles 3 -TopScansPerFile 10, the user is provided with a list of top-ten scans for the top three files affecting performance.For more information on command-line parameters and options, see the New-MpPerformanceRecording and Get-MpPerformanceReport.
Note
When running a recording, if you get the error "Cannot start performance recording because Windows Performance Recorder is already recording", run the following command to stop the existing trace with the new command: wpr -cancel -instancename MSFT_MpPerformanceRecording.
Performance tuning data and information
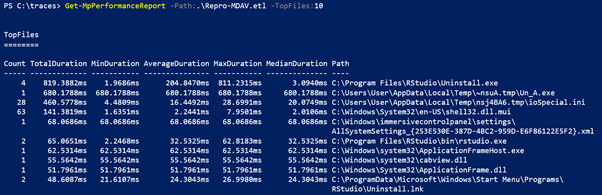
Based on the query, the user is able to view data for scan counts, duration (total/min/average/max/median), path, process, and reason for scan. The following image shows sample output for a simple query of the top 10 files for scan impact.
Exporting and converting to CSV and JSON
The results of the performance analyzer can also be exported and converted to a CSV or JSON file. This article includes examples that describe the process of "export" and "convert" through sample code.
Starting with Defender version 4.18.2206.X, users are able to view scan skip reason information under SkipReason column. The possible values are:
- Not Skipped
- Optimization (typically due to performance reasons)
- User skipped (typically due to user-set exclusions)
For CSV
- To export:
(Get-MpPerformanceReport -Path .\Repro-Install.etl -Topscans 1000).TopScans | Export-CSV -Path .\Repro-Install-Scans.csv -Encoding UTF8 -NoTypeInformation
- To convert:
(Get-MpPerformanceReport -Path .\Repro-Install.etl -Topscans 100).TopScans | ConvertTo-Csv -NoTypeInformation
For JSON
- To convert:
(Get-MpPerformanceReport -Path .\Repro-Install.etl -Topscans 1000).TopScans | ConvertTo-Json -Depth 1
To ensure machine-readable output for exporting with other data processing systems, it's recommended to use -Raw parameter for Get-MpPerformanceReport. See the following sections for more details.
Microsoft Defender Antivirus Performance Analyzer reference
Tip
Do you want to learn more? Engage with the Microsoft Security community in our Tech Community: Microsoft Defender for Endpoint Tech Community.