Note
Access to this page requires authorization. You can try signing in or changing directories.
Access to this page requires authorization. You can try changing directories.
This article describes how to test e-commerce site pages for custom code memory leaks in Microsoft Dynamics 365 Commerce.
You can conduct memory leak tests on a mock page to ensure that custom e-commerce module and data action code that is running on the page doesn't leak memory.
The following steps outline the process for generating heap snapshots of an e-commerce site page to detect memory leaks. As part of this process, you establish a memory baseline, add a request load to the page, run the garbage collection, and then make sure that all memory is freed up back to the memory baseline size.
- Create a page mock that represents the e-commerce page that you want to test.
- Build production code.
- Run the Node server in debug mode.
- Open the browser inspect tool.
- Establish a server startup heap memory baseline.
- Take a memory snapshot for a page.
- Test for memory leaks.
Create a page mock that represents the e-commerce page that you want to test
For information about how to create a custom page mock that includes the modules that you want to test, or save a live e-commerce page as a page mock by using the ?item=nodeserviceproxy:true query string parameter, see Test modules by using page mocks.
Build production code
To build production code in the root folder of the online software development kit (SDK), run the following command.
yarn build:prod
Run the Node server in debug mode
To run the Node server in debug mode, run the following command.
node --inspect-brk build/server.js
Open the browser inspect tool
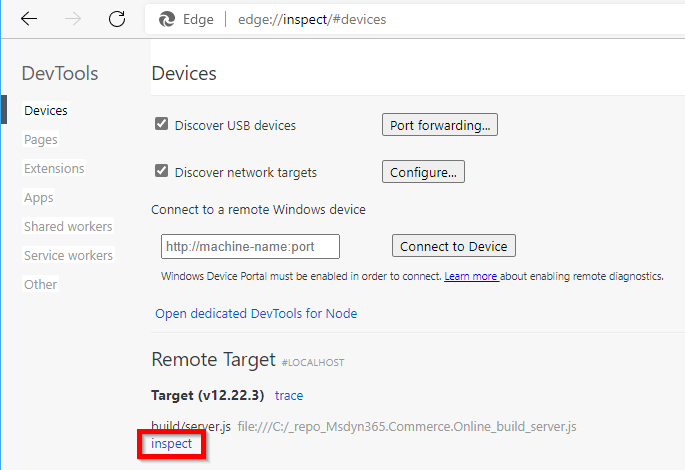
In a browser, open the browser inspect tool. For example, in Microsoft Edge, go to edge://inspect/#devices. After the build/server.js path appears under Remote Target, select the inspect link. (The inspect link can take up to 30 seconds to appear.) The following illustration shows an example.
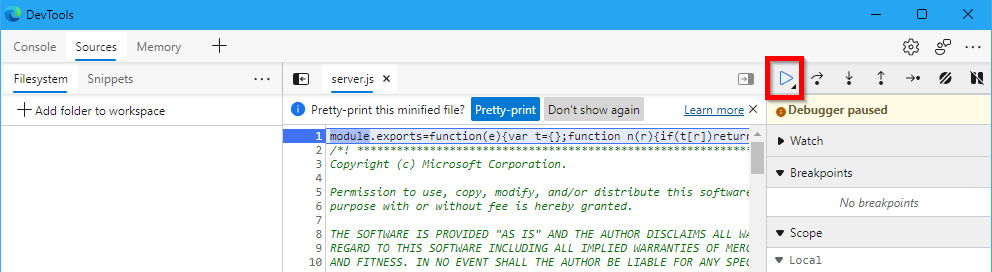
A DevTools windows should appear, and the debugger should be in a paused state. To run the code, select the Resume script execution button. The following illustration shows an example.
Establish a server startup heap memory baseline
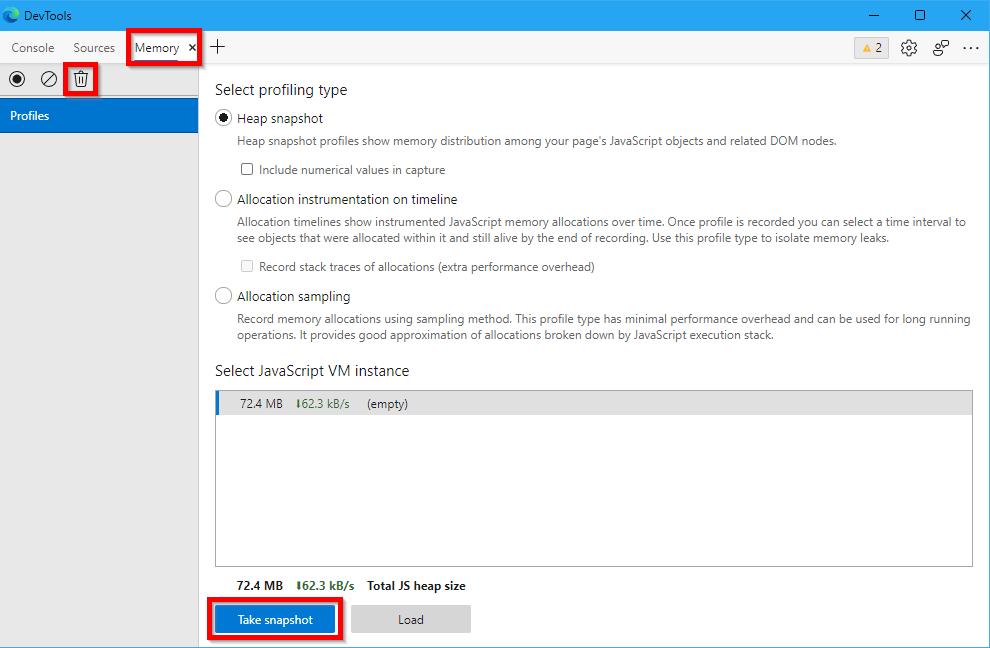
To take a baseline heap memory snapshot after server startup, select the Memory tab in the DevTools window, select the Collect garbage button (trash can symbol) to run the garbage collection, and then select Take snapshot. The following illustration shows an example.
Take a memory snapshot for a page
To take a memory snapshot for a page, open a new browser window, and go to the page mock that you're testing. For example, for a page mock that has the file name my-test-page.json, use the URL https://localhost:4000/page?mock=my-test-page. Next, run the garbage collection, and then take another snapshot. This snapshot will be your baseline memory usage for the page that you're testing.
Note
All page requests involve some level of caching. Therefore, it's expected that memory usage will be slightly increased.
Test for memory leaks
At this point, you can use benchmarking load tools to create more URL hits to the page that you're testing. Next, run the garbage collection, and then take another heap snapshot. Aside from some data load for caching, memory usage should decrease to the page's baseline memory usage that you obtained in the previous step. You can repeat this testing several times to ensure that memory usage is decreasing. If memory usage isn't decreasing, there might be objects that the garbage collection can't clear. In this case, you will see the heap grow after each run. You can then examine your custom code for any memory leaks that are causing this issue.
Additional resources
Best practices for Dynamics 365 Commerce development
Dynamics 365 Commerce online SDK FAQ
Debugging best practices for Dynamics 365 Commerce development