Note
Access to this page requires authorization. You can try signing in or changing directories.
Access to this page requires authorization. You can try changing directories.
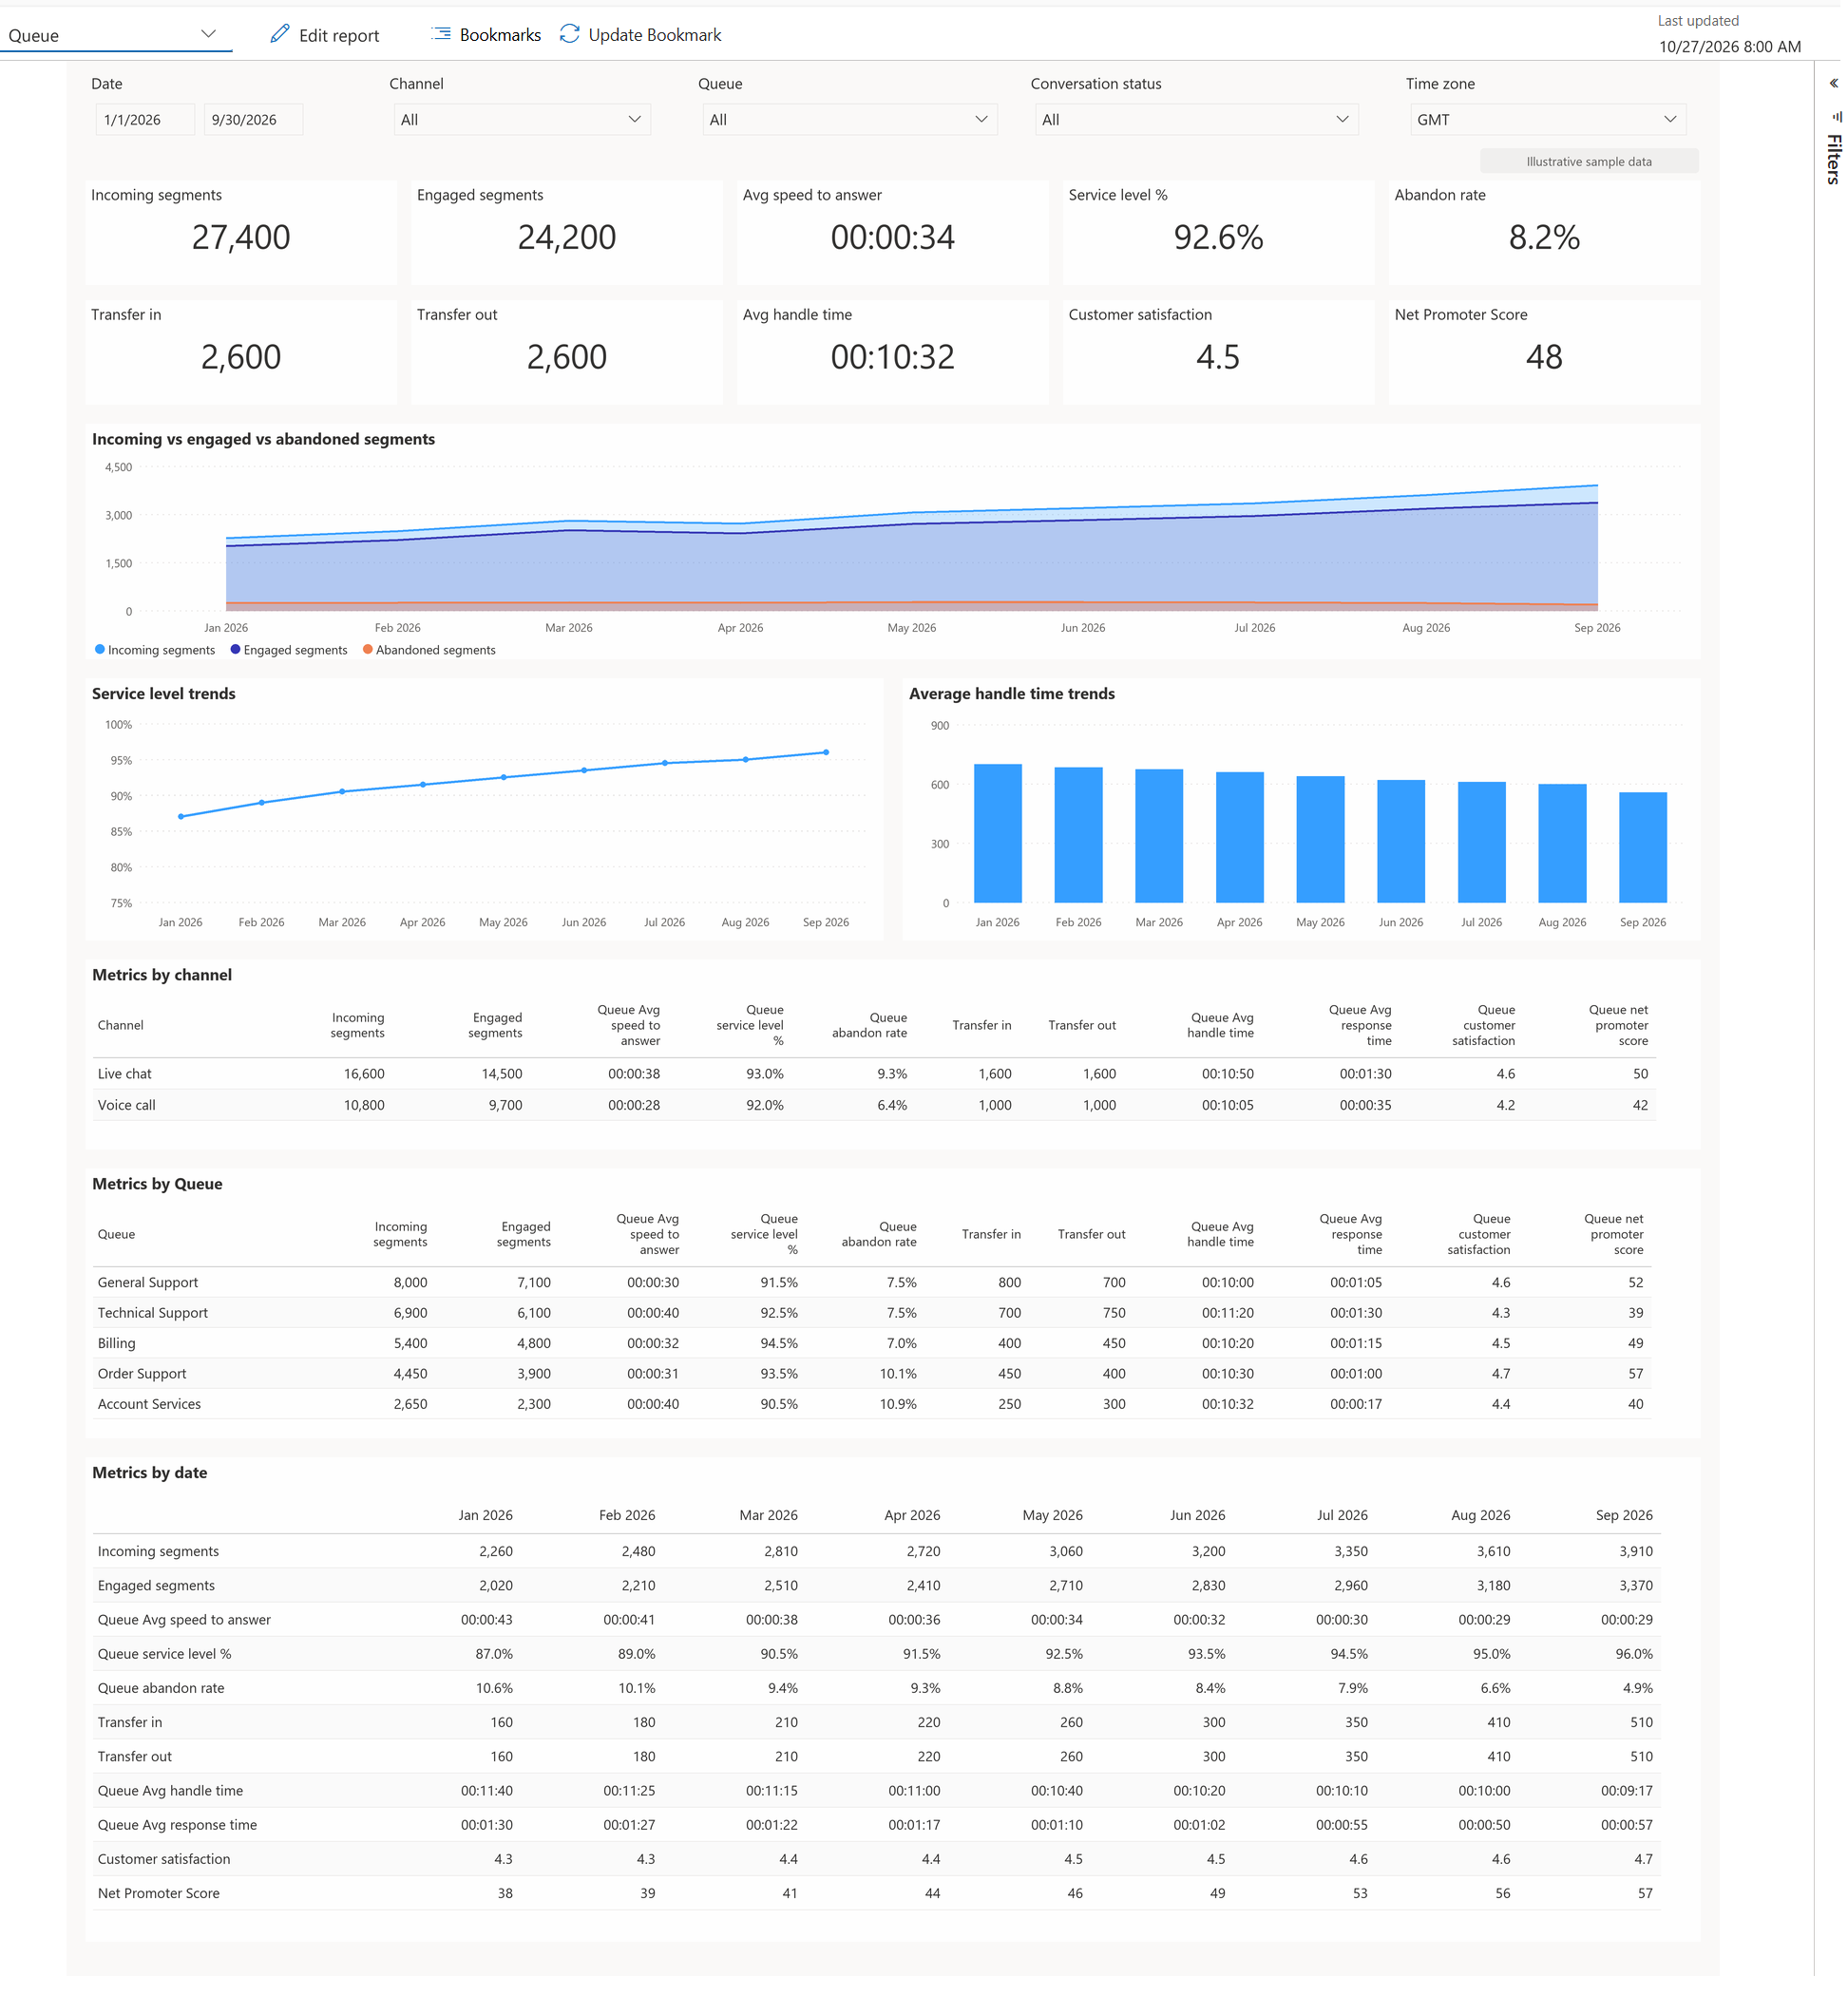
Use the Queue dashboard to review how customer interactions move through contact center queues. Supervisors and managers can monitor queue workload, service efficiency, abandonment trends, transfer activity, and customer experience across channels and queues.
A queue segment is the portion of a customer interaction associated with a specific queue. One conversation can generate multiple segments. For example, when a conversation enters one queue and then transfers to another, each queue association is recorded as a separate segment.
Review queue volume, service levels, wait times, transfers, and customer satisfaction to understand how work moves through each queue. Supervisors can use these queue-specific measurements to identify bottlenecks, evaluate staffing effectiveness, and improve service performance.
Data source
The Queue Segments dashboard uses AggQueuePerformance. Learn more in AggQueuePerformance table reference.
For a complete view of operational performance and customer experience across the contact center, combine queue segment analytics with other dashboards, such as:
- Conversation analytics.
- Agent analytics.
- Channel analytics.
- Customer satisfaction analytics.
Filter the dashboard
Filter the dashboard to focus on the queue segment data you want to review.
| Filter | Description |
|---|---|
| Date | Select a predefined or custom date range. |
| Channel | Filter metrics by communication channel. |
| Queue | View metrics for one queue or all queues. |
| Conversation status | Filter data by conversation status. |
| Time zone | Display metrics in the selected time zone. |
Key performance indicators
Review these high-level metrics for a summary of queue segment performance.
| Metric | Description |
|---|---|
| Incoming segments | Counts all queue segments received during the selected period. |
| Engaged segments | Counts queue segments accepted and handled. |
| Average speed to answer | Measures the average wait from queue entry until a queue segment was answered. |
| Service level % | Percentage of queue segments answered within the configured service-level target. |
| Abandon rate | Shows the percentage of queue segments abandoned before being answered. |
| Transfer in | Counts queue segments transferred into a queue from another queue. |
| Transfer out | Counts queue segments transferred from a queue to another queue. |
| Average handle time | Measures the average time spent handling queue segments. |
| Customer satisfaction | Measures the average customer satisfaction (CSAT) score associated with queue segments. |
| Net promoter score | Measures the average Net Promoter Score (NPS) associated with queue segments. |
Review visualizations
Use the visualizations to monitor queue demand, service performance, and operational efficiency over time. Identify trends, evaluate routing and staffing effectiveness, and investigate changes in queue performance.
| Visualization | Metrics | Description | Use this visualization to |
|---|---|---|---|
| Incoming vs engaged vs abandoned segments | Incoming segments, Engaged segments, Abandoned segments | Compares incoming, engaged, and abandoned queue segments over time. | - Monitor queue demand trends. - Compare handled and abandoned segments. - Identify changes in queue performance over time. - Assess staffing and routing effectiveness. |
| Service level trends | Service level | Shows service-level performance over time. | - Monitor adherence to service-level objectives. - Identify periods of reduced service performance. - Evaluate the impact of staffing, routing, and operational changes. |
| Average handle time trends | Average handle time | Shows changes in queue segment handling duration over time. | - Identify increases in interaction complexity. - Monitor service representative efficiency. - Evaluate operational performance across queues. |
Metrics by channel
Use Metrics by channel to review how each channel processes queue segments and identify channel-specific performance trends. Use the table to:
- Compare queue performance across channels.
- Identify channels with high abandonment rates.
- Analyze queue wait times and handling efficiency.
- Monitor customer satisfaction trends by channel.
| Metric | Description |
|---|---|
| Incoming Segments | Counts queue segments received through the channel. |
| Engaged Segments | Counts queue segments accepted and handled through the channel. |
| Queue Average Speed to Answer | Measures the average wait before queue segments were answered. |
| Queue Service Level % | Percentage of queue segments answered within the configured service-level target. |
| Queue Abandon Rate | Shows the percentage of queue segments abandoned before being answered. |
| Transfer In | Counts queue segments transferred into queues within the channel. |
| Transfer Out | Counts queue segments transferred out of queues within the channel. |
| Queue Average Handle Time | Measures the average time spent handling queue segments within the channel. |
| Queue Average Response Time | Average time taken to provide a response after a queue segment is assigned. |
| Queue Customer Satisfaction | Measures the average CSAT score associated with queue segments for the channel. |
| Queue Net Promoter Score | Measures the average NPS associated with queue segments for the channel. |
Metrics by queue
A queue segment represents work within a specific queue. Use Metrics by queue to assess each queue's effectiveness and:
- Compare queue performance.
- Identify queues with long wait times.
- Monitor abandonment trends.
- Analyze transfer activity between queues.
- Evaluate queue-specific customer satisfaction performance.
| Metric | Description |
|---|---|
| Incoming Segments | Counts queue segments received by the queue. |
| Engaged Segments | Counts queue segments accepted and handled in the queue. |
| Queue Average Speed to Answer | Measures the average wait before queue segments were answered. |
| Queue Service Level % | Percentage of queue segments answered within the service-level target. |
| Queue Abandon Rate | Shows the percentage of queue segments abandoned while waiting in the queue. |
| Transfer In | Counts queue segments transferred into the queue. |
| Transfer Out | Counts queue segments transferred out of the queue. |
| Queue Average Handle Time | Measures the average time spent handling queue segments in the queue. |
| Queue Average Response Time | Average response time after assignment to a service representative. |
| Queue Customer Satisfaction | Measures the average CSAT score associated with queue segments in the queue. |
| Queue Net Promoter Score | Measures the average NPS associated with queue segments in the queue. |
Metrics by date
Use Metrics by date to review daily queue segment performance for the selected period.
Use this section to:
- Analyze daily trends.
- Identify operational spikes and bottlenecks.
- Monitor the impact of staffing and routing changes.
- Evaluate service performance over time.
Personalize your dashboard
Save filtered views as bookmarks. Customize visualizations, metrics, filters, and layouts to focus on the data most relevant to your organization. Learn more in Manage bookmarks for reports and Customize visual display.