Note
Access to this page requires authorization. You can try signing in or changing directories.
Access to this page requires authorization. You can try changing directories.
Applies to: Dynamics 365 Customer Service and Dynamics 365 Contact Center—standalone only
Use the embedded Power BI editor to customize the visual display of analytics reports in Dynamics 365 Customer Service. This article shows you how to modify existing visualizations, add new metrics, apply data filters, and create custom layouts that align with your organizational requirements.
Customize your experience with these capabilities:
- Reveal relevant metrics: Show out-of-the-box metrics that matter most to your organization
- Transform data displays: Change tabular views to trend graphics and other visual formats
- Create focused views: Add new pivots and pages for specific queues or teams
- Personalize layouts: Rearrange report layouts and apply custom themes
You can customize the Customer Service historical, Omnichannel historical, Omnichannel real-time analytics, and Real-time analytics for record routing reports in the Copilot Service workspace app. You can't customize unified routing and knowledge analytics reports.
You don't need any licenses to customize the Customer Service historical, Omnichannel historical, and Omnichannel real-time analytics reports embedded in Copilot Service workspace.
Note
- After you customize and publish a report, all customizations become visible to all users in your organization.
- You can also build new reports and new metrics using the out-of-the-box data model. Learn more in Overview of data model customization.
Prerequisites
- To edit analytics reports, users must have the Analytics Report Author role. Learn more in Assign roles to users.
Customize the display of analytics reports
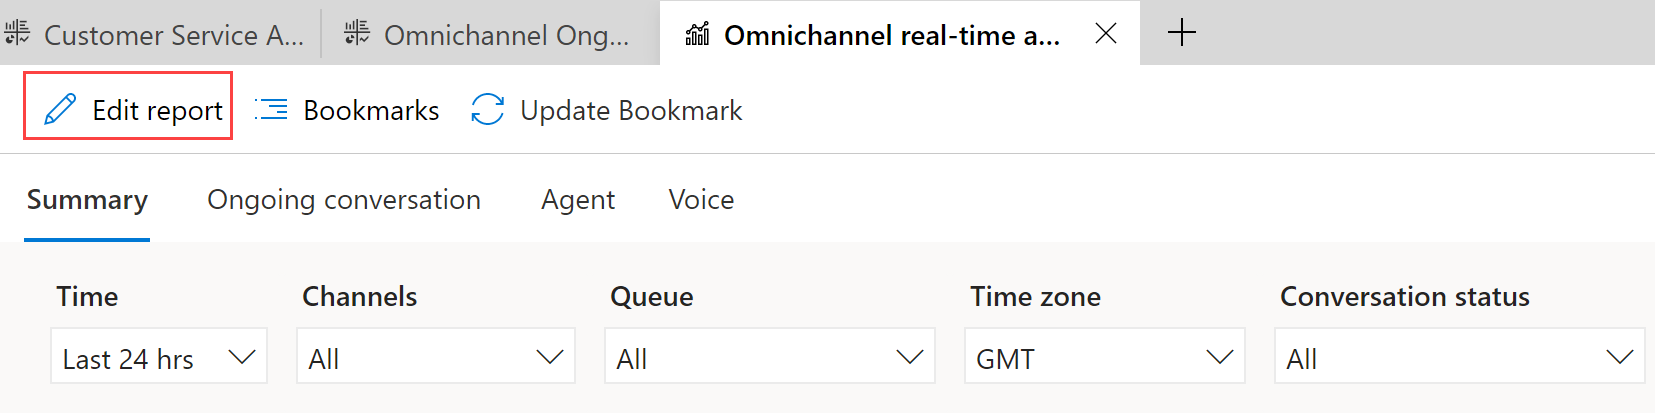
In Copilot Service workspace, open the Omnichannel real-time analytics, Omnichannel historical analytics, or Customer Service historical analytics report.
Select Edit report to open the embedded Power BI editor.
Use the following panes to customize the report:
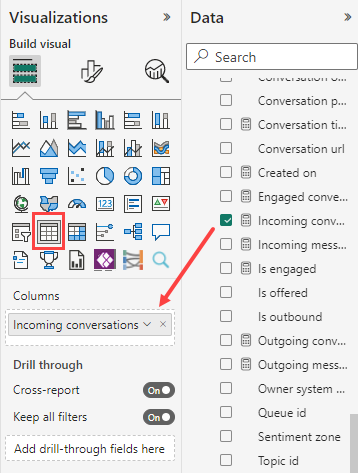
Visualizations: Select the visualizations you want in your report. You can delete a currently displayed visualization and add the one you prefer. For example, you can show Incoming conversations over time as a table instead of the default bar chart.
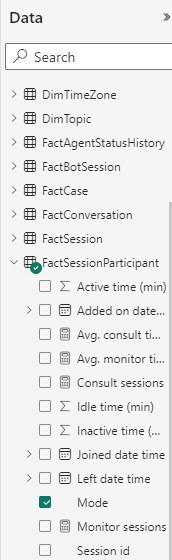
Data: Select the KPIs, measures, dimensions, and attributes you want to show in your report. The list includes all the metrics that are available for use, not just the ones that are displayed in the out-of-the-box reports. For example, you can use the Participation Mode metric in FactSessionParticipant to count the number of times a subject matter expert accepted a consult request. Learn more in Understand the out-of-the-box data model.
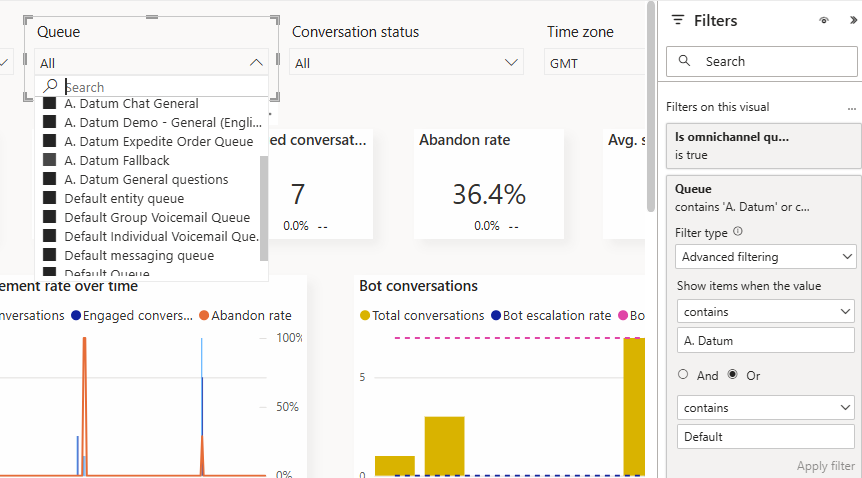
Filters: Use Advanced filtering to select the queues that you want to filter your reports by. In the out-of-the-box Omnichannel real-time analytics or Omnichannel historical analytics reports, select Advanced filtering, with the Or option to add multiple conditions for filtering.
When you're done selecting the customizations you want for your report, select Save and then Publish.
To revert all your changes to the original report settings, select Edit report > Checkout default report > Reset.
Important
If you select Reset, any customizations that you made are permanently removed.
To continue editing the report after you publish it, select Resume editing.
Note
Don't add more than 20 metrics or tiles to a report because it affects the report's performance. If you need more metrics, consider creating more pages and provide links to the extra pages from the existing pages.
Understand the out-of-the-box data model
The out-of-the-box data model consists of facts and dimensions. Facts represent the data you want to analyze. Dimensions represent the attributes of the data that you want to break down to explore further.
Fact tables organize key KPIs logically. For example, FactConversation has conversation metrics like Average handle time and Average conversation talk time, while FactAgent has Agent metrics.
You can use facts and dimensions to visualize data according to your organizational requirements. If you want to understand how average handle time varies by queue, create a visualization like a bar chart, and divide the fact FactConversation > Average Handle Time by the dimension DimQueue > Queue Name.
Data model updates
If you customize your reports and then Microsoft changes the default data model for a report, the data model updates don't overwrite your customizations. However, if the naming conventions in the Power BI embedded editing experience change, those changes are reflected in the respective list. You may need to reselect the metric with the new name. Learn more about data models and report mappings for historical analytics reports in Customer Service.
Related information
Getting started: Introduction to Customer Service Insights
Initial setup: Configure Customer Service analytics and insights
Advanced reporting: Configure Customer Service Analytics dashboards in Power BI
Channel-specific analytics: Configure Omnichannel historical analytics