Note
Access to this page requires authorization. You can try signing in or changing directories.
Access to this page requires authorization. You can try changing directories.
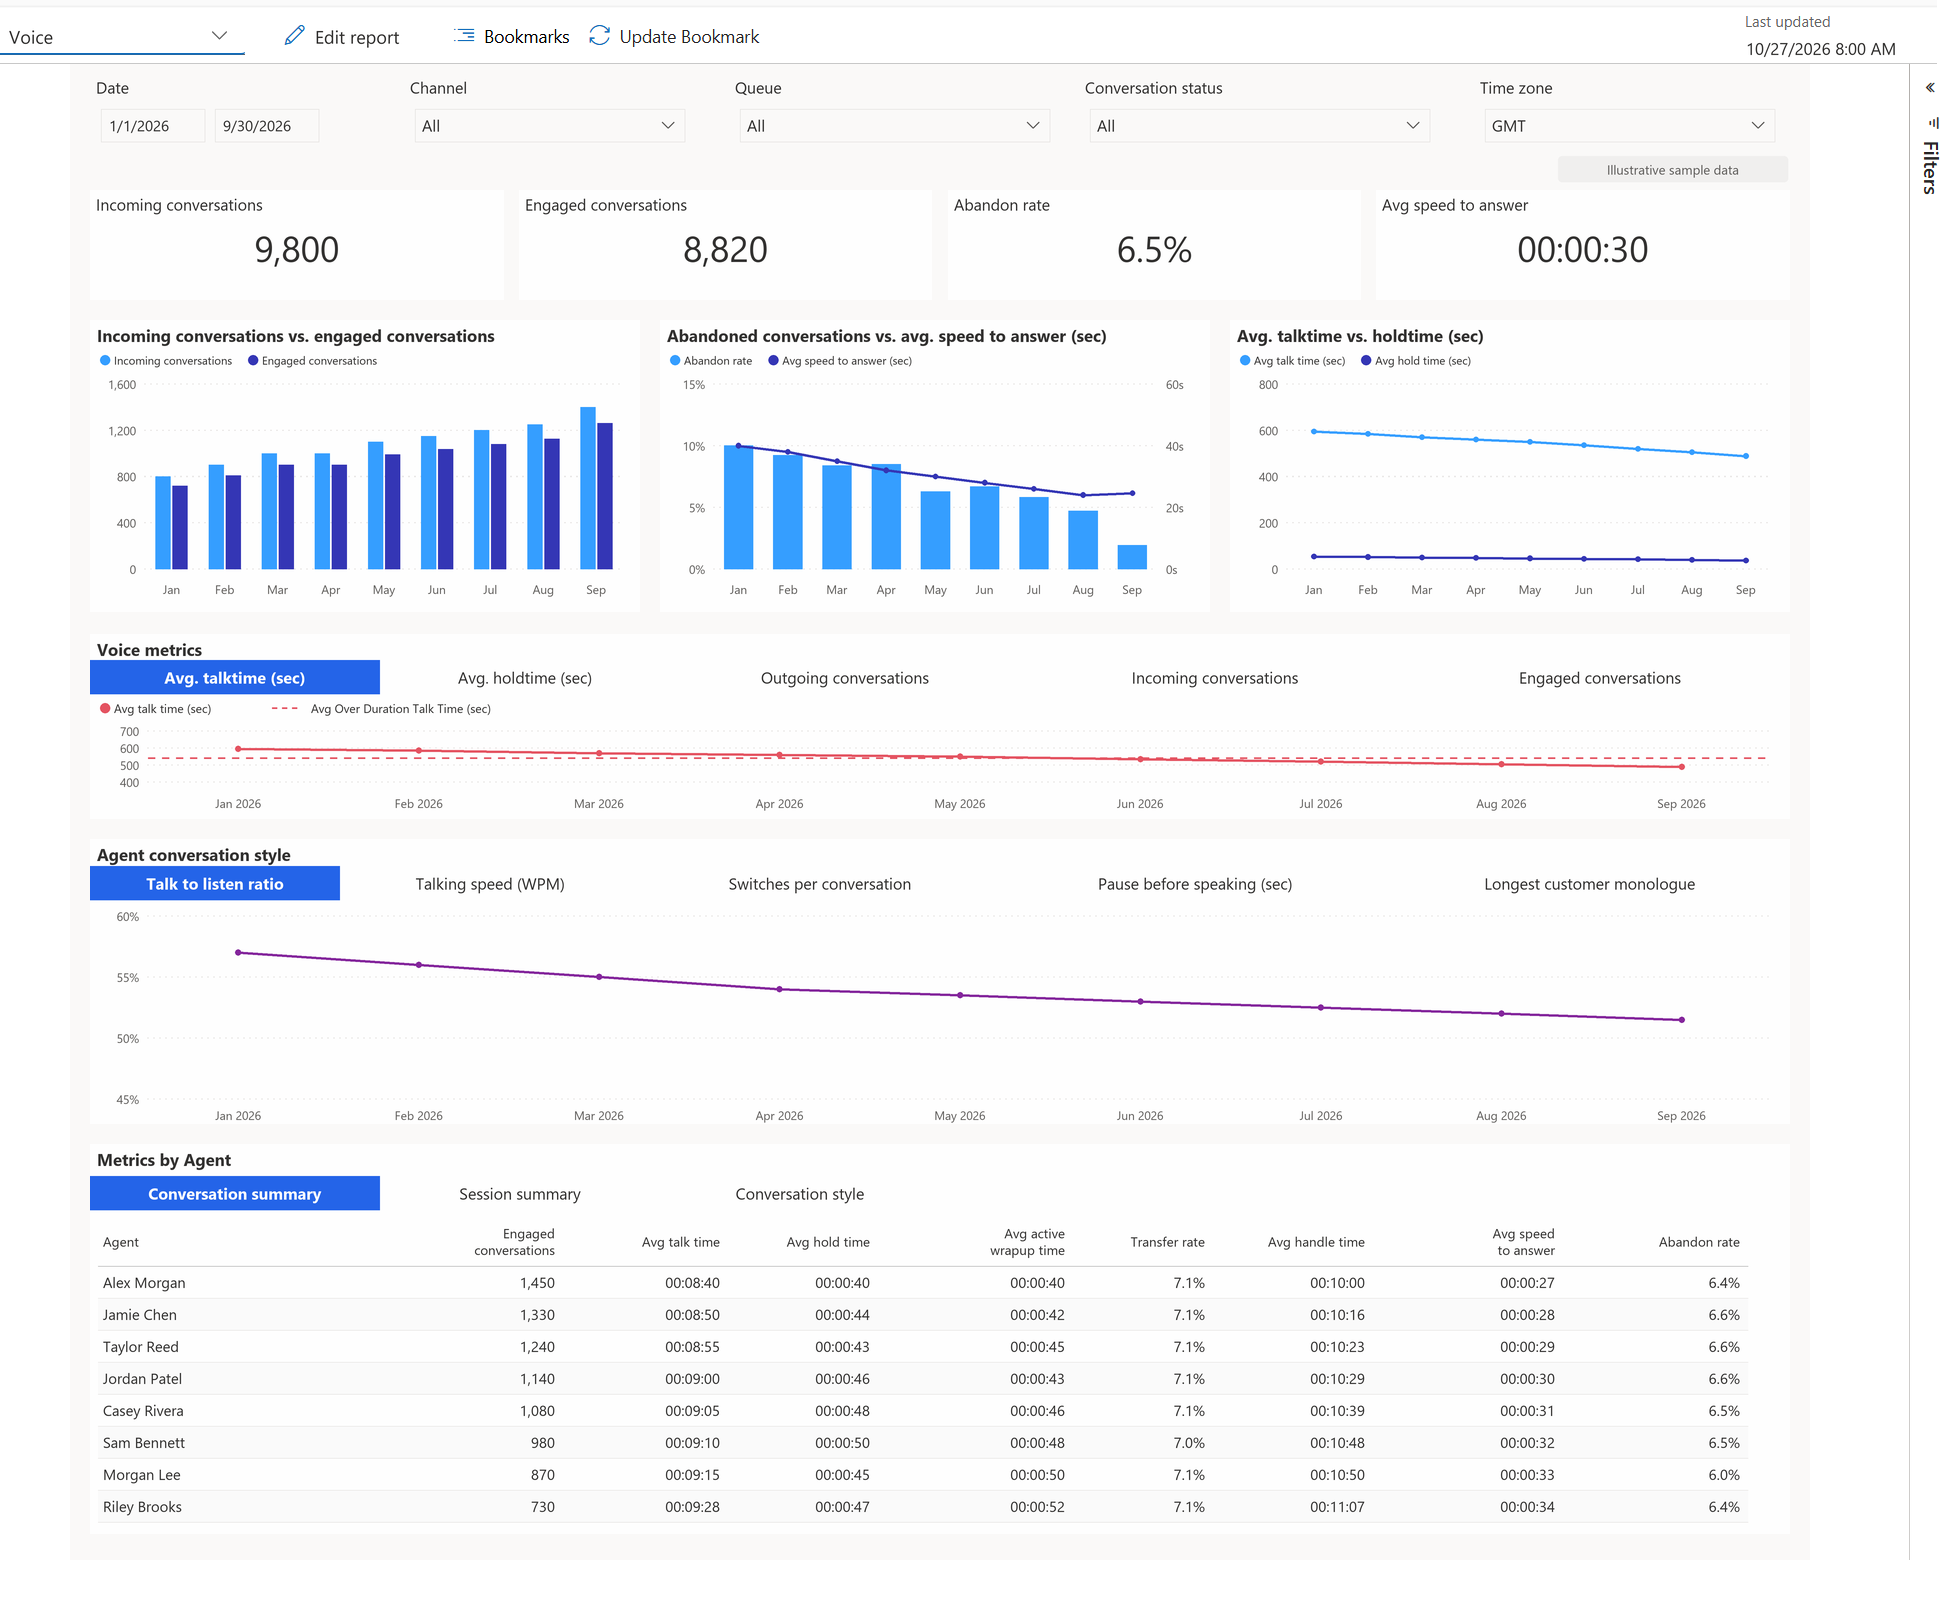
Use the Voice dashboard to monitor voice-channel performance in Contact Center historical analytics. Supervisors and managers can review incoming and engaged voice conversations, abandonment, speed to answer, talk time, hold time, session outcomes, and voice conversation style metrics.
Voice conversations are customer interactions through the voice channel. The dashboard combines conversation-level, session-level, queue-level, and agent-level views to help supervisors assess voice workload, service efficiency, handling patterns, and conversation quality signals.
Data sources
The Voice dashboard uses three aggregate tables in the Shared Analytics Platform data model:
AggConversationprovides conversation counts, outcomes, and time metrics, including conversation summaries by service representative and queue.AggAgentPerformanceprovides session counts, outcomes, and handling metrics, including session summaries by service representative and queue.AggVoiceConversationInsightsprovides conversation style metrics, such as talking speed and talk-to-listen ratio.
Learn more in AggAgentPerformance table reference and AggVoiceConversationInsights table reference.
Filter the dashboard
Filter the dashboard to focus on the voice analytics data you want to review.
| Filter | Description |
|---|---|
| Date | Select a predefined or custom date range. |
| Channel | Filter metrics by communication channel. |
| Queue | View metrics for one queue or all queues. |
| Agent | Filter metrics by service representative. |
| Conversation Status | Filter data by conversation status. |
| TimeZoneCode | Display metrics in the selected time zone. |
Key performance indicators
Review these high-level KPIs for a summary of voice conversation performance under the selected filters.
| Metric | Description |
|---|---|
| Incoming conversations | Counts inbound voice conversations that customers initiate and offer for handling. |
| Engaged conversations | Counts voice conversations that a service representative accepts and handles. |
| Abandon rate | Percentage of incoming voice conversations that customers abandon before engagement. |
| Avg speed to answer | Average queue wait before a service representative accepts a voice conversation. |
Review visualizations
Use the visualizations to monitor conversation demand, engagement, customer wait times, and voice handling patterns. Identify operational trends, evaluate service performance, and investigate customer experience changes over time.
| Visualization | Description | Use this visualization to |
|---|---|---|
| Incoming conversations vs. engaged conversations | Compares incoming and engaged voice conversations over time. | - Monitor voice conversation demand. - Compare offered conversations with those accepted by service representatives. - Identify changes in voice engagement trends over time. |
| Abandoned conversations vs. average speed to answer | Compares abandoned voice conversations with average speed to answer. | - Assess whether abandonment trends align with wait-time changes. - Identify periods when customers waited longer to connect with a service representative. - Review possible staffing, routing, or queue bottlenecks for the voice channel. |
| Average talk time vs. hold time | Compares average talk and hold times for voice conversations. | - Compare time spent actively speaking with customers and time placing them on hold. - Identify increases in hold time that might indicate process delays or research time. - Review voice handling patterns over time. |
Voice metrics
Use Voice metrics to review trends for selected voice conversation metrics.
| Metric | Description |
|---|---|
| Avg. talktime | Average voice talk time for engaged conversations. |
| Avg. holdtime | Average customer hold time during engaged voice conversations. |
| Outgoing conversations | Counts agent-initiated outbound voice conversations. |
| Incoming conversations | Counts inbound voice conversations initiated by customers. |
| Engaged conversations | Counts voice conversations that a service representative accepts and handles. |
Review these trends to analyze voice activity and identify changes in customer demand, agent engagement, talk time, and hold time.
Agent conversation style
Use Agent conversation style to review voice-specific behavioral metrics generated from conversation intelligence.
| Metric | Description |
|---|---|
| Talk to listen ratio | Average ratio of service representative talk time to customer talk time. |
| Talking speed (WPM) | Average number of words spoken per minute. |
| Switches per conversation | Average number of speaker switches between the customer and the service representative. |
| Pause before speaking | Average pause before the service representative's response to the customer. |
| Longest customer monologue | Average duration of the longest uninterrupted customer speech. |
| Avg listening ratio | Average share of speaking time where the service representative was listening. |
Review these metrics for conversation style patterns and voice-interaction coaching opportunities.
Metrics by agent
Use Metrics by agent to review voice conversation and session metrics grouped by service representative. Choose from three tabs: Conversation summary, Session summary, and Conversation style.
Conversation summary
On Conversation summary, compare voice conversation performance, handling, and outcomes across service representatives.
| Metric | Description |
|---|---|
| Agent | Name of the service representative. |
| Engaged Conversations | Counts voice conversations handled by the service representative. |
| Avg Talk Time | Average talk time for engaged voice conversations. |
| Avg Hold Time | Average hold time for engaged voice conversations. |
| Avg Active Wrapup Time | Average active wrap-up time after voice conversations. |
| Transfer Rate | Percentage of incoming voice conversations that were transferred. |
| Avg Handle Time | Average handling duration for engaged voice conversations. |
| Avg Speed to Answer | Average customer wait before the conversation was accepted. |
| Abandon Rate | Percentage of incoming voice conversations abandoned before engagement. |
Session summary
On Session summary, review session-level voice metrics by service representative. Compare acceptance, rejection, timeout, transfer, and handling patterns.
| Metric | Description |
|---|---|
| Agent | Name of the service representative. |
| Total Sessions | Counts all sessions associated with the service representative. |
| Accepted Sessions | Counts sessions accepted by the service representative. |
| Rejected Sessions | Counts sessions rejected by the service representative. |
| Timed Out Sessions | Counts sessions that timed out before acceptance. |
| Transfer Rate (Agent) | Percentage of handled sessions transferred by the service representative. |
| Agent Avg Handle Time | Average time the service representative spent handling sessions. |
Conversation style
On Conversation style, review conversation style and coaching-oriented voice metrics by service representative.
| Metric | Description |
|---|---|
| Agent | Name of the service representative. |
| Talk to listen ratio | Average ratio of service representative talk time to customer talk time. |
| Talking speed (WPM) | Average number of words spoken per minute. |
| Switches per conversation | Average number of speaker switches between the customer and the service representative. |
| Pause before speaking | Average pause before the service representative's response to the customer. |
| Longest customer monologue | Average duration of the longest uninterrupted customer speech. |
| Avg listening ratio | Average share of speaking time where the service representative was listening. |
Metrics by queue
Use Metrics by queue to review voice conversation and session metrics grouped by queue. Choose from two tabs: Conversation summary and Session summary.
Conversation summary
On Conversation summary, compare voice conversation performance across queues: demand, abandonment, speed to answer, talk time, hold time, transfer rate, and handle time.
| Metric | Description |
|---|---|
| Queue | Name of the queue. |
| Incoming Conversations | Counts inbound voice conversations offered to the queue. |
| Engaged Conversations | Counts voice conversations accepted and handled from the queue. |
| Abandon Rate | Percentage of incoming voice conversations abandoned before engagement. |
| Avg Speed to Answer | Average customer wait before the voice conversation was accepted. |
| Avg Talk Time | Average talk time for engaged voice conversations in the queue. |
| Avg Hold Time | Average hold time for engaged voice conversations in the queue. |
| Transfer Rate | Percentage of voice conversations transferred from the queue. |
| Avg Handle Time | Average handling duration for engaged voice conversations in the queue. |
Session summary
On Session summary, compare voice session acceptance, rejection, timeout, transfer, and handling across queues.
| Metric | Description |
|---|---|
| Queue | Name of the queue. |
| Total Sessions | Counts all sessions associated with the queue. |
| Accepted Sessions | Counts sessions accepted from the queue. |
| Rejected Sessions | Counts sessions rejected from the queue. |
| Timed Out Sessions | Counts sessions that timed out before acceptance. |
| Transfer Rate (Agent) | Percentage of handled sessions transferred by service representatives. |
| Agent Avg Handle Time | Average time service representatives spent handling sessions from the queue. |
Personalize your dashboard
Save filtered views as bookmarks. Customize visualizations, metrics, filters, and layouts to focus on the data most relevant to your organization. Learn more in Manage bookmarks for reports and Customize visual display.