Predict customer lifetime value (CLV)
Predict potential value (revenue) that individual active customers will bring in to your business through a defined future time period. This prediction helps you:
- Identify high-value customers and process this insight.
- Create strategical customer segments based on their potential value to run personalized campaigns with targeted sales, marketing, and support efforts.
- Guide product development by focusing on features that increase customer value.
- Optimize sales or marketing strategy and allocate budget more accurately for customer outreach.
- Recognize and reward high-value customers through loyalty or rewards programs.
Determine what CLV means for your business. We support transaction-based CLV prediction. The predicted value of a customer is based on the history of business transactions. Consider creating several models with varying input preferences and compare model results to see which model scenario best fits your business needs.
Tip
Try the CLV prediction using sample data: Customer lifetime value (CLV) prediction sample guide.
Prerequisites
- At least Contributor permissions
- At least 1,000 customer profiles within the desired prediction window
- Customer Identifier, a unique identifier to match transactions to an individual customer
- At least one year of transaction history, preferably two to three years. Ideally, at least two to three transactions per customer ID, preferably across multiple dates. Transaction history must include:
- Transaction ID: Unique identifier of each transaction
- Transaction date: Date or time stamp of each transaction
- Transaction amount: Monetary value (for example, revenue or profit margin) of each transaction
- Label assigned to returns: Boolean true/false value signifying whether the transaction is a return
- Product ID: Product ID of product involved in the transaction
- Data about customer activities:
- Primary key: Unique identifier for an activity
- Timestamp: Date and time of the event identified by the primary key
- Event (activity name): Name of event you want to use
- Details (amount or value): Details about the customer activity
- Additional data such as:
- Web activities: Website visit history or email history
- Loyalty activities: Loyalty reward points accrual and redemption history
- Customer service log: Service call, complaint, or return history
- Customer profile information
- Less than 20% missing values in required fields
Note
Only one transaction history table can be configured. If there are multiple purchase or transaction tables, combine them in Power Query before data ingestion.
Create a Customer Lifetime Value prediction
Select Save draft at any time to save the prediction as a draft. The draft prediction displays in the My predictions tab.
Go to Insights > Predictions.
On the Create tab, select Use model on the Customer lifetime value tile.
Select Get started.
Name this model and the Output table name to distinguish them from other models or tables.
Select Next.
Define model preferences
Set a Prediction time period to define how far into the future you want to predict the CLV. By default, the unit is set as months.
Tip
To accurately predict CLV for the set time period, a comparable period of historical data is required. For example, if you want to predict CLV for the next 12 months, have at least 18 – 24 months of historical data.
Set the time frame in which a customer must have had at least one transaction to be considered active. The model only predicts CLV for Active customers.
- Let model calculate purchase interval (recommended): Model analyzes your data and determines a time period based on historical purchases.
- Set interval manually: Time period for your definition of an active customer.
Define the percentile of High-value customer.
- Model calculation (recommended): Model uses 80/20 rule. The percentage of customers that contributed to 80% cumulative revenue for your business in the historical period are considered high-value customers. Typically, less than 30-40% customers contribute to 80% cumulative revenue. However, this number might vary depending on your business and industry.
- Percent of top active customers: Specific percentile for a high-value customer. For example, enter 25 to define high-value customers as the top 25% of future paying customers.
If your business defines high value customers in a different way, let us know as we would love to hear.
Select Next.
Add required data
Select Add data for Customer transaction history.
Select the semantic activity type, SalesOrder or SalesOrderLine, that contains the transaction history. If the activity has not been set up, select here and create it.
Under Activities, if the activity attributes were semantically mapped when the activity was created, choose the specific attributes or table you'd like the calculation to focus on. If semantic mapping did not occur, select Edit and map your data.

Select Next and review the attributes required for this model.
Select Save.
Add more activities or select Next.
Add optional activity data
Data reflecting key customer interactions (like web, customer service, and event logs) adds context to transaction records. More patterns found in your customer activity data can improve the accuracy of the predictions.
Select Add data under Boost model insights with additional activity data.
Select an activity type that matches the type of customer activity you're adding. If the activity has not been set up, select here and create it.
Under Activities, if the activity attributes were mapped when the activity was created, choose the specific attributes or table you'd like the calculation to focus on. If mapping did not occur, select Edit and map your data.
Select Next and review the attributes required for this model.
Select Save.
Select Next.
Add optional customer data or select Next and go to Set update schedule.
Add optional customer data
Select from 18 commonly used customer profile attributes to include as an input to the model. These attributes can lead to more personalized, relevant, and actionable model results for your business use cases.
For example: Contoso Coffee wants to predict customer lifetime value to target high value customers with a personalized offer related to the launch of their new espresso machine. Contoso uses the CLV model and adds all 18 customer profile attributes to see which factors influence their highest value customers. They find customer location is the most influential factor for these customers. With this information, they organize a local event for the launch of the espresso machine and partner with local vendors for personalized offers and a special experience at the event. Without this information, Contoso might have only sent generic marketing emails and missed the opportunity to personalize for this local segment of their high value customers.
Select Add data under Boost model insights even further with additional customer data.
For Table, choose Customer : CustomerInsights to select the unified customer profile that maps to customer attribute data. For Customer ID, choose System.Customer.CustomerId.
Map more fields if the data is available in your unified customer profiles.

Select Save.
Select Next.
Set update schedule
Choose the frequency to retrain your model based on the latest data. This setting is important to update the accuracy of predictions as new data is ingested. Most businesses can retrain once per month and get a good accuracy for their prediction.
Select Next.
Review and run the model configuration
The Review and run step shows a summary of the configuration and provides a chance to make changes before you create the prediction.
Select Edit on any of the steps to review and make any changes.
If you are satisfied with your selections, select Save and run to start running the model. Select Done. The My predictions tab displays while the prediction is being created. The process may take several hours to complete depending on the amount of data used in the prediction.
Tip
There are statuses for tasks and processes. Most processes depend on other upstream processes, such as data sources and data profiling refreshes.
Select the status to open the Progress details pane and view the progress of the tasks. To cancel the job, select Cancel job at the bottom of the pane.
Under each task, you can select See details for more progress information, such as processing time, the last processing date, and any applicable errors and warnings associated with the task or process. Select the View system status at the bottom of the panel to see other processes in the system.
View prediction results
Go to Insights > Predictions.
In the My predictions tab, select the prediction you want to view.
There are three primary sections of data within the results page.
Training model performance: Grades A, B, or C indicate the performance of the prediction and can help you make the decision to use the results stored in the output table.
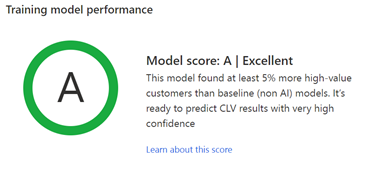
The system assesses how the AI model performed in predicting the high value customers as compared to a baseline model.
Grades are determined based on the following rules:
- A when the model accurately predicted at least 5% more high-value customers as compared to the baseline model.
- B when the model accurately predicted between 0-5% more high-value customers as compared to the baseline model.
- C when the model accurately predicted fewer high-value customers as compared to the baseline model.
Select Learn about this score to open the Model rating pane which shows further details about the AI model performance and the baseline model. It will help you better understand the underlying model performance metrics and how the final model performance grade was derived. The baseline model uses a non-AI based approach to calculate customer lifetime value based primarily on historical purchases made by customers.
Value of customers by percentile: Low-value and high-value customers display in a chart. Hover over the bars in the histogram to see the number of customers in each group and the average CLV of that group. Optionally, create segments of customers based on their CLV predictions.

Most influential factors: Various factors are considered when creating your CLV prediction based on the input data provided to the AI model. Each of the factors has their importance calculated for the aggregated predictions a model creates. Use these factors to help validate your prediction results. These factors also provide more insight about the most influential factors that contributed towards predicting CLV across all your customers.

Learn about the score
The standard formula used to calculate CLV by the baseline model:
CLV for each customer = Average monthly purchase made by the customer in the active customer window * Number of months in the CLV prediction period * Overall retention rate of all customers
The AI model is compared to the baseline model based on two model performance metrics.
Success rate in predicting high-value customers
See the difference in predicting high-value customers using the AI model compared to the baseline model. For example, 84% success rate means that out of all the high-value customers in the training data, the AI model was able to accurately capture 84%. We then compare this success rate with the success rate of the baseline model to report the relative change. This value is used to assign a grade to the model.
Error metrics
See the overall performance of the model in terms of error in predicting future values. We use the overall Root Mean Squared Error (RMSE) metric to assess this error. RMSE is a standard way to measure the error of a model in predicting quantitative data. The AI model’s RMSE is compared to the RMSE of the baseline model and the relative difference is reported.
The AI model prioritizes the accurate ranking of customers according to the value they bring to your business. So only the success rate of predicting high-value customers is used to derive the final model grade. The RMSE metric is sensitive to outliers. In scenarios where you have a small percentage of customers with extraordinarily high purchase values, the overall RMSE metric might not give the full picture of the model performance.