Predict product recommendations (preview)
[This article is prerelease documentation and is subject to change.]
The product recommendation model creates sets of predictive product recommendations. Recommendations are based on previous purchase behavior and customers with similar purchase patterns. You must have business knowledge on the different types of products for your business and how your customers interact with them. We support recommending products that your customers have previously purchased or recommendations for new products.
The product recommendation model helps you:
- Recommend other products to go with a purchase
- Reach out to customers with products they might be interested in
- Improve discovery with other relevant products and services
- Create personalized customer experiences
Product recommendations might be subject to local laws and regulations and customer expectations, which the model isn't built to specifically take into account. Therefore, you must review the recommendations prior to delivering them to your customers to ensure you're complying with any applicable laws or regulations, and customer expectations for what you might recommend.
The output of this model provides recommendations based on the product ID. Your delivery mechanism must map the predicted product IDs to appropriate content for your customers to account for localization, image content, and other business-specific content or behavior.
For example, Contoso wants to increase their revenue by customizing webpages to show more products and services customers might enjoy. They're able to create customer-specific product recommendations from the product recommendation model and feed the data to their site. Contoso is able to upsell their customers by encouraging them to view products and services similar to ones they have purchased before, increasing revenue.
Tip
Try the product recommendation prediction using sample data: Product recommendation prediction sample guide.
Important
- This is a preview feature.
- Preview features aren't meant for production use and may have restricted functionality. These features are available before an official release so that customers can get early access and provide feedback.
Prerequisites
- At least Contributor permissions
- At least 1,000 customer profiles within the desired prediction window
- Customer Identifier, a unique identifier to match transactions to an individual customer
- At least one year of transactional data, preferably two to three years to include some seasonality. Ideally, at least three or more transactions per Customer ID. Transaction history must include:
- Transaction ID: Unique identifier of a purchase or transaction.
- Transaction date: Date of the purchase or transaction.
- Value of the transaction: Numerical value of the purchase or transaction.
- Unique product ID: ID of the product or service purchased if your data is at a line item level.
- Purchase or return: A boolean true/false value where true identifies that a transaction was a return. If the Purchase or Return data isn't provided in the model and the Value of the transaction is negative, we infer a return.
- A product catalog data table to use as a product filter.
Note
- The model requires the transaction history of your customers where transaction is any data that describes a user-product interaction. For example, purchasing a product, taking a class, or attending an event.
- Only one transaction history table can be configured. If there are multiple purchase tables, combine them in Power Query before data ingestion.
- If order and order details are different tables, join them before using in the model. The model doesn't work with only an order ID or receipt ID in a table.
Create a product recommendation prediction
Select Save draft at any time to save the prediction as a draft. The draft prediction displays in the My predictions tab.
Go to Insights > Predictions.
On the Create tab, select Use model on the Product recommendations (preview) tile.
Select Get started.
Name this model and the Output table name to distinguish them from other models or tables.
Select Next.
Define product recommendation preferences
Set the Number of products to recommend to a customer. This value depends on how your delivery method fills data.
Choose if you want to include products customers have previously purchased in the Repeat purchases expected field.
Set the Look back window with the time frame the model considers before recommending the product to the user again. For example, indicate a customer purchases a laptop every two years. The model looks at the purchase history for the last two years, and if it finds an item, the item is filtered from the recommendations.
Select Next
Add purchase history
Select Add data for Customer transaction history.
Select the semantic activity type SalesOrderLine that contains the required transaction or purchase history information. If the activity isn't set up, select here and create it.
Under Activities, if the activity attributes were semantically mapped when the activity was created, choose the specific attributes or table you'd like the calculation to focus on. If semantic mapping didn't occur, select Edit and map your data.
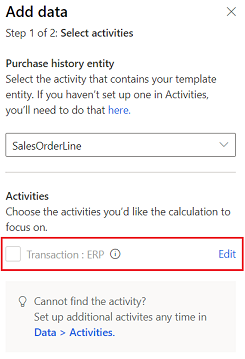
Select Next and review the attributes required for this model.
Select Save.
Select Next.
Add product information and filters
Sometimes, only certain products are beneficial or appropriate for the type of prediction you build. Use product filters to identify a subset of products with specific characteristics to recommend to your customers. The model uses all the products available to learn patterns but only use the products matching the product filter in its output.
Add your product catalog table that contains information for each product. Map the information required and select Save.
Select Next.
Select Product filters:
No filters: Use all products in the product recommendation prediction.
Define specific product filters: Use specific products in the product recommendation prediction. In the Product catalog attributes pane, select the attributes from your product catalog table that you want to include in the filter.
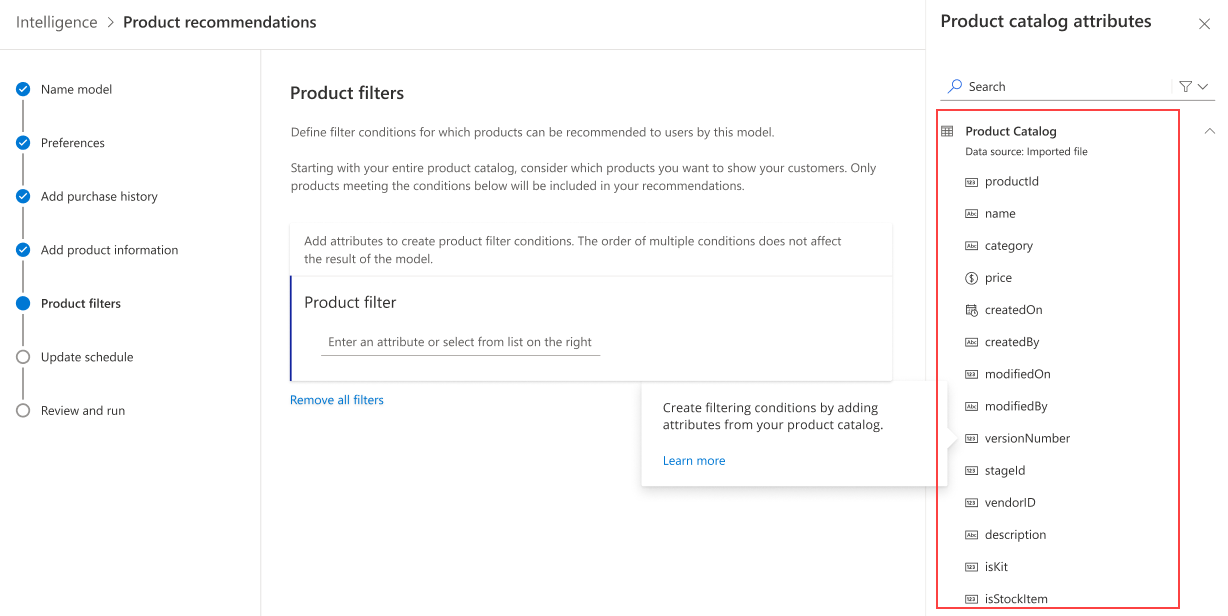
Choose if you want the product filter to use and or or to logically combine your selection of attributes from the product catalog.
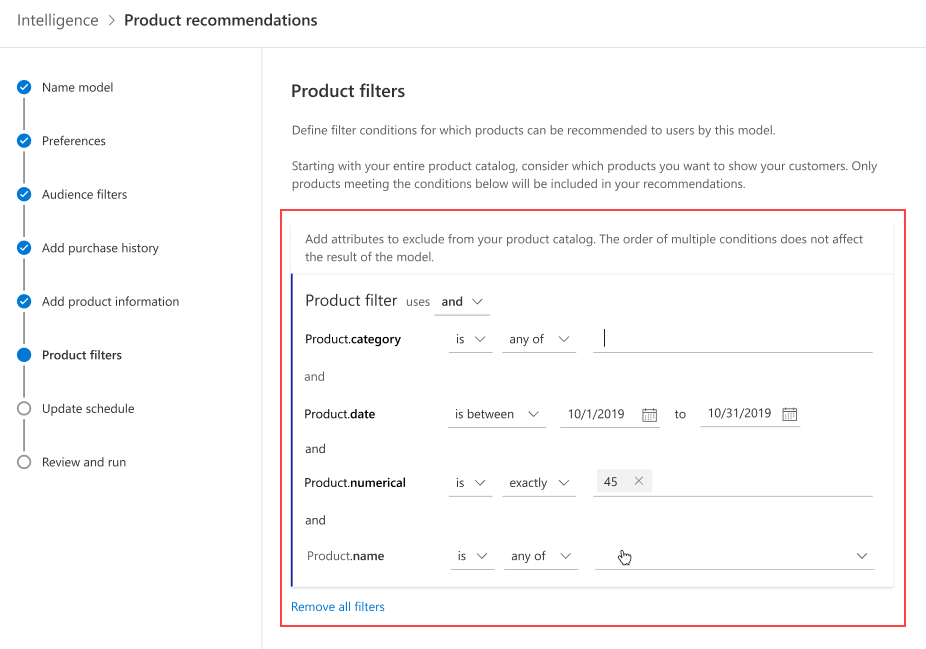
Select Next.
Set update schedule
Choose a frequency to retrain your model. This setting is important to update the accuracy of predictions as new data is ingested. Most businesses can retrain once per month and get a good accuracy for their prediction.
Select Next.
Review and run the model configuration
The Review and run step shows a summary of the configuration and provides a chance to make changes before you create the prediction.
Select Edit on any of the steps to review and make any changes.
If you're satisfied with your selections, select Save and run to start running the model. Select Done. The My predictions tab displays while the prediction is being created. The process might take several hours to complete depending on the amount of data used in the prediction.
Tip
There are statuses for tasks and processes. Most processes depend on other upstream processes, such as data sources and data profiling refreshes.
Select the status to open the Progress details pane and view the progress of the tasks. To cancel the job, select Cancel job at the bottom of the pane.
Under each task, you can select See details for more progress information, such as processing time, the last processing date, and any applicable errors and warnings associated with the task or process. Select the View system status at the bottom of the panel to see other processes in the system.
View prediction results
Go to Insights > Predictions.
In the My predictions tab, select the prediction you want to view.
There are five primary sections of data within the results page.
Model performance: Grades A, B, or C indicate the performance of the prediction and can help you make the decision to use the results stored in the output table.
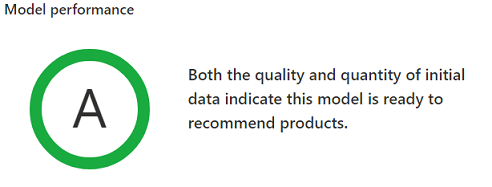
Grades are determined based on the following rules:
- A when the "Success @ K" metric is at least 10% more than the baseline.
- B when the "Success @ K" metric is 0% to 10% more than the baseline.
- C when the "Success @ K" metric is less than the baseline.
- Baseline: The top most recommended products by purchase count across all customers + learned rules identified by the model = a set of recommendations for the customers. The predictions are then compared to the top products, as calculated by the number of customers that purchased the product. If a customer has at least one product in their recommended products that was also seen in the top purchased products, they're considered a part of the baseline. For example, if 10 of these customers had a recommended product purchased out of 100 total customers, the baseline is 10%.
- Success @ K: Recommendations are created for all customers and compared against the validation set of time period of transactions. For example, in a 12-month period, month 12 is set aside as a validation set of data. If the model predicts at least one thing you would purchase in month 12 based on what it learned from the previous 11 months, the customer increases the "Success @ K" metric.
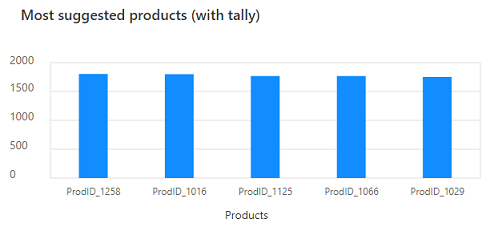
Most suggested products (with tally): The top five products that were predicted for your customers.
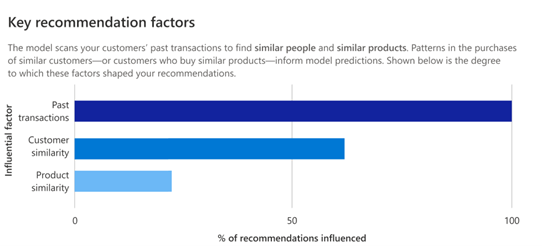
Key recommendation factors: The model uses the customers' transaction history to make product recommendations. It learns patterns based on past purchases and finds similarities between customers and products. These similarities are then utilized to generate product recommendations. The following factors could influence a product recommendation generated by the model.
- Past transactions: A recommended product was based on past purchase patterns. For example, the model can recommend a Surface Arc Mouse if someone recently purchased a Surface Book 3 and a Surface Pen. The model learned that historically, many customers purchased a Surface Arc Mouse after purchasing a Surface Book 3 and a Surface Pen.
- Customer similarity: A recommended product is historically purchased by other customers who show similar purchase patterns. For example, John was recommended Surface Headphones 2 because Jennifer and Brad recently purchased Surface Headphones 2. The model believes John is similar to Jennifer and Brad because they historically have similar purchase patterns.
- Product similarity: A recommended product is similar to other products that the customer previously purchased. The model considers two products to be similar if they were bought together or by similar customers. For example, someone gets a recommendation for a USB Storage Drive because they previously purchased a USB-C to USB Adapter. The model believes that USB Storage Drive is similar to USB-C to USB Adapter based on historical purchase patterns.
One or more of these factors influence every product recommendation. The percentage of recommendations where each influencing factor played a role is visualized in a chart. In the following example, 100% of the recommendations are influenced by past transactions, 60% by customer similarity and 22% by product similarity. Hover over the bars in the chart to see the exact percentage where the influencing factors contributed.
Data statistics: An overview of the number of transactions, customers, and products the model considered. It's based on the input data that was used to learn patterns and generate product recommendations.
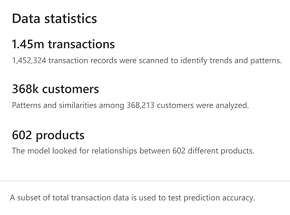
The model uses all available data to learn patterns. Therefore, if you use product filtering in the model configuration, this section shows the total number of products that the model analyzed to learn patterns, which might differ from the number of products that match the defined filtering criteria. Filtering applies on the output generated by the model.
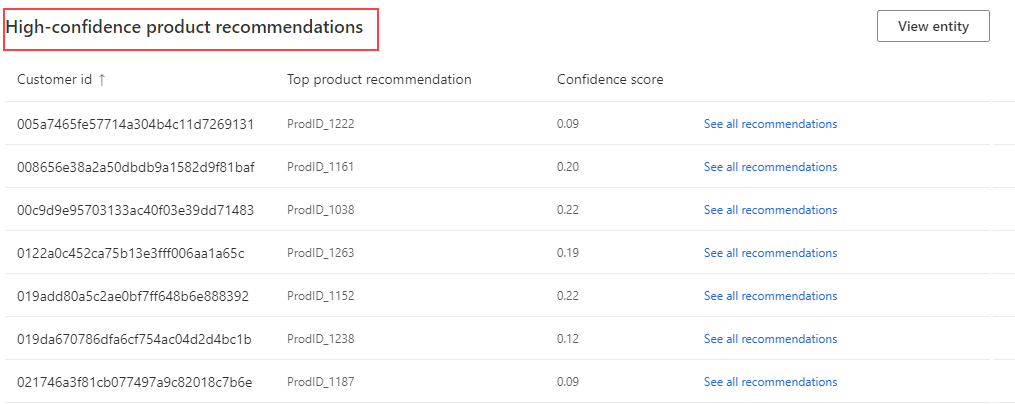
Sample product recommendations: A sample of recommendations that the model believes are likely to be purchased by the customer. If a product catalog is added, the product IDs are replaced with product names.
Note
In the output table for this model, Score shows the quantitative measure of the recommendation. The model recommends products with a higher score over products with a lower score. To view the score, go to Data > Tables and view the data tab for the output table you defined for this model.