Note
Access to this page requires authorization. You can try signing in or changing directories.
Access to this page requires authorization. You can try changing directories.
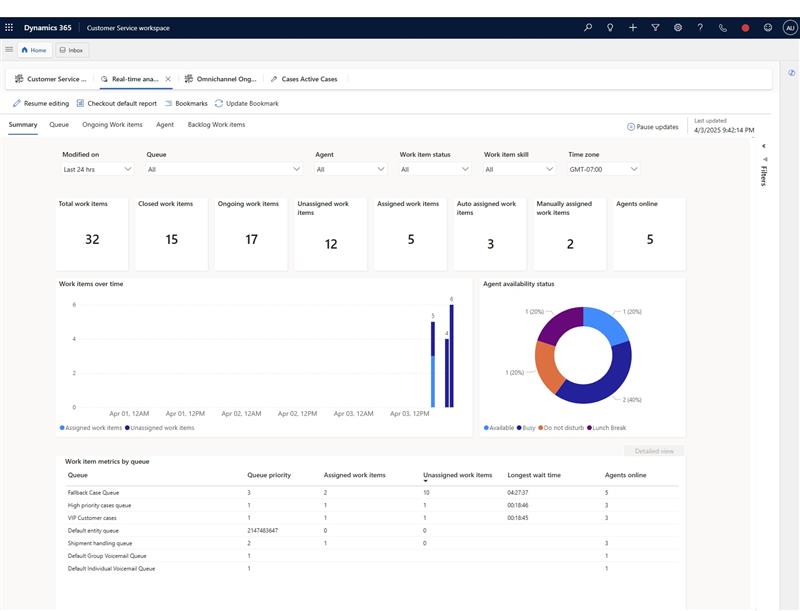
The Summary report appears by default when you select the real-time analytics for record routing dashboard in the Copilot Service workspace app. You can filter this report by modified on, queue, agent, work item status, work item skill and time zone. The time filters that are available include Last 24 hrs and Today.
The Summary report provides a summary of cases and records over time, by workstream or queue. This report shows entity record type queues only. Statistics about the workstream that a work item was created against can help you analyze and manage queue distribution and capacity use efficiency. For example, a high rate of unassigned work items can lead to decreased customer satisfaction. To address the rate of unassigned work items or long wait times before cases are assigned, you can examine operational metrics such as agent availability and case distribution for available agent capacity in real time.
By editing the visual display, you can add metrics to the ones already shown on the Summary report. Learn more in Customize visual display.
| KPIs | Description |
|---|---|
| Total work items | Total number of record type work items modified in the last 24 hours. Total work items = Closed work items + Ongoing work items. |
| Closed work items | Number of record type workitems modified in the last 24 hours and are closed currently. |
| Ongoing work items | Number of record type workitems modified in the last 24 hours, and are currently ongoing, including Open and Active ones. Ongoing work items = Unassigned work items + Assigned work items. |
| Unassigned work items | Number of record type workitems modified in the last 24 hours and are unassigned currently. |
| Assigned work items | Number of record type workitems modified in the last 24 hours and are assigned currently. Assigned work items = Auto assigned work items + Manually assigned work items. |
| Autoassigned work items | Number of record type workitems modified in the last 24 hours and autoassigned by unified routing currently. |
| Manually assigned work items | Number of record type workitems modified in the last 24 hours and are manually assigned currently. |
| Agents online | Number of agents who are online. That is, whose presence status isn't offline. |
Interactive charts
You can view different types of charts in the report, such as vertical bars and donut charts. The visual display helps you discern changes and patterns in the data so that you can act quickly to address the most important issues.
For example, the Work items over time column chart shows the number of work items in an assigned and unassigned state, projected over the created-on time in the X-axis.|
When you select a component in a chart, the data is filtered accordingly. This way, you can view data that is related to the selected component only. For example, if you select the Busy component in the Agent availability status chart, the dashboard is refreshed and shows only work items of agents who are currently in the Busy state.
The Work items metrics by queue table, shows the following metrics:
| KPIs | Description |
|---|---|
| Queue | Name of the queue |
| Queue priority | Priority of the queue. |
| Assigned work items | Number of record type workitems modified in the last 24 hours and are assigned currently in this queue. |
| Unassigned work items | Number of record type workitems modified in the last 24 hours and are unassigned currently, waiting in this queue. |
| Longest wait time | Waiting time until the agent accepts the workitem. |
| Agents online | Number of agents who are online. That is, whose presence status isn't offline within this queue. |
Related information
Manage real-time analytics for record routing
Overview of real-time analytics for record routing
Queue report
Agent report
Ongoing work items report
Backlog work items report