Analyze deals flow between forecast snapshots
Note
Starting June 30, 2024, snapshots feature in forecasting will be deprecated. Learn more.
As a sales manager, analyzing the deals flow between snapshots helps you identify deals that are moving in the right direction and those deals that need attention to meet your sales forecast. You can drill in to specific deals that have contributed to the increase or decrease in your forecast commitment. This analysis enables you to follow up with your teams and coach them on how to improve your forecast accuracy.
License and role requirements
| Requirement type | You must have |
|---|---|
| License | Dynamics 365 Sales Premium More information: Dynamics 365 Sales pricing |
| Security roles | Any primary sales role, such as salesperson or sales manager More information: Primary sales roles |
View deals flow between snapshots
Prerequisite
Verify that at least two snapshots are available for the forecast. More information: View snapshots
View and understand a deals flow
In the Sales Hub app, go to Performance > Forecasts.
Select a forecast, and then choose a forecast period for the forecast.
Select the Flow tab. The tab is available only if you have enabled snapshots.
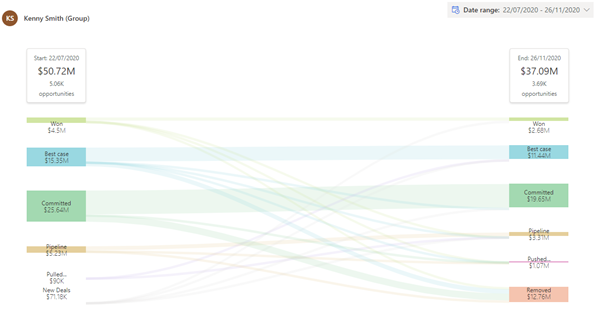
A sankey chart is displayed with a comparison between the two latest snapshots for the forecast. The order of forecast categories depends on how the forecast columns are arranged in the grid view.

To compare snapshots, choose Start and End dates from the calendar. Select Apply.
The chart is updated to display the deal flow. The flow is determined based on the opportunity's forecast category between the start date and end date snapshots. For example, if an opportunity was in the Committed state on the start date and moved to Won on the end date, you'll see the opportunity flow from Committed to Won in the flow chart.
The following categories in the deal flow are calculated based on the movement of deals. Let's understand them with an example scenario. Let's say your forecast is for a fiscal year with four quarters – starting from January-March(Q1), April-June(Q2), July-September(Q3), October-December(Q4). Let's compare the snapshots of July 1 and August 31.
Forecast Category Description Example Pushed out or Pulled in These categories include opportunities that were moved during the snapshot period for the following reasons: - Opportunities that moved from one seller to another within the forecast hierarchy.
- Opportunities that moved from one forecast period to another within the forecast date range.
Ownership change: Dustin Ochs and Amber Rodriguez are Sales Managers reporting into Kenny Smith. A few opportunities of Dustin were transferred to Amber in between the start date and end date snapshots. The transferred opportunities appear under the Pushed out category for Dustin and Pulled in category for Amber. However, there will be no change for Kenny as the movement is within the same hierarchy.
Date change:
A few opportunities of Kenny Smith that were estimated to close within Q3 as on July 1st have moved to Q4 as on August 31st. These opportunities are shown under the Pushed out category in the end date snapshot.New Deals New opportunities that were added in between the snapshot start and end dates appear as New Deals in the Start date snapshot column. Opportunities that were created between 1st July and 31st August. Removed Opportunities that have moved out of the forecast due to one of the following reasons: - Estimated close date of the opportunity has moved out of the forecast date range.
- Opportunity is deleted.
- Opportunity has moved out of the forecast hierarchy
- Opportunities that were moved to the next fiscal year.
- Opportunities that have moved from Kenny Smith's org to Olivia Wilson's org.
Hover over a forecast category in the stack to see a summary of the category, including the forecast category with snapshot date, the aggregated budget amount, and the number of opportunities that are influencing the aggregated amount. Also, the flow is highlighted to show how the opportunities are trending between the snapshots.
To view underlying opportunities, select a forecast category in the stack. The opportunities are displayed in a grid with side-by-side comparison of how the granular data for each opportunity—such as owner, value, date, and forecast category—is changing in columns from start date to end date.

You can't edit the opportunities inline. However, in the Action column, select the navigate icon corresponding to the opportunity that you want to edit. The saved changes won't affect the status of the opportunity in the snapshot, because the snapshots are taken at a moment in time by using frozen data.

Whose deals flow am I viewing?
You can identify whether the selected flow is for a team or an individual by looking at the deals flow heading:
If the heading name contains Username (Group), you're looking at the deals flow of a user's team.
If the heading name contains only Username, you're looking at the deals flow of an individual user.
Seeing the deals flow of other users depends on the sales hierarchy defined for you. To learn more, see Forecasts and sales hierarchy.
Can't find the options in your app?
There are three possibilities:
- You don't have the necessary license or role. Check the License and role requirements section at the top of this page.
- Your administrator hasn't turned on the feature.
- Your organization is using a custom app. Check with your administrator for exact steps. The steps described in this article are specific to the out-of-the-box Sales Hub and Sales Professional apps.
Related information
View snapshots
Take snapshots automatically
About premium forecasting