Note
Access to this page requires authorization. You can try signing in or changing directories.
Access to this page requires authorization. You can try changing directories.
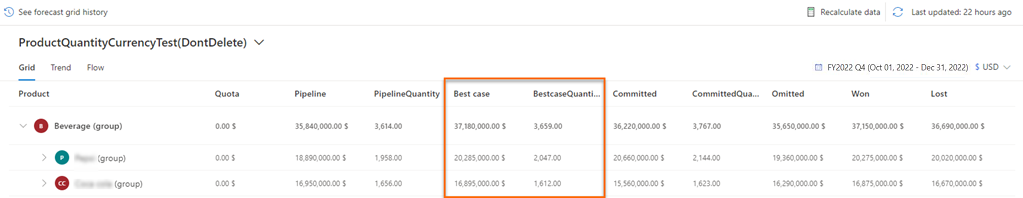
In a forecast grid, you can have multiple columns with different data types—such as currency and quantity—displayed in a single view. For example, in a product-based forecast, you can display the Best case column values as a quantity (the decimal value of the volume of products sold) and as currency simultaneously.
For more information about configuring columns and data types, go to Choose layout and columns.
Examples of forecasts with different data types
Let's look at a few examples of configuring and activating forecasts with different data types:
Example 1: Create two different currency columns and a quantity column with the same forecast category
Let's say you want to view the Best case forecast category's total amount, discount amount, and the number of products sold to get this amount. You configure three Best case columns as follows in the Layout step of the forecast:
| Column name | Type | Selector | Data type | Amount field |
|---|---|---|---|---|
| Best case | Rollup | Best case | Currency | Amount |
| Best case discount | Rollup | Best case | Currency | Manual Discount or Volume Discount |
| Best case products sold | Rollup | Best case | Decimal | Quantity |
After you've completed the other configuration steps as required and are activating the forecast, an error message is displayed at the top of the Activate forecast configuration page.
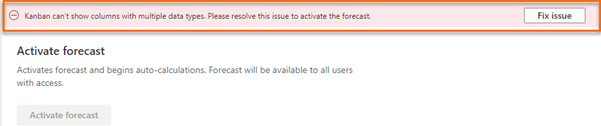
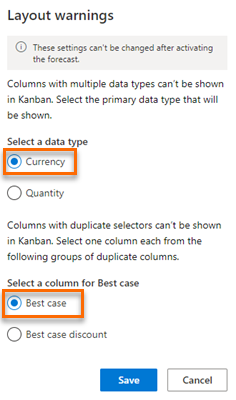
Select Fix issue. The following Layout warnings pane is displayed, where you can select a primary data type.
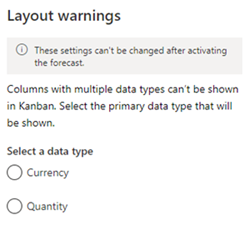
If you select the primary data type as Quantity, the forecast chooses the Best case products sold column to display in the Kanban view. This is because the Best case products sold column is the only column that has a quantity (in this case, decimal) data type. You can proceed with activating the forecast after you select the primary data type. The Kanban view in the following image displays only one lane with a single quantity-based column.
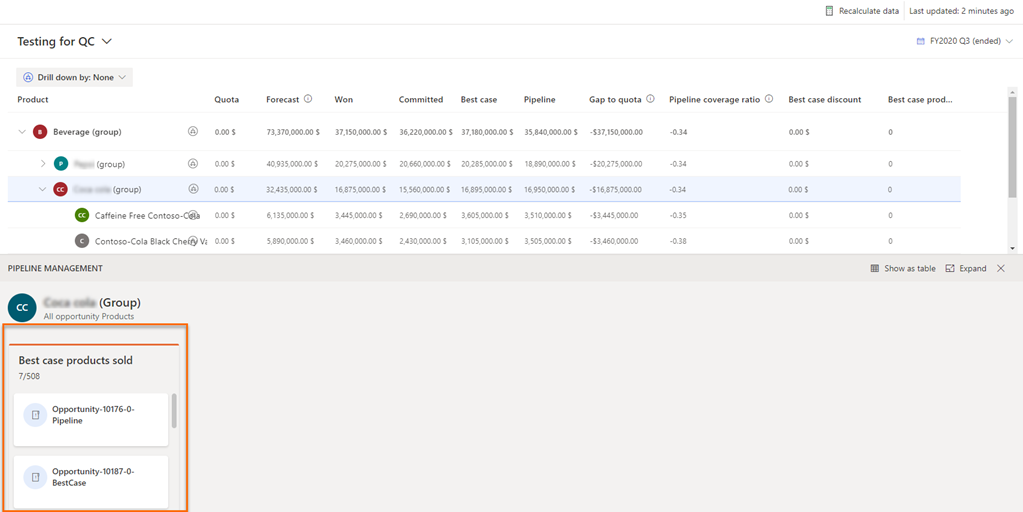
If you select the primary data type as Currency, you must choose between Best case and Best case discount columns to display in the Kanban view. This is because both these columns have Currency as the data type and share the same selector (Best case). Select the appropriate column, and then select Save.
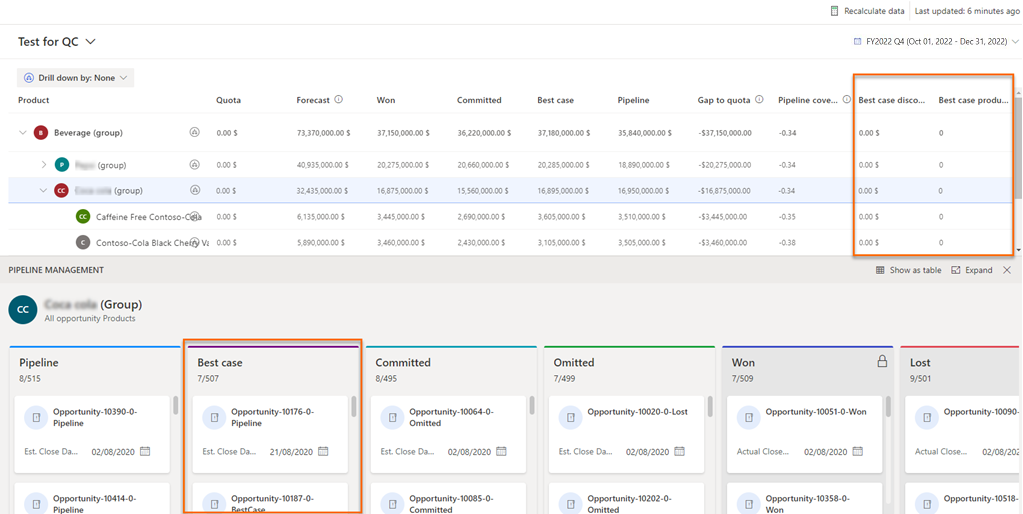
In this forecast, the Best case column is selected to be displayed in the Kanban view, though the Best case discount column is of the same selector and data type. The quantity-type column Best case products sold is of the same selector and is displayed in the forecast grid, but not in the Kanban view.
Example 2: Create a currency column and a quantity column with two different forecast categories
Let's say you want to view the total revenue of the Won forecast category and the products sold under the Best case forecast category. You configure the Won and Best case columns as follows in the Layout step of the forecast:
| Column name | Type | Selector | Data type | Amount field |
|---|---|---|---|---|
| Won | Rollup | Won | Currency | Amount |
| Best case products sold | Rollup | Best case | Decimal | Quantity |
After you've completed the other configuration steps as required and are activating the forecast, the "Kanban can't show columns with multiple data types. Please resolve this issue to activate the forecast" error message is displayed at the top of the Activate forecast configuration page.
Select Fix issue, and in the Layout warnings pane, select a primary data type.
Select the primary data type that meets your needs. As the Won (currency) and Best case (quantity) columns have different selectors and data types, you must select one of them a primary data type to be displayed in the Kanban view.
View selected primary data type and columns
You can view the details of the primary data type and the selected column (among duplicate columns with the same selector) that'll be displayed in the Kanban view. The displayed details are view-only and can't be edited after you activate the forecast.
Sign in to the Sales Hub app.
In the site map, select the Change area
 , and then select App Settings.
Under Performance management, select Forecast configuration.
The forecast configuration page opens.
Select More options corresponding to the forecast, and then select Edit.
Go to the Layout configuration step. At the bottom of the Layout section, a Layout warnings section is displayed.
Select View settings. A Layout warnings pane is displayed on the right side of the page.
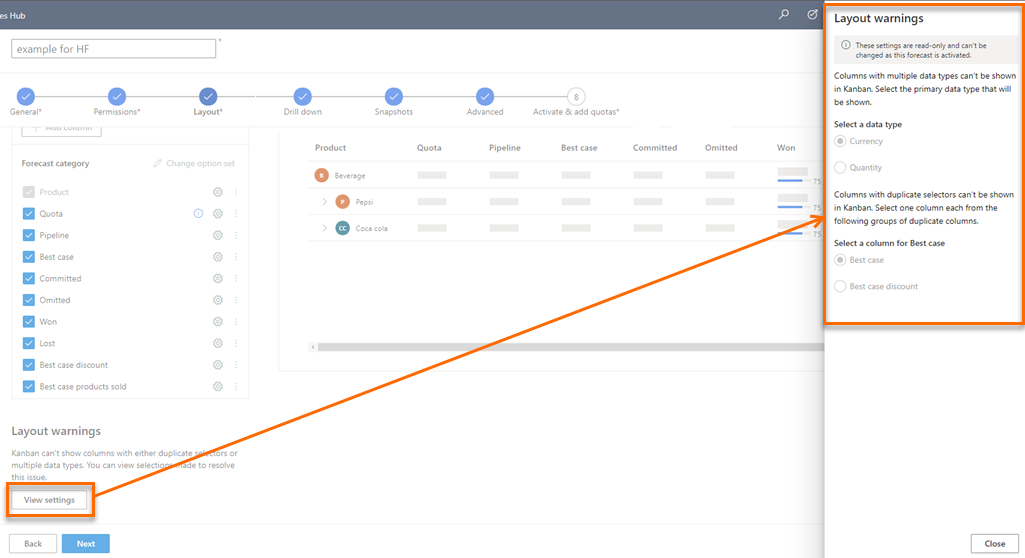
You can view the selected primary data type and column to display in the Kanban view.
Can't find the feature in your app?
There are a few possibilities:
- You don't have the necessary license to use this feature. Check out the comparison table and the licensing guide to see which features are available with your license.
- You don't have the necessary security role to use this feature.
- To configure or setup a feature, you need to have the Administration and customization roles
- To use sales-related features, you need to have the Primary sales roles
- Some tasks require specific Functional roles.
- Your administrator hasn't turned on the feature.
- Your organization is using a custom app. Check with your administrator for exact steps. The steps described in this article are specific to the out-of-the-box Sales Hub and Sales Professional apps.
Related information
Activate and upload simple columns data
Choose layout and columns