Note
Access to this page requires authorization. You can try signing in or changing directories.
Access to this page requires authorization. You can try changing directories.
Note
Microsoft Sustainability Manager has been rebranded as Dynamics 365 Sustainability. This change reflects a new product name only. Product functionality, capabilities, licensing, and service offerings remain unchanged. Some screenshots and UI labels in this article may show the previous name while visuals are being updated.
Note
This feature is included in Microsoft Dynamics 365 Sustainability Premium.
Organizations use calculation models and profiles to generate reporting metrics by transforming detailed data sets into consolidated insights. These insights help fulfill regulatory compliance reporting needs.
Watch the following demo of the Social and governance functionality:
For more information about calculation models, see Calculation models in Microsoft Dynamics 365 Sustainability - Microsoft for Sustainability | Microsoft Learn and Create calculation profiles - Microsoft for Sustainability | Microsoft Learn.
This article demonstrates how to use Calculate reporting metrics to create common reporting metrics. It covers the following calculations:
- Sum: For example, Total electricity consumption.
- Average: For example, Average water consumption per facility.
- Percentage: For example, Renewable energy percentage = Renewable energy ÷ Total energy × 100.
- Ratio (intensity): For example, Emissions intensity = Total emissions ÷ Revenue.
- Derived metrics (preview): For example, Renewable energy percentage calculated from aggregated renewable and nonrenewable energy.
Calculate sum
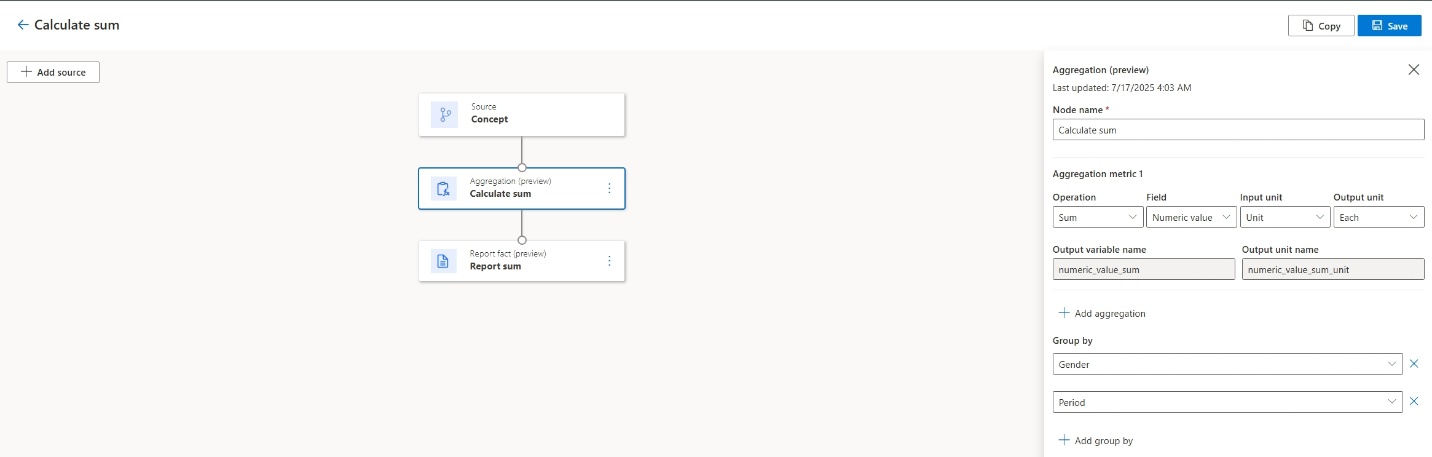
In this first example, you collect data for the Number of employees by country and gender. From this data, you find the total Number of employees by gender.
Note
You might notice that the calculation model also groups by Period. This grouping ensures that data from different periods stays distinct during calculation (for example, metrics for year 2024 and year 2025 are retained separately).
Use an aggregation node and sum by the Gender dimension. This step aggregates all facts that have the same Gender dimension member (that is, Female). If you have multiple metrics that need the same calculation, use calculation profiles to differentiate between input and output pairs.
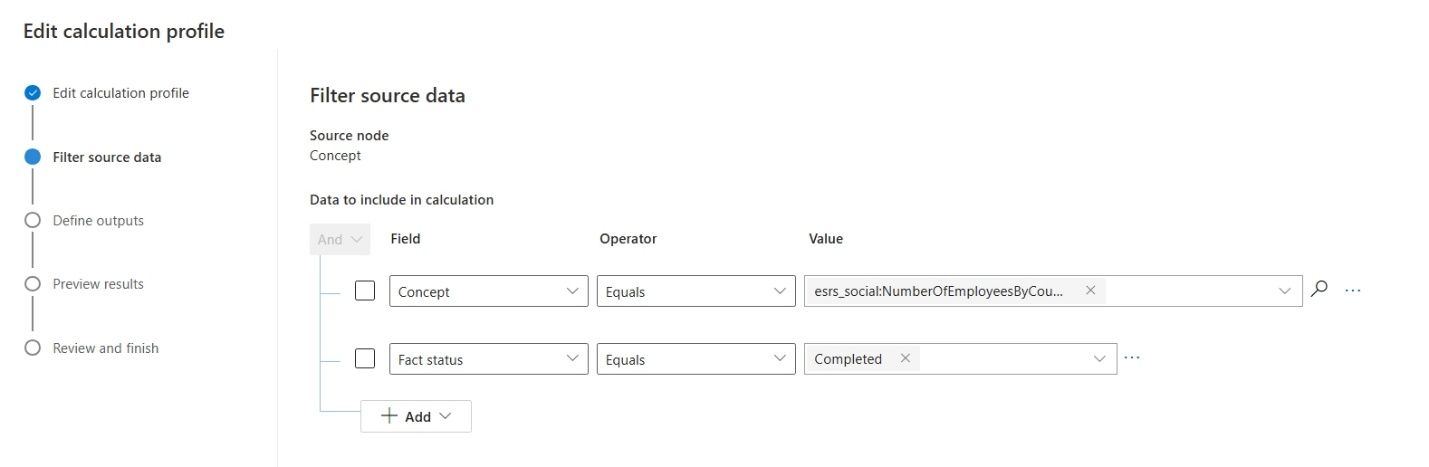
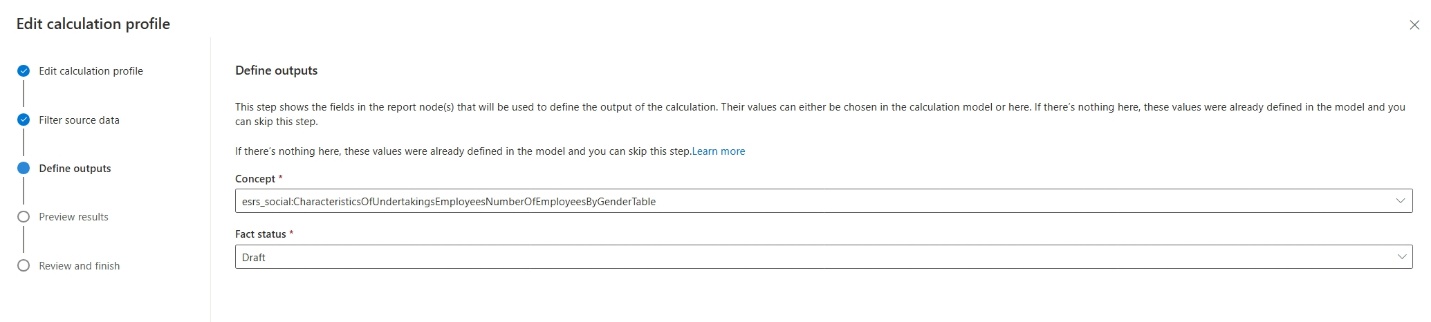
Calculate average
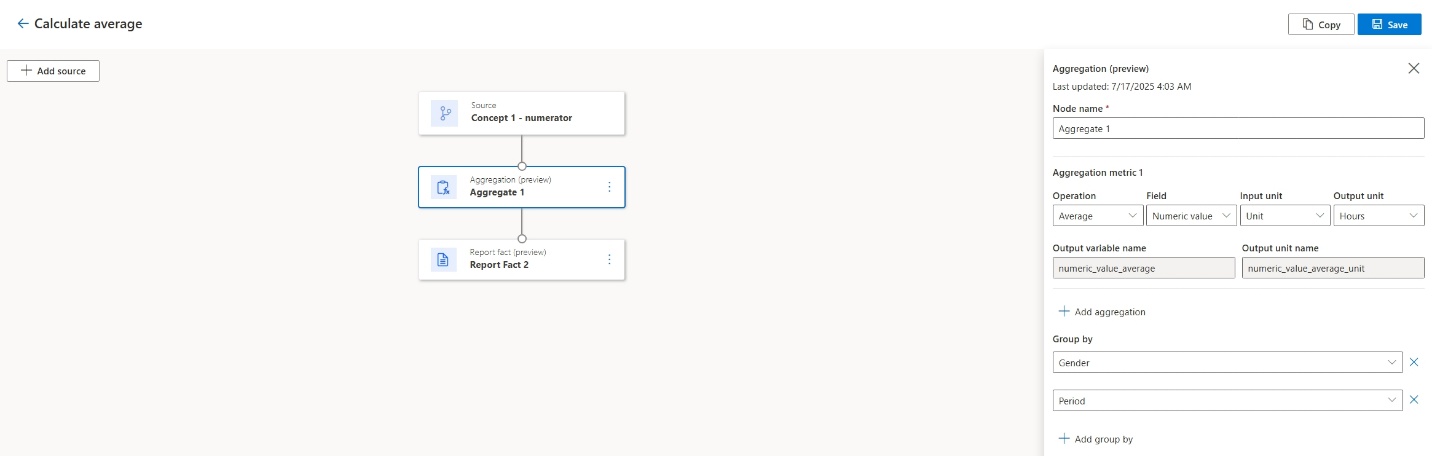
Calculating an average is similar to calculating a sum, but you divide by the number of facts for each dimension or group of dimensions that you aggregated by.
In this example, if you have data for Number of training hours by gender and country/region, and you need to calculate the Average number of training hours by gender, use an aggregation node with the Average operation.
Calculate percentage
Calculating percentages and ratios involves joining two or more source nodes. For a percentage, bring in two concepts: the numerator and the denominator.
In this example, you calculate the Percentage of employees that participated in regular performance and career development reviews by gender. The collected data is as follows:
Concept 1: Number of employees that participated in regular performance and career development reviews by gender
Concept 2: Number of employees by gender
Note
This calculation model uses the output of the Calculate sum profile. To try this model, run Calculate sum first.
Start by joining these two concepts. Use the underlying fact data of both in the calculation as follows:
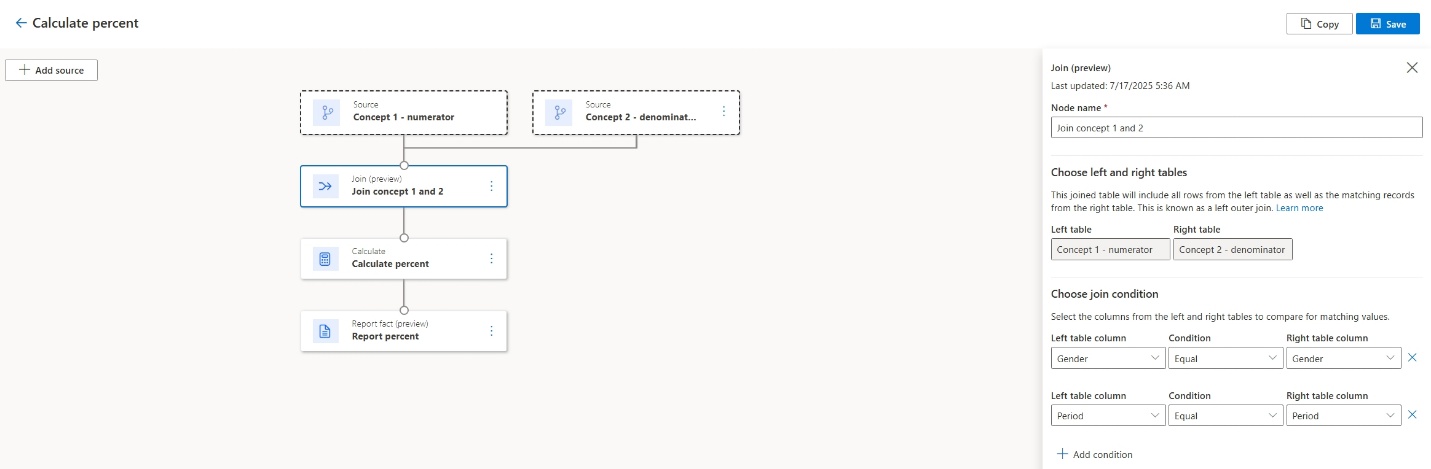
Next, use a calculation node to run the following formula:
(Input.msdyn_numericvalue_concept_1_numerator / Input.msdyn_numericvalue_concept_2_denominator) * 100
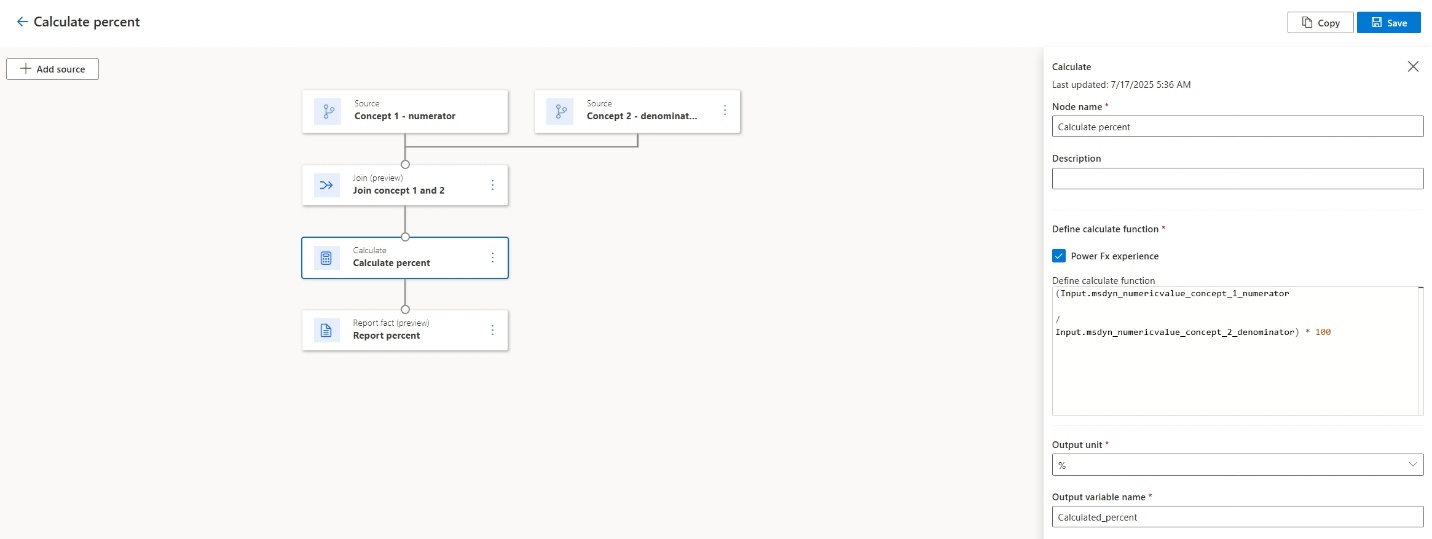
Finally, use a Report fact node to write the facts back to the intended concept: Percentage of employees that participated in regular performance and career development reviews by gender.
Calculate ratio
To calculate a ratio, join three concepts to execute the following operation:
Concept 3 / [[Concept 1 + Concept 2] / 2]
For example, if you want to calculate the Rate of recordable work-life accidents, collect the following information:
Concept 1: Number of employees at the beginning of the reporting period
Concept 2: Number of employees at the end of the reporting period
Concept 3: Number of recordable work-related accidents
Join concepts 1 and 2, and calculate the average number of employees during the reporting period.
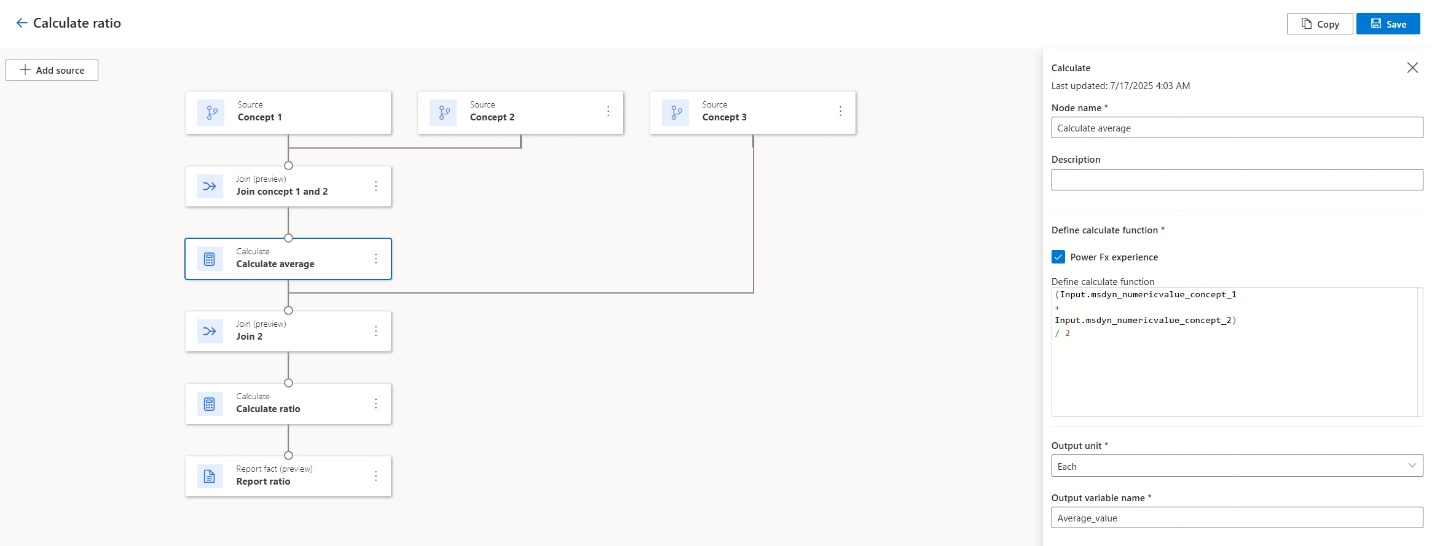
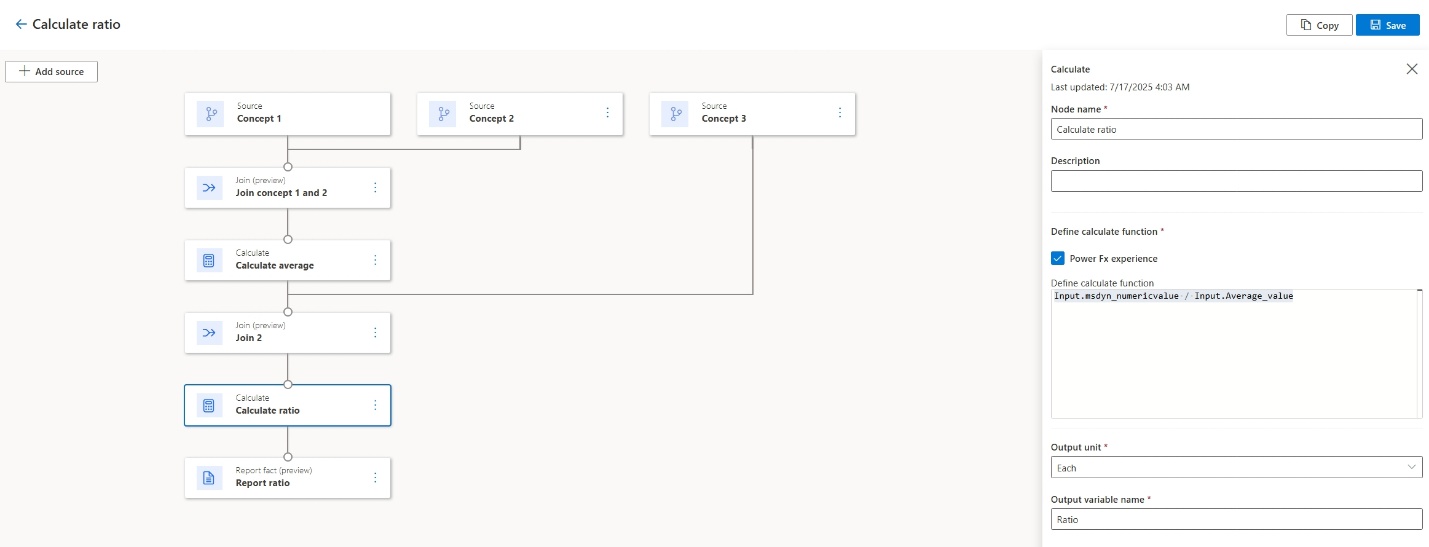
Next, join the output (average) with the third concept, Number of recordable work-related accidents. Finally, use a second and final calculation node to calculate the ratio through the following formula:
Input.msdyn_numericvalue / Input.Average_value
Generate derived metrics (preview)
You can create derived metrics that reference the outputs of one or more Aggregation nodes. The configuration pane displays the settings for the selected node. Select an Aggregation node and in the Aggregation pane, select Add aggregation to add another aggregation calculation. For reporting metrics that require results by facility, business unit, region, or another dimension, select the Aggregation node and then select Add group by.
Note
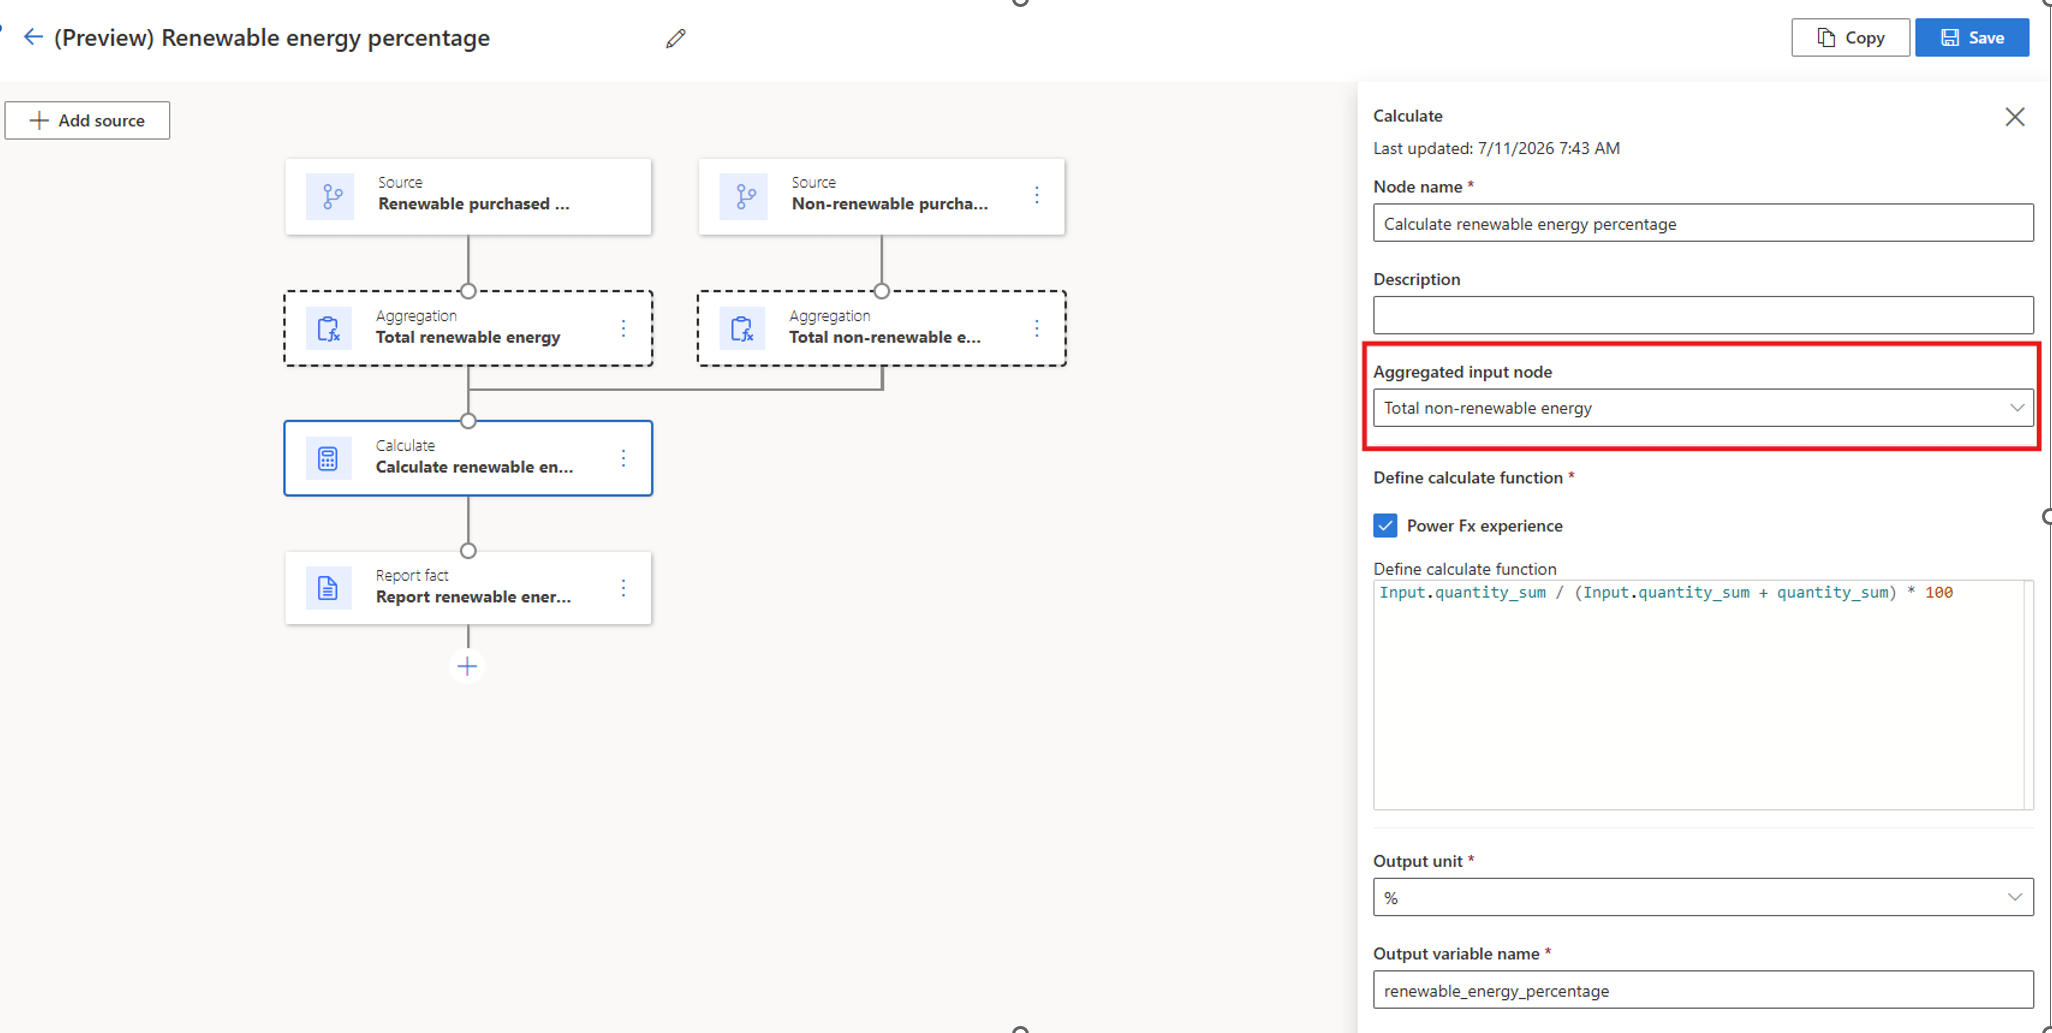
When you configure an Aggregate Input column in a Calculate node:
- You can reference only outputs from Aggregation nodes.
- Outputs from Source, Join, Calculate, and other node types aren't supported.
- The referenced aggregation must return exactly one row.
- Group by aggregations that return multiple rows aren't supported.
- Use consistent units of measure throughout the calculation.
- Currency conversion and automatic hierarchy rollups aren't currently supported.
- Validation errors appear if you select unsupported outputs.
The preview reporting metrics in the Reporting metrics section on Calculations > Models provide examples of these approaches.
Example: Calculate renewable energy percentage (preview)
The built-in Renewable energy percentage reporting metric uses two sources: renewable purchased energy and nonrenewable purchased energy. Each Aggregation node calculates a total and returns one row. The Calculate node references these aggregated totals and calculates the percentage of renewable energy. The Report fact node then saves the result as a reporting metric.
Generate environmental reporting metrics from GHG emissions
Use calculation models and profiles to generate environmental reporting metrics from greenhouse gas (GHG) emissions data. Instead of producing static Excel outputs, this approach uses the calculation engine to generate structured fact records that are scalable, reusable, and auditable.
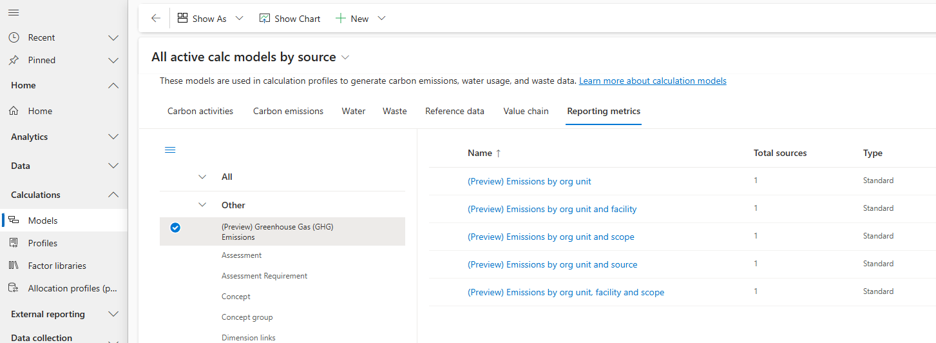
The preview reporting metrics include examples that generate environmental metrics at different levels of detail for regulatory reporting disclosures.
Example: Calculate emissions by organizational unit and scope
To aggregate total CO₂e emissions by dimensions such as organizational unit and scope:
- Select the emissions by organizational unit and scope calculation model. Use it as-is or make a copy and update it as needed.
- Run the calculation profile with the appropriate data filters, removing null values as needed.
The calculation produces emissions by org unit and scope and org unit (total). Each output retains dimension metadata for downstream reporting. You can use the outputs as facts in your external reporting across standards.