Note
Access to this page requires authorization. You can try signing in or changing directories.
Access to this page requires authorization. You can try changing directories.
Microsoft eCDN provides granular analytics, which empower admins to carry out performance analysis and network troubleshooting of live events. The analytics tools consist of two dashboards - one that provides a high-level overview of the service operation, and one for a detailed drill-down into the data.
For more in-depth analytics, see the Drilldowns dashboard documentation.
Overview Dashboard
The Overview dashboard is designed to provide a quick view of eCDN performance and overall user experience.

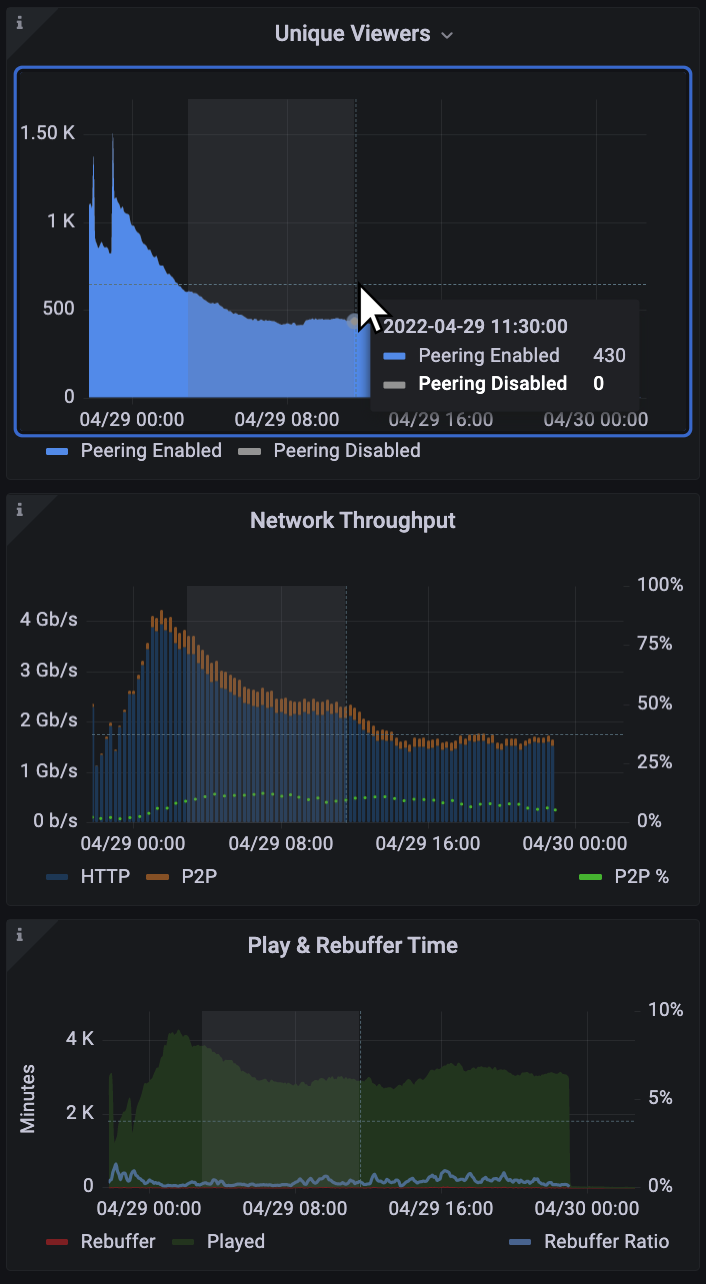
The left column shows the core metrics to track:
Unique Viewers - Concurrently connected devices over time.
Network Throughput - Total bandwidth used by the live video stream, displayed as the sum of HTTP and P2P bandwidth. This graph includes the P2P % in green, calculated as P2P Bandwidth/Total Bandwidth.
Play and Rebuffer Time - Total time video was played correctly (green) and total time video rebuffered (red). Rebuffering is any amount of time that the video should be playing but isn't, such as when there's buffer starvation (network slowdown) and the video freezes. Generally, a rebuffer rate below 1% is considered good, between 1 - 3% is acceptable, and above 3% is concerning and worth exploring further using the Drilldowns dashboard. The rebuffer ratio (blue) is calculated as the percentage of time end-users spent rebuffering a video out of the total time they spent watching it: total-time-rebuffered/(total-time-rebuffered + total-time-played).
The middle column shows event and group metrics:
Recent Events - A list of the most recent video streams.
Groups - Total number of viewers and rebuffer ratio for the largest 100 groups.
The right column shows general statistics:
Overall P2P - The P2P efficiency is calculated by dividing the number of bytes transferred via P2P by the total bytes transferred. The higher the percentage, the better the performance of the eCDN.
Rebuffering - Global rebuffering % for the selected time range, calculated as total-time-rebuffered/(total-time-rebuffered + total-time-played). The lower % the better.
Session Length - The average amount of time an end-user spent watching a video. Calculation: (total-time-played + total-time-rebuffered)/total-playback-sessions. It's possible that the selected time range misses some playback sessions, causing this metric to be misleading in that time range.
Total Viewers - Total number of unique devices connected for the selected time range.
Average Bitrate - The average number of bits per second of video loaded by the player across all end-users. Calculation: total-size-loaded-by-the-player/total-duration-loaded-by-the-player.
End-user Application - Top six applications with most connected end-users, for example, such as Teams Desktop, Edge, and Chrome.
Geo Location - Geographic location of the top 10,000 users as displayed on a world map. The locations are estimated based on the public IP of the user. This method is inaccurate when users are connecting via VPNs, datacenters or any tunnel that obfuscates the end-user IP.
Time range selection
The time picker in the top-right corner can be used to focus on specific time windows or to change to a "real time" mode where the dashboard refreshes. This is useful during live-event monitoring.
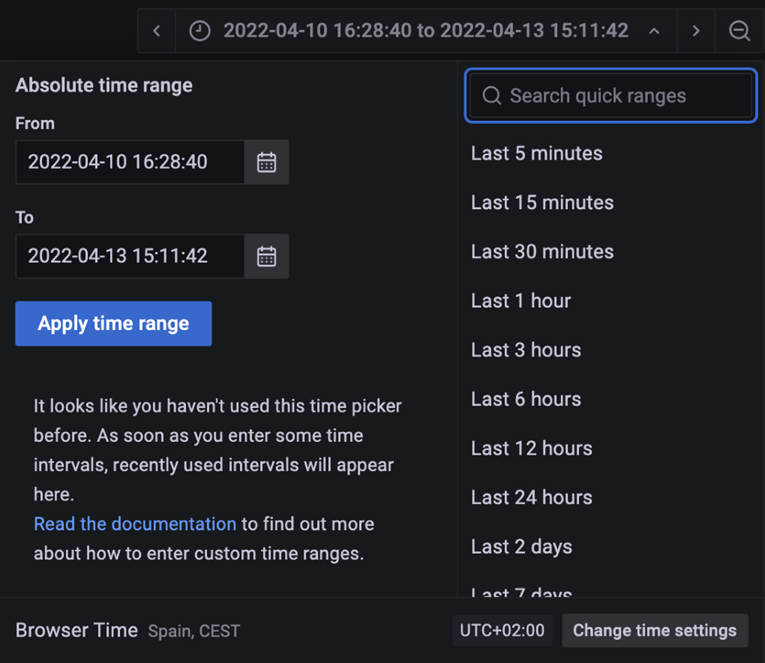
You can also select a time range by using the mouse to click and drag within any of the graphs, which updates all the graphics to reflect your selected period in time. Go back in your browser to undo the selection.
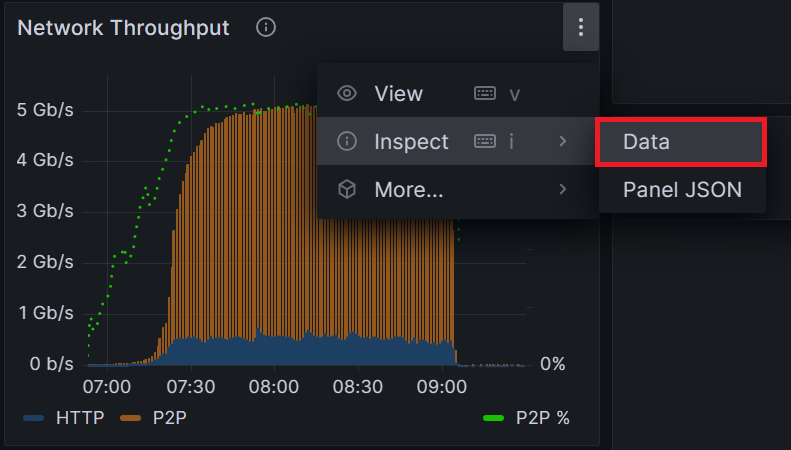
Exporting data
The data used in any visualization can be exported as a CSV. On the Analytics page, select the three-dot menu button located at the top-right of visualization, then select Inspect > Data to reveal export options.
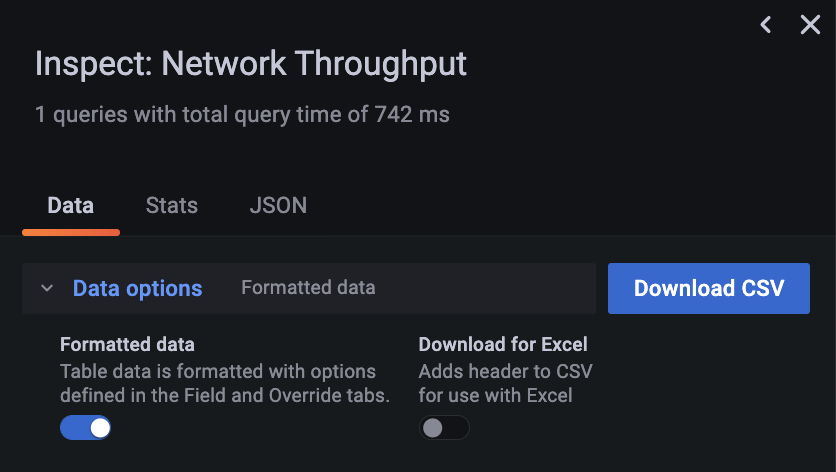
Optionally, you can select Data options to reveal formatting options before selecting on Download CSV.
Correlating events to event IDs
Events are listed in Microsoft eCDN's analytics Drilldowns dashboard with an "Event Type" column, rather than by a prefix in the Event ID. The Event Type column displays values such as "TLE," "TH PRE," "Silent Test," and others, making it easier to identify the type of event directly in the dashboard.
To locate a specific event, you can still use the event's meeting ID, which is found in the join or invite link. For example:
https://teams.microsoft.com/l/meetup-join/19%3Ameeting_1234Njg5MGMtNzA1MC00ZmJhLWI4YTEtN2RiMTFjOWQ51234%40thread.v2/0?context={"Tid"%3A"123488bf-1234-1234-91ab-2d7cd0111234"%2C"Oid"%3A"123487cf4-1234-1234-b8ce-33df3c7eaa46"}
The meeting ID is the 48 alphanumeric character string embedded within the join link between /meetup-join/19%3ameeting_ and %40thread.v2.
For example, in the link above, the meeting ID is 1234Njg5MGMtNzA1MC00ZmJhLWI4YTEtN2RiMTFjOWQ51234.
Drilldowns dashboard
Dive deeper into your analytics data with the Drilldowns dashboard.
