Note
Access to this page requires authorization. You can try signing in or changing directories.
Access to this page requires authorization. You can try changing directories.
To access the Drilldowns analytics view, select the Drilldowns button on the top right-hand side of your Analytics Overview dashboard.
The Drilldowns dashboard is designed to provide analytics granularity so that you know exactly how your live event performed.

Filtering and slicing
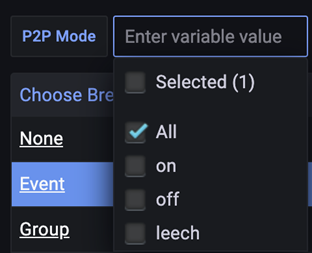
The main utility of the Drilldowns dashboard is the ability to filter and slice your analytics data on multiple dimensions to gain better performance insight. For example, the viewer's P2P mode.
The P2P mode filter, found at the upper left corner, by default is set to "All" meaning you see analytics for groups and users with P2P set to "on," "off," and "leech." You can filter by other P2P modes by checking one or more corresponding checkboxes.
Here's a reminder of what each value means. Find more details here.
- On - Peering is enabled.
- Off - Peering is disabled.
- leech - Peering is enabled in consume-only mode.
Breakdown dimensions
As seen partially listed in the top figure there's a host of breakdown dimensions through which to view your event data.
Event
Displays a list of events conducted, and their performance metrics based on the time range selected using the time picker at the top right. The Drilldowns dashboard now includes an Event Type column, which clearly indicates the type of each event. This column replaces the previous method of identifying event types by a prefix in the Event ID.
| Event Type | Description |
|---|---|
| TLE * | Teams Live Event |
| TH * | Town Hall |
| TH Pre * | Premium Town Hall |
| Silent Test | Silent Test |
| other | Events from integrated third‑party platforms are shown with an appropriate event type label |
Note
A Premium Town Hall is a Town Hall that's created by an organizer with a Teams Premium license.
Note
*Some events can be hosted on the Viva Engage platform. Such events have "(Engage)" suffixed to the event type.
To view performance of a specific event, select the Event ID to filter the data. The fields below the breakdown table including Overall P2P, Rebuffering, Unique Viewers, and others now display the metrics for just that specific event.
Group
Shows per site / subnet group analytics. Given that subnet mapping is present at the time of the event, you see the names of your sites and their respective performance metrics here.
Group Label
Shows event performance metrics categorized by vanity labels as defined in your subnet mapping.
Warning
Take care to not conflate the Group Label dimension, which has no impact on peering logic, with the similarly named Group dimension that defines peering boundaries, and thus does impact peering logic.
Users
Shows per-user analytics using users' Microsoft Entra object ID, which can be looked up in Microsoft Azure. The Private IP column displays the first three octets of users' local IPs. In addition to overall P2P efficiency and rebuffering metrics, you can view minute by minute experience metrics by user over the full timeline of the event in the Rebuffering Timeline widget. This way, you can identify exactly where buffering occurs for a specific user.
Note
While user IDs for a Silent Test event may seem like object IDs, they're actually randomized GUIDs. A user ID only corresponds to a Microsoft Entra user for authenticated events such as a Town Hall event.
Tip
Need to associate users' object ID with a User Principal Name (UPN) or name? Reach out to us for an experimental script designed to supplement your exported Users table with each user's UPN and Name from Azure Active Directory.
Application
Displays the type of application via which users join the live event. Examples include: Teams desktop app, Microsoft Edge, Google Chrome, etc.
ISP
Displays the ISP provider.
ASN
Displays the ASN numbers. Autonomous System Numbers (ASN) are official numbers assigned to each autonomous system, which are the large networks that make up the Internet. For more, see this definition.
Country
Displays the countries/regions from which users join.
City
Displays the cities from which users join.
OS
Displays the operating systems users are on.