Note
Access to this page requires authorization. You can try signing in or changing directories.
Access to this page requires authorization. You can try changing directories.
The Job runs page in the Monitor hub gives you a centralized view of job execution health, progress, and outcomes across the items in Fabric. Each row represents one job run, so a single scan of the list tells you what executed, how it finished, and how long it took.
Because every item type that produces jobs lands in one list, the Job runs page is usually the fastest way to find out if a scheduled job ran successfully. This article shows you how to open the Job runs page, filter the job runs, and open run details to investigate failures.
Any Fabric user can open the Monitor hub, but you only see activities for Fabric items you have permission to view.
Important
The Job runs page in the Monitor hub is currently in preview. See the Supplemental Terms of Use for Microsoft Azure Previews for legal terms that apply to Azure features that are in beta, preview, or otherwise not yet released into general availability.
Prerequisites
Before you begin, ensure that you have the following prerequisites:
- Access to at least one item capable of running jobs, such as a notebook, a pipeline, or a dataflow.
- Sufficient permissions to view run history. Some columns and actions require a higher level of access than read-only.
- At least one job run inside the selected time range. The list appears empty when no runs fall within the specified window.
View the Job runs page
To view the job runs in your workspace:
Sign in to Microsoft Fabric.
Open Monitor from the navigation pane. Switch to the new Monitor hub experience if you're still in the classic view.
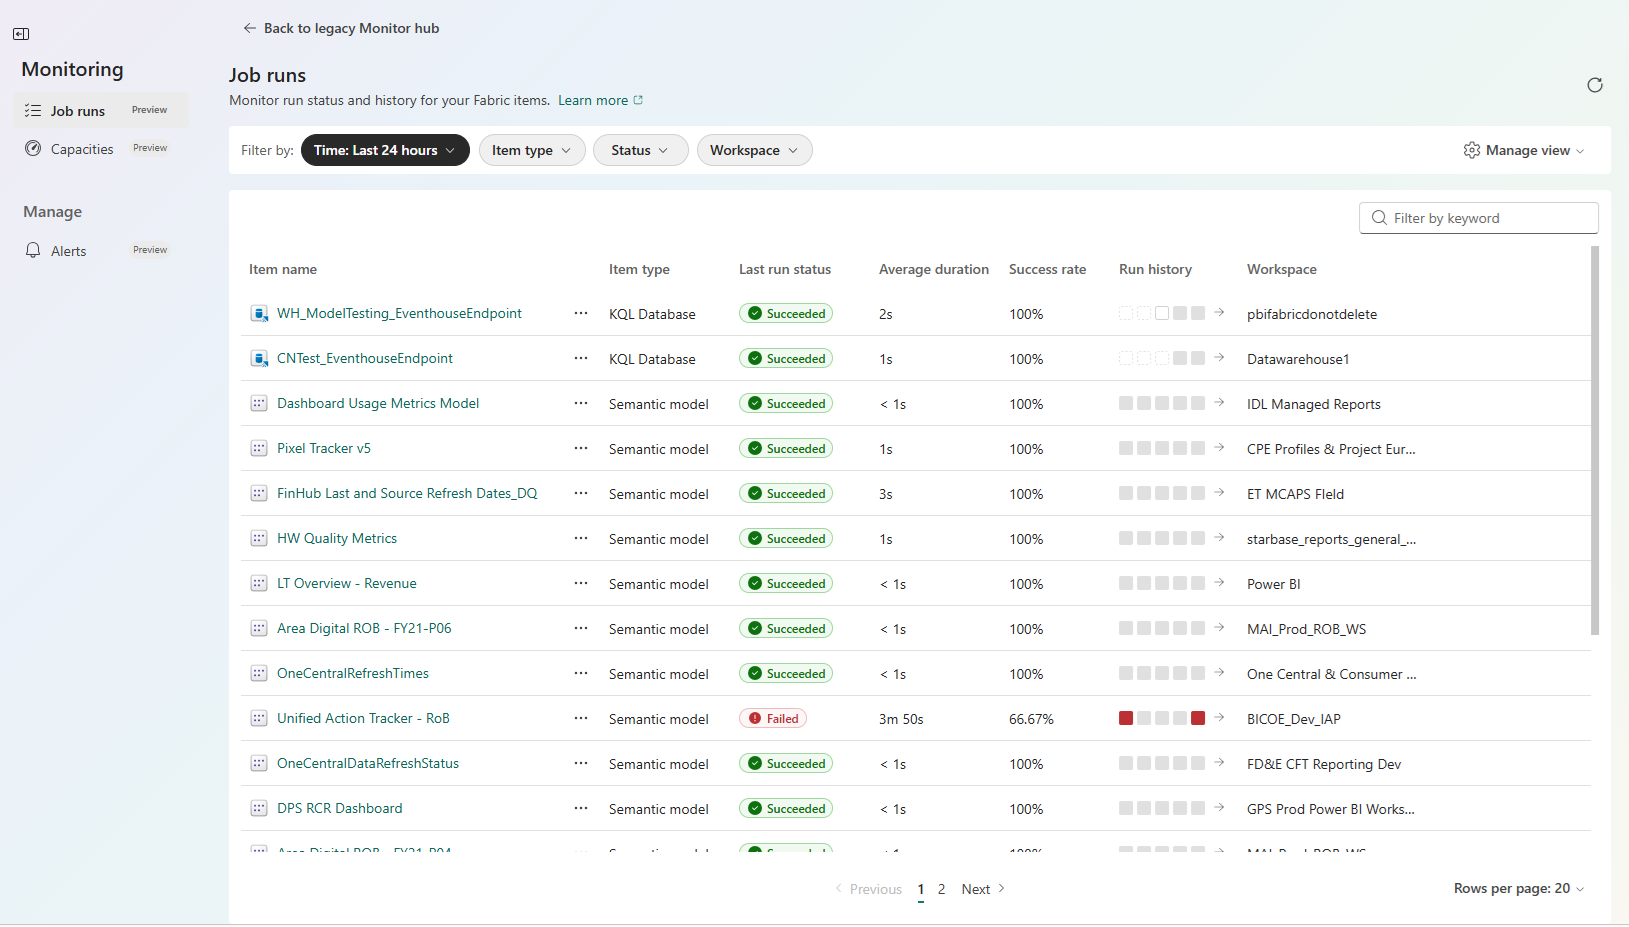
Select Job runs. The page shows a list of job runs for your workspace, with a summarized history of the last five runs for each item. The Last run status column uses a color-coded indicator for each status (In progress, Succeeded, Failed, and Canceled), making failures easy to see.
Sort and filter the job runs view
Use the following options to find the job runs you're interested in.
- Set the time range: Use the Time range selector to scope the list to a time period, such as the last hour, 6 hours, 24 hours, or the number of days. If a run you expect is missing, check the time range and adjust it as needed.
- Sort and customize columns: Select a column header to sort the list. For example, sort by Item name for an alphabetical view or by Average duration to find the longest runs. Use Manage view > Column Options to add, remove, or reorder columns. Use Manage view > Save view to save your custom view.
- Use the filter drop-down menus: To find a group of runs, use the drop-down menus to filter by Item type, job Status, or Workspace. For example, filter by failed status to create a focused worklist.
- Filter by keyword: Type text in the search box to list only those items that contain the text.
Tip
Keyword search checks only items loaded on the current page. The filter drop-down menus don't have this limitation. If your items span multiple pages, use the drop-down menus to narrow the list, and then select Manage view > Save view. Search the saved view to find specific items within that focused list.
- Refresh the list: The page retrieves job data when it loads and doesn't update continuously. Select the Reload icon in the upper right to see updates for active or recently triggered runs.
Save views
After you filter and customize your view of the jobs run list, you can save it for later use:
- Select Manage view > Save view.
- Enter a name for your view and select Save.
- Your saved view is now available under Manage view > Saved views.
Get job run details
To see details about a job run, select it in the list. A pane opens to the side showing details about the job and its run history. These views help you drill down to the cause of failures without leaving the Monitor hub.

View more details about job runs
Under Last run details, expand Advanced details to find out more about the workspace, who submitted the job, and what invoked the job run.
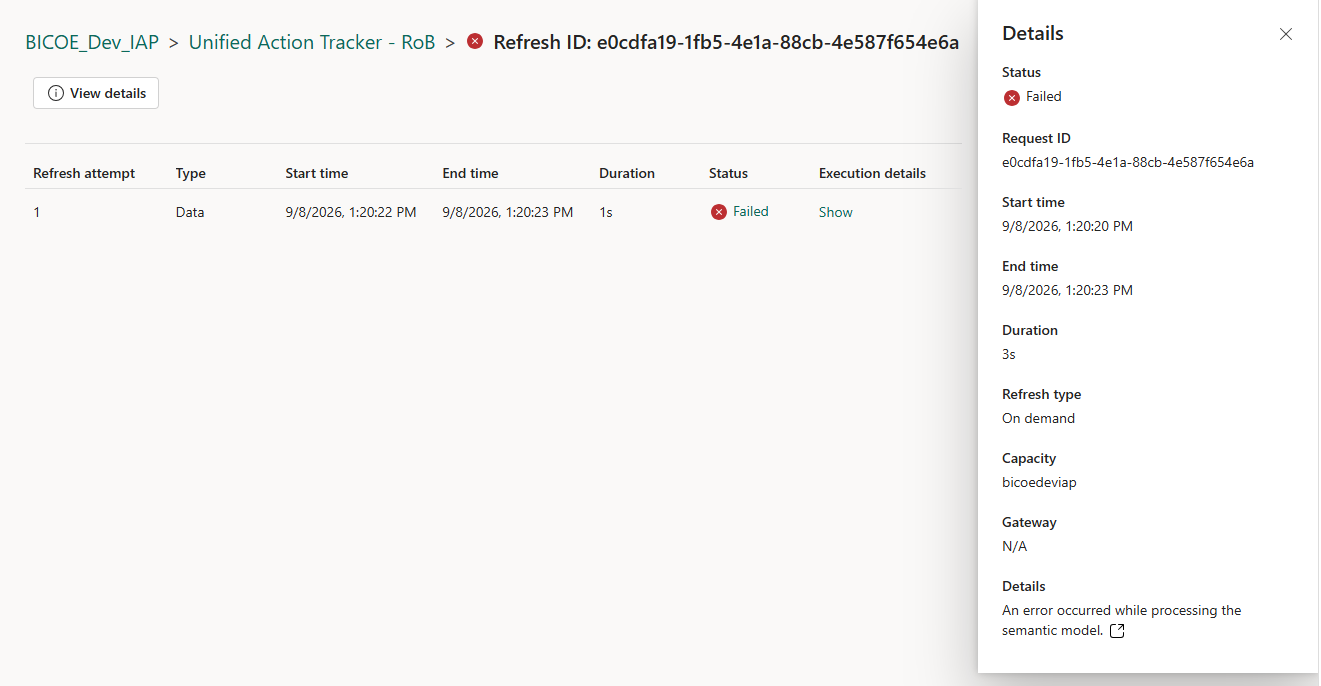
Select Run history and review past runs to understand patterns and recurring issues. Select a run to open a pane that shows advanced Run details, including options to view the activities as a table or a Gantt chart.

Select the Open detail page icon next to a run in the item's list to open the full detail page. For complex items such as pipelines and dataflows, the details pane includes the execution flow, activity tables, and Gantt charts.

Open an item to view its authoring page
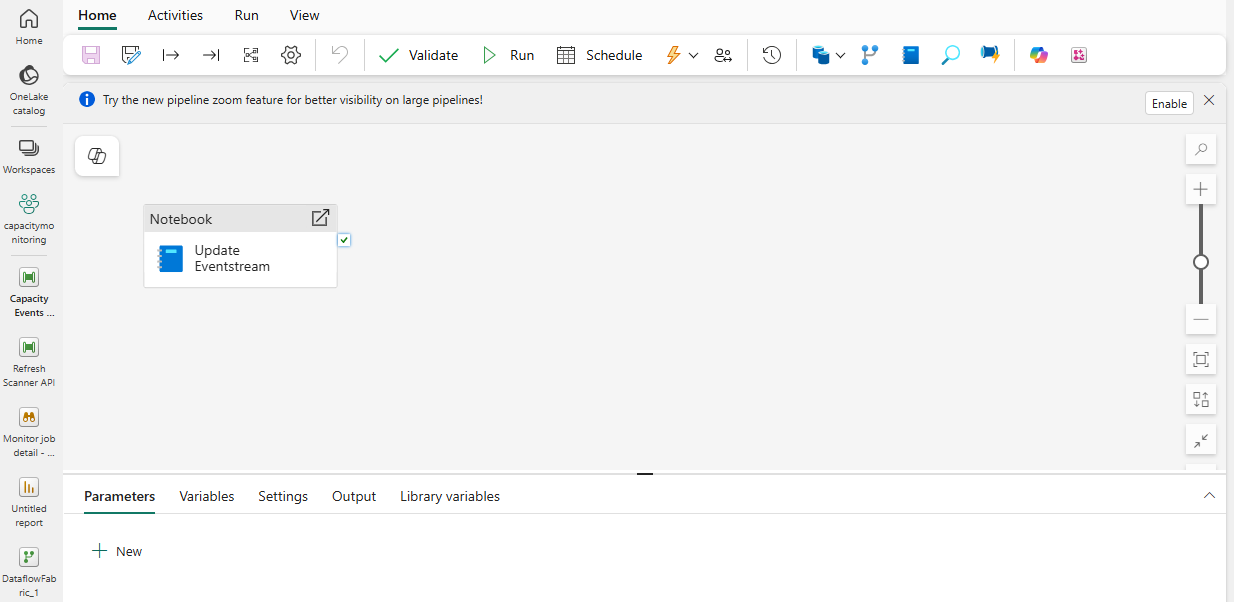
You can open the authoring page for an item directly from the job runs list by using either of these methods:
In the job runs list, select the Open item icon next to an item.
Select the item to open the job run details pane, and then select Open item.
Investigate job runs
On the Job runs page, the Last run status column provides key information about each run. Use the status to determine what action to take next.
| Status | What it means | What to do next |
|---|---|---|
| Queued or not started | The run is waiting for resources. | Wait. If it stays queued, check capacity availability. |
| In progress | The run is executing now. | Monitor its duration and refresh for updates. |
| Succeeded | The run finished without error. | No action needed. |
| Failed | The run ended with an error. | Open the run details to read the error and the logs. |
| Canceled | Someone stopped the run before it finished. | Rerun it if the work still needs to happen. |
Investigate a failed run with the Operations agent (preview)
For failed pipeline runs, you can start a read-only investigation directly from the Monitor hub. The Operations agent, a Real-Time Intelligence item, reviews the failed run and surfaces likely root causes without changing your pipeline or its configuration.
- In the Job runs list, select a failed pipeline job to open its details.
- Under Run history, find the failed run.
- Select Investigate on that run. The Operations agent pane opens and starts a read-only investigation of the run.
For Operations agent setup, prerequisites, governance, responsible AI guidance, limitations, and troubleshooting, see Create and configure operations agents.
Common tasks
The following table summarizes the most common day-to-day tasks on the page.
| To do this | Do this |
|---|---|
| Find a specific run | Type its name in search. |
| See only failures | Filter the list by failed status. |
| Look further back in time | Widen the time range. |
| Change what the list shows | Sort by a column header, or use column options to add, remove, and reorder columns. |
| Get the latest state | Select Refresh. |
| Investigate a run | Select the row to open its details. For a failed pipeline run, select Investigate on the run to launch the Operations agent. |
Supported item types in the Job runs page
The Job runs page shows activities for these Fabric items:
- Copy Job
- Dataflow Gen2
- Dataflow Gen2 CI/CD
- Datamart
- Data Build Tool (dbt) Job
- Digital Twin Builder Flow
- Experiment
- Graph model
- Lakehouse
- Map
- Notebook
- Pipeline
- Semantic model
- Snowflake database
- Spark job definition
- User data function
The Job runs page doesn't support or show Dataflow Gen1.